 Open Access Article
Creative Commons Attribution 3.0 Unported Licence
Synergism between non-ionic and cationic surfactants in a concentration range of mixed monolayers at an air–water interface
Ahmad Bagheri * and
Paresa Khalili
Department of Chemistry, Semnan University, P.O. Box 35131-19111, Semnan, Iran. E-mail: abagheri@semnan.ac.ir; Fax: +98 2333654057; Tel: +98 2333654057
First published on 24th March 2017
Abstract
The surface properties and adsorption behavior of mixed binary surfactants containing alkylpyridinium chloride (CnPC, n = 14 and 16) and Triton X-100 (TX100) have been studied at 298.15 K. The values of the molecular interaction parameter (βs) and the mole fraction of components (Xsi) at the air–water interface in the pre-micellar region were calculated on the basis of Rosen's model. In the new approach, we proposed to estimate surface parameters (βs, Xsi, Γtot, Atot, ΓTX100 and ΓCnPC) in a pre-micellar region, using different fixed values of the surface tension instead of a single-value of surface tension. Then, the influence of surface tension on the surface properties was investigated. The interaction parameter (βs) is negative at all compositions showing a synergistic effect between the components. The βs was found to considerably decrease (less negative values) with decreasing surface tension due to more migration of TX100 to the surface layer and a reduction in electrostatic self-repulsion between head groups in the ionic surfactant. Also, the total surface area (Atot) at the air–water interface decreases with increasing Xs1 (mole fraction of TX100 in mixed monolayer) or decreasing surface tension due to the dilution effect on mixing.
1. Introduction
The interfacial and micellar properties of surfactant mixtures have been extensively studied because of their wide applications, such as hydrate promoters (or inhibitors), biologicals, detergents (foaming), in fabric softening, pharmaceuticals, enhanced oil recovery process etc.1–4 In most cases, the mixture of surfactants often has a better ability to modify the interfacial properties and to generate a high foam volume than the individual surfactants and also the mixtures are advantageous because the purification of a single compound may be too costly and difficult.4–8 When two or more surfactants are present in a solution, a mixed monolayer in the interface and mixed micelles in bulk solution are formed as a result of a complex balance of intermolecular forces. Because of this, there have been significant studies on the molecular interactions between various amphiphilic compounds in their binary mixtures (surfactant–surfactant, drug-surfactant and etc.), especially in relation to the existence of synergism or antagonism (negative synergism) between surfactants. Synergism (antagonism) is defined here as the condition in which the properties of the mixture are better (worse) than those achievable with the pure components separately.7–14Although many researchers have studied synergism (or antagonism) between two surfactants at an interface (by calculating the interaction parameter (βs) and the interfacial mole fractions (Xsi)), which are conveniently obtained from surface tension-concentration data using Rosen's model,15–17 but almost all papers, these parameters were evaluated at a fixed surface tension value (≈45 mN m−1) in pre-micellar region (not at different levels of fixed surface tension).16–23
In the our previous paper, surface tensions of binary mixtures of Triton-X100 (TX100) with a set of two cationic surfactants (tetradecyl pyridinium chloride (C14PC) and hexadecyl pyridinium chloride (C16PC)) were measured as a function of total concentration using the Du Noüy ring-detachment method.24
In the present study, in a new approach, the interaction parameter (βs) and the mole fraction of surfactant i (Xsi) at the air–water interface (in the above mentioned binary systems) are determined over the whole range of surface tension (at least 9 points) in pre-micellar region, and the influence of surface tension is investigated on the surface parameters (βs and Xsi).
After estimation of surface parameters (Xsi, βs), the total surfactant adsorption (Γtot), the adsorbed amount of CnPC (ΓCnPC) and the adsorbed amount of TX100 (ΓTX100) were obtained at any fixed surface tension value before CMC. Also, the average surface area per molecule of components (Atot) at the air–water interface is determined using the total surfactant adsorption (Γtot). The values of Atot for systems of CnPC(2)/TX100(1) decrease with decreasing the mole fraction of surfactant 2 in the total mixed monolayer (Xs2) and the surface tension of mixture at each constant value of the bulk mole fraction (yi).
The results showed that surface and thermodynamic properties of the mixed monolayer depend on the alkyl chain length of cationic surfactant, surface tension of mixture and ionic–nonionic surfactants ratio in the mixed systems. In this work, the experimental data have been collected from our previous paper.24
2. Theory and methods
2.1. Composition of mixed adsorbed monolayers
The nature and intensity of the interaction between two surfactants in the mixed monolayer at the air–water interface can be estimated by determining the values of the interaction parameter βs. The interaction parameter (βs) evaluate the interaction between two unlike surfactants, relative to the self-interaction of the corresponding pure surfactants before mixing.A negative value of βs indicates that interactions in mixed monolayer at the air–water interface are more attractive than the self-interaction of the two surfactants prior to mixing. However, a positive value of βs indicates that the attractive interaction of the two different surfactants with each other in mixed monolayer is weaker than the average attractive interaction of the two surfactants before mixing.13,14
The interaction (attraction or repulsion) between two surfactant in the mixed micellar system was further analyzed using Rubingh's model (regular solution theory).7,15,25
In this work, the interaction parameter at interface (βs) is calculated using eqn (1) and (2). eqn (1) is solved iteratively for Xs1 which is then substituted into eqn (2) to calculate βs. This idea was initially proposed by Rosen and Hua which is based upon the application of the regular solution theory and Rubingh's model:16,17
 | (1) |
 | (2) |
In this work, the values of C1, C2 and C12 are obtained from the surface tension versus concentration plots (σ–C curves) of aqueous solutions of the individual surfactants and their mixtures at a given surface tension value which is in range of ≈42 to 52 mN m−1 in pre-micellar region.
2.2. Adsorption of the individual surfactants and their mixture at air–water interface
The adsorption process involves the transport of molecules from the bulk solution to the interface, where they form specially oriented molecular layers according to the nature of the two phases. The Gibbs adsorption isotherm for multicomponent systems is an equation used to relate the changes in concentration of a component in contact with a surface with changes in the surface tension. For a binary system containing two surfactants, from the Gibbs equation, total adsorption, Γtot, was calculated according to the expression:
 | (3) |
The data between σ and log![[thin space (1/6-em)]](https://www.rsc.org/images/entities/char_2009.gif) Ctot were fitted by a second-order polynomial equation, then from the differentiation of this equation, the total adsorption values (Γtot) were calculated at various fixed surface tension (for each Ctot value). Then the average surface area per molecule of surfactants (Atot) at the interface was obtained from the relation:
Ctot were fitted by a second-order polynomial equation, then from the differentiation of this equation, the total adsorption values (Γtot) were calculated at various fixed surface tension (for each Ctot value). Then the average surface area per molecule of surfactants (Atot) at the interface was obtained from the relation:
 | (4) |
The total adsorption values (Γtot) and the mole fraction of surfactant ith in the mixed monolayer (Xsi) (as described above section) can be used to find out the adsorbed amount of the individual surfactant in the mixed monolayer (ΓTX100 and ΓCnPC):27
| Γ1 = Xs1Γtot | (5) |
| Γ2 = Xs2Γtot | (6) |
Surfactant 1 always refers to TX100 and surfactant 2 refers to CnPC in binary mixtures.
3. Results and discussion
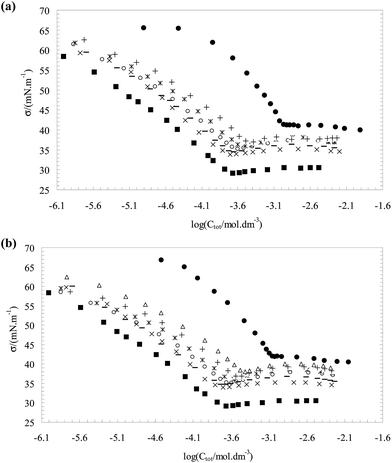
Fig. 1(a and b) show plots of surface tension σ as a function of the total surfactant concentration C(log![[thin space (1/6-em)]](https://www.rsc.org/images/entities/char_2009.gif) Ctot) for the pure CnPC, the pure TX100 and for two surfactant mixtures at bulk mole fraction range of (y1 ≈ 0.1–0.6) with an interval of almost 0.1. The surfactant molecules have the tendency to adsorb to fluid interface in which the hydrophilic parts are attached to the surface and hydrophobic parts are oriented in parallel (not parallel) position, this structure decrease the interaction between water molecules in interface which consequently decreases the surface tension values.24
Ctot) for the pure CnPC, the pure TX100 and for two surfactant mixtures at bulk mole fraction range of (y1 ≈ 0.1–0.6) with an interval of almost 0.1. The surfactant molecules have the tendency to adsorb to fluid interface in which the hydrophilic parts are attached to the surface and hydrophobic parts are oriented in parallel (not parallel) position, this structure decrease the interaction between water molecules in interface which consequently decreases the surface tension values.24
At very low concentrations of the surfactant, only monomers are present in bulk solution and interface. As the concentration of the surfactant is increased, the surface tension at the air–liquid interface is lowered until the solution critical micelle concentration (CMC) is reached. After the CMC is reached, the surface tension at the air–liquid interface typically remains constant.
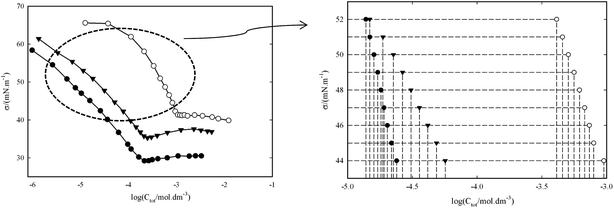
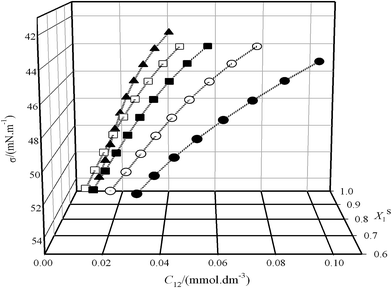
Any further increase in concentration does not change the surface tension (Ct ≥ CMC). The CMC is indicated by a sharp break in all curves. These plots were used to determine the C1, C2, C12 at Ct ≤ CMC and CMC values. In this study, for the calculation of C1, C2 and C12 were used the various fixed values of surface tension in pre-micellar region (see Fig. 2) and then, the influence of surface tension on the surface properties is investigated.
The data (σ–Ci) in Fig. 1(a and b) doesn't exactly support the concentrations (C1, C2 and C12) at σ = 43, 44, …52 mN m−1, therefore, the experimental data (σ–Ci) were fitted with a second-order equation to obtain the required concentrations (C1, C2 and C12) for eqn (1) and (2).
In Table 1, the obtained C1 (the molar concentrations of CnPC) and C2 (the molar concentrations of TX100) values are listed from correlation between σ and log![[thin space (1/6-em)]](https://www.rsc.org/images/entities/char_2009.gif) Ci at any given surface tension value in pre-micellar region for three individual surfactant. Also, Table 2 summarized the surface properties (βs, Xsi, Γtot, Atot, ΓTX100 and ΓCnPC) that obtained at different mole fraction of surfactant in the bulk solution.
Ci at any given surface tension value in pre-micellar region for three individual surfactant. Also, Table 2 summarized the surface properties (βs, Xsi, Γtot, Atot, ΓTX100 and ΓCnPC) that obtained at different mole fraction of surfactant in the bulk solution.
| σ/(mN m−1) | CTX1001/(mmol dm−3) | CC214PC (mmol−1 dm−3) | CC216PC (mmol−1 dm−3) |
|---|---|---|---|
| 52 | 0.0138 | 0.4113 | 0.3454 |
| 51 | 0.0149 | 0.4564 | 0.3828 |
| 50 | 0.0160 | 0.5066 | 0.4229 |
| 49 | 0.0171 | 0.5608 | 0.4658 |
| 48 | 0.0182 | 0.6180 | 0.5119 |
| 47 | 0.0191 | 0.6768 | 0.5613 |
| 46 | 0.0203 | 0.7362 | 0.6143 |
| 45 | 0.0218 | 0.7951 | 0.6710 |
| 44 | 0.0239 | 0.9522 | 0.7318 |
| 43 | 0.0267 | — | 0.7969 |
| σ/(mN m−1) | C12/(mmol dm−3) | Xs1 | Xs2 | βs | Γtot/(μmol m−2) | Atot/(Å2) | Surface coverage | Γ1/(μmol m−2) | Γ2/(μmol m−2) |
|---|---|---|---|---|---|---|---|---|---|
| For C14PC(2)/TX100(1) at y1 = 0.1999 | |||||||||
| 52 | 0.0311 | 0.6719 | 0.3281 | −3.75 | 2.142 | 77.54 | 0.70 | 1.439 | 0.703 |
| 51 | 0.0372 | 0.6890 | 0.3110 | −3.29 | 2.205 | 75.32 | 0.73 | 1.517 | 0.686 |
| 50 | 0.0444 | 0.7078 | 0.2922 | −2.85 | 2.267 | 73.28 | 0.75 | 1.604 | 0.662 |
| 49 | 0.0527 | 0.7318 | 0.2682 | −2.38 | 2.327 | 71.38 | 0.78 | 1.703 | 0.624 |
| 48 | 0.0624 | 0.7640 | 0.2360 | −1.84 | 2.387 | 69.60 | 0.80 | 1.823 | 0.563 |
| 47 | 0.0738 | 0.8072 | 0.1928 | −1.22 | 2.445 | 67.93 | 0.81 | 1.974 | 0.471 |
| 46 | 0.0870 | 0.8644 | 0.1356 | −0.48 | 2.503 | 66.37 | 0.83 | 2.163 | 0.339 |
| 45 | 0.1023 | 0.9346 | 0.0654 | −0.52 | 2.560 | 64.90 | 0.86 | 2.392 | 0.167 |
![[thin space (1/6-em)]](https://www.rsc.org/images/entities/char_2009.gif) |
|||||||||
| For C14PC(2)/TX100(1) at y1 = 0.2948 | |||||||||
| 52 | 0.0212 | 0.6915 | 0.3085 | −4.47 | 2.049 | 81.06 | 0.73 | 1.439 | 0.703 |
| 51 | 0.0266 | 0.7159 | 0.2841 | −3.77 | 2.137 | 77.67 | 0.75 | 1.517 | 0.686 |
| 50 | 0.0318 | 0.7368 | 0.2632 | −3.28 | 2.210 | 75.17 | 0.77 | 1.605 | 0.662 |
| 49 | 0.0372 | 0.7587 | 0.2413 | −2.85 | 2.272 | 73.12 | 0.80 | 1.703 | 0.624 |
| 48 | 0.0431 | 0.7845 | 0.2155 | −2.40 | 2.329 | 71.31 | 0.82 | 1.823 | 0.563 |
| 47 | 0.0497 | 0.8165 | 0.1835 | −1.90 | 2.386 | 69.62 | 0.84 | 1.974 | 0.471 |
| 46 | 0.0573 | 0.8556 | 0.1444 | −1.32 | 2.448 | 68.00 | 0.86 | 2.164 | 0.339 |
| 45 | 0.0663 | 0.9013 | 0.0987 | −0.64 | 2.500 | 66.43 | 0.87 | 2.392 | 0.167 |
| 44 | 0.0770 | 0.9491 | 0.0509 | −0.13 | 2.559 | 64.92 | 0.88 | 1.439 | 0.703 |
![[thin space (1/6-em)]](https://www.rsc.org/images/entities/char_2009.gif) |
|||||||||
| For C14PC(2)/TX100(1) at y1 = 0.4023 | |||||||||
| 52 | 0.0148 | 0.6996 | 0.3004 | −5.39 | 2.006 | 82.81 | 0.72 | 1.403 | 0.603 |
| 51 | 0.0188 | 0.7235 | 0.2765 | −4.63 | 2.085 | 79.69 | 0.75 | 1.508 | 0.576 |
| 50 | 0.0226 | 0.7437 | 0.2563 | −4.09 | 2.146 | 77.40 | 0.77 | 1.596 | 0.5501 |
| 49 | 0.0266 | 0.7646 | 0.2354 | −3.62 | 2.200 | 75.51 | 0.79 | 1.682 | 0.518 |
| 48 | 0.0309 | 0.7893 | 0.2107 | −3.14 | 2.250 | 73.82 | 0.81 | 1.776 | 0.474 |
| 47 | 0.0358 | 0.8200 | 0.1800 | −2.59 | 2.299 | 72.24 | 0.82 | 1.885 | 0.414 |
| 46 | 0.0416 | 0.8581 | 0.1419 | −1.95 | 2.349 | 70.71 | 0.85 | 2.016 | 0.333 |
| 45 | 0.0485 | 0.9042 | 0.0958 | −1.18 | 2.400 | 69.21 | 0.86 | 2.170 | 0.230 |
| 44 | 0.0568 | 0.9558 | 0.0442 | −0.24 | 2.452 | 67.75 | 0.88 | 2.344 | 0.108 |
![[thin space (1/6-em)]](https://www.rsc.org/images/entities/char_2009.gif) |
|||||||||
| For C14PC(2)/TX100(1) at y1 = 0.4986 | |||||||||
| 52 | 0.0119 | 0.7088 | 0.2912 | −5.98 | 2.006 | 82.81 | 0.72 | 1.403 | 0.603 |
| 51 | 0.0148 | 0.7302 | 0.2698 | −5.26 | 2.085 | 79.69 | 0.75 | 1.508 | 0.576 |
| 50 | 0.0178 | 0.7491 | 0.2509 | −4.73 | 2.146 | 77.40 | 0.77 | 1.596 | 0.550 |
| 49 | 0.0210 | 0.7694 | 0.2306 | −4.23 | 2.200 | 75.51 | 0.79 | 1.682 | 0.518 |
| 48 | 0.0246 | 0.7936 | 0.2064 | −3.71 | 2.250 | 73.82 | 0.81 | 1.776 | 0.474 |
| 47 | 0.0286 | 0.8233 | 0.1767 | −3.13 | 2.299 | 72.24 | 0.82 | 1.885 | 0.414 |
| 46 | 0.0333 | 0.8595 | 0.1405 | −2.47 | 2.349 | 70.71 | 0.85 | 2.016 | 0.333 |
| 45 | 0.0388 | 0.9018 | 0.0982 | −1.71 | 2.400 | 69.21 | 0.86 | 2.170 | 0.230 |
| 44 | 0.0453 | 0.9472 | 0.0528 | −0.89 | 2.452 | 67.75 | 0.88 | 2.344 | 0.108 |
![[thin space (1/6-em)]](https://www.rsc.org/images/entities/char_2009.gif) |
|||||||||
| For C14PC(2)/TX100(1) at y1 = 0.6009 | |||||||||
| 52 | 0.0150 | 0.7880 | 0.2120 | −4.32 | 2.528 | 65.72 | 0.82 | 1.992 | 0.536 |
| 51 | 0.0171 | 0.8043 | 0.1957 | −3.98 | 2.556 | 65.00 | 0.83 | 2.056 | 0.500 |
| 50 | 0.0189 | 0.8132 | 0.1868 | −3.82 | 2.578 | 64.44 | 0.84 | 2.096 | 0.481 |
| 49 | 0.0207 | 0.8211 | 0.1789 | −3.70 | 2.597 | 63.97 | 0.85 | 2.132 | 0.465 |
| 48 | 0.0227 | 0.8316 | 0.1684 | −3.53 | 2.616 | 63.51 | 0.85 | 2.175 | 0.441 |
| 47 | 0.0249 | 0.8458 | 0.1542 | −3.29 | 2.636 | 63.03 | 0.86 | 2.229 | 0.406 |
| 46 | 0.0276 | 0.8641 | 0.1359 | −2.95 | 2.658 | 62.50 | 0.87 | 2.297 | 0.361 |
| 45 | 0.0311 | 0.8854 | 0.1146 | −2.54 | 2.683 | 61.92 | 0.87 | 2.375 | 0.308 |
| 44 | 0.0355 | 0.9083 | 0.0917 | −2.21 | 2.711 | 61.28 | 0.88 | 2.462 | 0.249 |
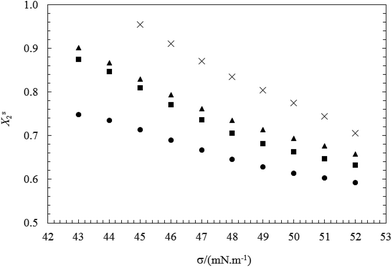
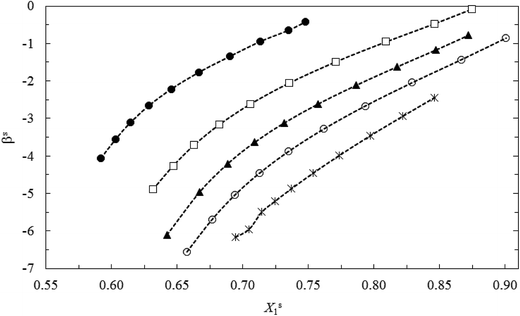
The obtained results show that Xs1 value increase and Xs2 value decrease with decreasing the surface tension mixture at each bulk mole fraction (y1).
This indicates the formation of interface in surfactant mixtures, the component with the lower CMC is usually dominant at the air–water interface due to its higher surface activity. The above results are in accordance with the fact that TX100 is much more surface active than CnPC (see Fig. 3 and 4).
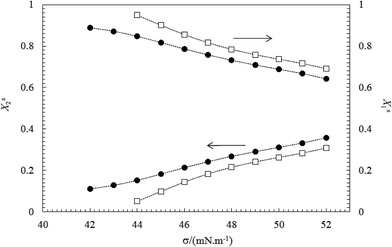
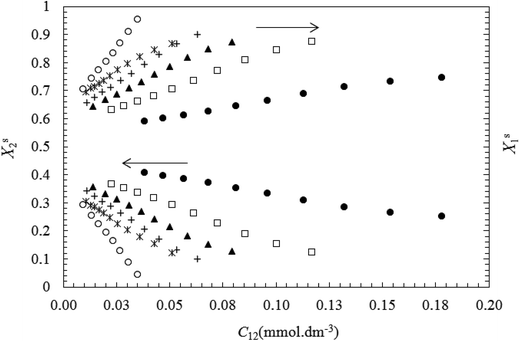
The changes in Xs1 and Xs2 with increasing total concentration (C12) of the mixed surfactants (or with decreasing σ values) are shown in Fig. 5 and 6. These figures show that the mole fraction of TX100 (Xs1) increases and the corresponding the mole fraction of CnPC (Xs2) at the air–water interface decreases continuously as a function of the total concentration (or surface tension). This indicates that CnPC molecules present at the original interface are continuously being displaced by TX100 molecules, due to the higher tendency of TX100 to surface.
In order to gain further information about the nature and strength of the interaction among the two surfactants at the surface, we evaluated the interaction parameter for mixed monolayer formation (βs) at various surface tension.
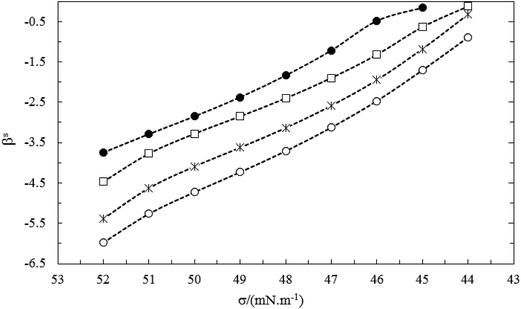
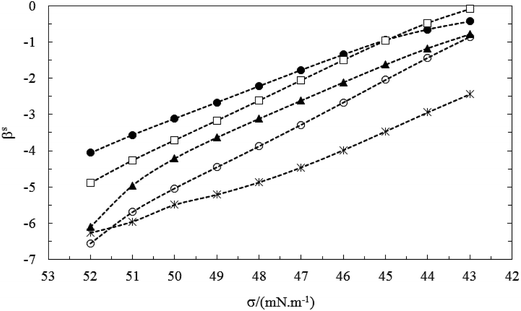
The βs values are always negative in both systems (see Table 2). This indicates that the interactions between the two different surfactants after mixing (TX100 and CnPC) are more attractive or less repulsive than before mixing. Before mixing, the ionic surfactant, CnPC, has a strong electrostatic self-repulsion, the nonionic surfactant, TX100, has a steric self-repulsion. After mixing, both of these interactions are weakened by a dilution effect. On the other hand, an ion-dipole attractive interaction and Van der Waals attraction (between the hydrophilic groups) are formed between cationic–nonionic surfactants after mixing of the two components.13,14 In the studied systems at all the bulk mole fractions (y1), the βs values decreased (less negative) with decrease of the surface tension at before CMC due to reduction of the mole fraction of CnPC at the air–water interface (Xs2) or increase of the mole fraction of TX100 at the air–water interface (Xs1). In fact, the reduction of CnPC molecules and increase of TX100 molecules at interface decreased the electrostatic self-repulsion interaction between two molecules of CnPC at interface upon mixing (see Fig. 7–9).
In the same bulk mole fraction of two studied systems (for example y1 ≈ 0.199), the mean values of βs(![[small beta, Greek, macron]](https://www.rsc.org/images/entities/i_char_e0c3.gif) s) for C16PC/TX100 system is more negative than C14PC/TX100 system. The larger values of
s) for C16PC/TX100 system is more negative than C14PC/TX100 system. The larger values of ![[small beta, Greek, macron]](https://www.rsc.org/images/entities/i_char_e0c3.gif) s for the C16PC/TX100 system can be ascribed to the larger Van der Waals force between the longer lipophilic groups of this system after mixing and more presence of C16PC at interface, compared to the C14PC/TX100 system (see Fig. 10).
s for the C16PC/TX100 system can be ascribed to the larger Van der Waals force between the longer lipophilic groups of this system after mixing and more presence of C16PC at interface, compared to the C14PC/TX100 system (see Fig. 10).
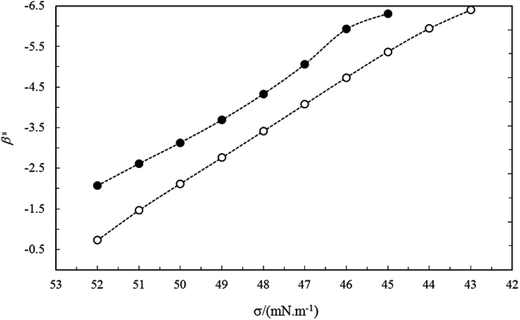 | ||
| Fig. 10 The interaction parameter at interface (βs) vs. surface tension of mixture for the CnPC(2)/TX100(1) systems with the same mole fractions (y1 = 0.199): (●) C14PC and (○) C16PC. | ||
From another point of view, the electrostatic self-repulsion interactions between ionic surfactants decrease with increasing the hydrophilic group of the ionic surfactant in cationic–nonionic surfactant mixtures.
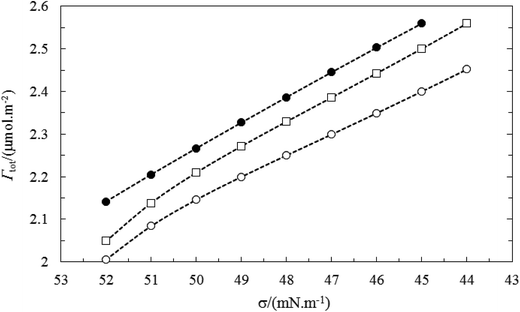
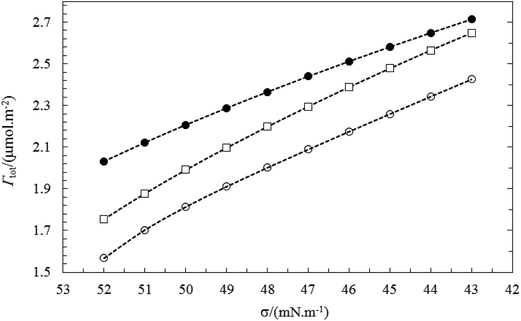
The above results are in accordance with the fact that TX100 is much more surface active than CnPC. The total adsorbed amount of the mixture (Γtot) at the air–water surface can be calculated using the eqn (3). Fig. 11 and 12 show the behavior of total adsorption with surface tension, typically. For all the systems studied the total adsorption (Γtot) increase with the decrease of surface tension and finally reaches a maximum value of the saturated surface adsorption (almost in CMC point). Also, the results of Table 3 show the Γtot value increases gradually with increasing the total concentration of surfactant.
| σ/(mN m−1) | C12/(mmol dm−3) | Xs1 | Xs2 | βs | Γtot/(μmol m−2) | Atot/(Å2) | Surface coverage | Γ1/(μmol m−2) | Γ2/(μmol m−2) |
|---|---|---|---|---|---|---|---|---|---|
| For C16PC(2)/TX100(1) at y1 = 0.1093 | |||||||||
| 52 | 0.0382 | 0.5920 | 0.4080 | −4.06 | 2.033 | 81.73 | 0.70 | 1.203 | 0.829 |
| 51 | 0.0467 | 0.6030 | 0.3970 | −3.56 | 2.122 | 78.27 | 0.73 | 1.280 | 0.843 |
| 50 | 0.0566 | 0.6144 | 0.3856 | −3.11 | 2.207 | 75.27 | 0.76 | 1.356 | 0.851 |
| 49 | 0.0679 | 0.6283 | 0.3717 | −2.66 | 2.288 | 72.61 | 0.79 | 1.437 | 0.851 |
| 48 | 0.0809 | 0.6456 | 0.3544 | −2.22 | 2.365 | 70.23 | 0.81 | 1.527 | 0.838 |
| 47 | 0.0958 | 0.6665 | 0.3335 | −1.77 | 2.440 | 68.08 | 0.84 | 1.626 | 0.814 |
| 46 | 0.1127 | 0.6902 | 0.3098 | −1.34 | 2.512 | 66.13 | 0.87 | 1.734 | 0.778 |
| 45 | 0.1318 | 0.7135 | 0.2865 | −0.94 | 2.581 | 64.35 | 0.89 | 1.842 | 0.740 |
| 44 | 0.1535 | 0.7347 | 0.2653 | −0.65 | 2.649 | 62.72 | 0.91 | 1.946 | 0.703 |
| 43 | 0.1777 | 0.7476 | 0.2524 | −0.43 | 2.714 | 61.22 | 0.93 | 2.029 | 0.685 |
![[thin space (1/6-em)]](https://www.rsc.org/images/entities/char_2009.gif) |
|||||||||
| For C16PC(2)/TX100(1) at y1 = 0.1995 | |||||||||
| 52 | 0.0226 | 0.6318 | 0.3682 | −4.88 | 1.755 | 94.67 | 0.60 | 1.109 | 0.646 |
| 51 | 0.0283 | 0.6471 | 0.3529 | −4.26 | 1.878 | 88.48 | 0.61 | 1.215 | 0.663 |
| 50 | 0.0349 | 0.6631 | 0.3369 | −3.71 | 1.991 | 83.44 | 0.68 | 1.320 | 0.671 |
| 49 | 0.0424 | 0.6822 | 0.3178 | −3.16 | 2.097 | 79.21 | 0.71 | 1.431 | 0.667 |
| 48 | 0.0511 | 0.7061 | 0.2939 | −2.61 | 2.198 | 75.56 | 0.75 | 1.552 | 0.646 |
| 47 | 0.0611 | 0.7356 | 0.2644 | −2.05 | 2.295 | 72.37 | 0.78 | 1.688 | 0.607 |
| 46 | 0.0725 | 0.7706 | 0.2294 | −1.49 | 2.389 | 69.55 | 0.81 | 1.841 | 0.548 |
| 45 | 0.0855 | 0.8092 | 0.1908 | −0.96 | 2.478 | 67.03 | 0.84 | 2.005 | 0.473 |
| 44 | 0.1003 | 0.8463 | 0.1537 | −0.47 | 2.565 | 64.76 | 0.87 | 2.171 | 0.394 |
| 43 | 0.1169 | 0.8746 | 0.1254 | −0.08 | 2.648 | 62.72 | 0.90 | 2.316 | 0.332 |
![[thin space (1/6-em)]](https://www.rsc.org/images/entities/char_2009.gif) |
|||||||||
| For C16PC(2)/TX100(1) at y1 = 0.2901 | |||||||||
| 52 | 0.0140 | 0.6422 | 0.3578 | −6.11 | 1.721 | 96.52 | 0.63 | 1.105 | 0.616 |
| 51 | 0.0197 | 0.6673 | 0.3327 | −4.96 | 1.868 | 88.93 | 0.68 | 1.247 | 0.621 |
| 50 | 0.0252 | 0.6885 | 0.3115 | −4.21 | 1.973 | 84.20 | 0.72 | 1.358 | 0.615 |
| 49 | 0.0307 | 0.7091 | 0.2909 | −3.63 | 2.057 | 80.74 | 0.75 | 1.459 | 0.598 |
| 48 | 0.0365 | 0.7317 | 0.2683 | −3.12 | 2.131 | 77.94 | 0.78 | 1.560 | 0.572 |
| 47 | 0.0428 | 0.7575 | 0.2425 | −2.61 | 2.200 | 75.50 | 0.80 | 1.670 | 0.534 |
| 46 | 0.0500 | 0.7865 | 0.2135 | −2.11 | 2.267 | 73.28 | 0.82 | 1.783 | 0.484 |
| 45 | 0.0583 | 0.8174 | 0.1826 | −1.62 | 2.333 | 71.21 | 0.85 | 1.907 | 0.426 |
| 44 | 0.0679 | 0.8473 | 0.1527 | −1.17 | 2.398 | 69.26 | 0.87 | 2.032 | 0.366 |
| 43 | 0.0792 | 0.8719 | 0.1281 | −0.78 | 2.465 | 67.40 | 0.90 | 2.149 | 0.316 |
![[thin space (1/6-em)]](https://www.rsc.org/images/entities/char_2009.gif) |
|||||||||
| For C16PC(2)/TX100(1) at y1 = 0.3777 | |||||||||
| 52 | 0.0140 | 0.0112 | 0.6575 | −6.56 | 1.567 | 106.0 | 0.55 | 1.030 | 0.537 |
| 51 | 0.0197 | 0.0147 | 0.6767 | −5.69 | 1.703 | 97.56 | 0.60 | 1.152 | 0.550 |
| 50 | 0.0252 | 0.0183 | 0.6942 | −5.04 | 1.813 | 91.62 | 0.64 | 1.259 | 0.555 |
| 49 | 0.0307 | 0.0223 | 0.7129 | −4.45 | 1.911 | 86.95 | 0.67 | 1.362 | 0.548 |
| 48 | 0.0365 | 0.0268 | 0.7351 | −3.88 | 2.001 | 83.00 | 0.70 | 1.471 | 0.530 |
| 47 | 0.0428 | 0.0320 | 0.7617 | −3.28 | 2.089 | 79.53 | 0.73 | 1.591 | 0.498 |
| 46 | 0.0500 | 0.0380 | 0.7933 | −2.67 | 2.174 | 76.40 | 0.76 | 1.725 | 0.449 |
| 45 | 0.0583 | 0.0451 | 0.8290 | −2.04 | 2.259 | 73.54 | 0.79 | 1.873 | 0.386 |
| 44 | 0.0679 | 0.0534 | 0.8663 | −1.43 | 2.343 | 70.91 | 0.82 | 2.030 | 0.313 |
| 43 | 0.0792 | 0.0631 | 0.9006 | −0.86 | 2.425 | 68.49 | 0.85 | 2.184 | 0.241 |
![[thin space (1/6-em)]](https://www.rsc.org/images/entities/char_2009.gif) |
|||||||||
| For C16PC(2)/TX100(1) at y1 = 0.5001 | |||||||||
| 52 | 0.0108 | 0.6943 | 0.3057 | −6.17 | 2.219 | 74.85 | 0.90 | 1.541 | 0.679 |
| 51 | 0.0127 | 0.7090 | 0.2910 | −5.95 | 2.236 | 74.30 | 0.90 | 1.585 | 0.651 |
| 50 | 0.0146 | 0.7146 | 0.2854 | −5.49 | 2.250 | 73.83 | 0.91 | 1.608 | 0.642 |
| 49 | 0.0167 | 0.7245 | 0.2755 | −5.21 | 2.263 | 73.40 | 0.91 | 1.640 | 0.624 |
| 48 | 0.0191 | 0.7372 | 0.2628 | −4.87 | 2.277 | 72.96 | 0.92 | 1.678 | 0.598 |
| 47 | 0.0220 | 0.7536 | 0.2464 | −4.46 | 2.291 | 72.50 | 0.93 | 1.727 | 0.565 |
| 46 | 0.0256 | 0.7737 | 0.2263 | −3.98 | 2.307 | 72.02 | 0.94 | 1.785 | 0.522 |
| 45 | 0.0302 | 0.7970 | 0.2030 | −3.47 | 2.323 | 71.51 | 0.94 | 1.851 | 0.472 |
| 44 | 0.0358 | 0.8218 | 0.1782 | −2.94 | 2.340 | 70.98 | 0.95 | 1.923 | 0.417 |
| 43 | 0.0427 | 0.8463 | 0.1537 | −2.44 | 2.358 | 70.44 | 0.96 | 1.996 | 0.363 |
![[thin space (1/6-em)]](https://www.rsc.org/images/entities/char_2009.gif) |
|||||||||
| For C16PC(2)/TX100(1) at y1 = 0.5973 | |||||||||
| 52 | 0.0092 | 0.7057 | 0.2943 | −6.65 | 2.052 | 80.93 | 0.77 | 1.449 | 0.604 |
| 51 | 0.0131 | 0.7436 | 0.2564 | −5.29 | 2.199 | 75.55 | 0.83 | 1.635 | 0.564 |
| 50 | 0.0166 | 0.7748 | 0.2252 | −4.43 | 2.298 | 72.27 | 0.86 | 1.781 | 0.518 |
| 49 | 0.0199 | 0.8040 | 0.1960 | −3.76 | 2.375 | 69.94 | 0.89 | 1.910 | 0.465 |
| 48 | 0.0232 | 0.8351 | 0.1649 | −3.16 | 2.440 | 68.09 | 0.91 | 2.037 | 0.402 |
| 47 | 0.0267 | 0.8703 | 0.1297 | −2.52 | 2.500 | 66.50 | 0.94 | 2.174 | 0.324 |
| 46 | 0.0305 | 0.9108 | 0.0892 | −1.80 | 2.554 | 65.05 | 0.96 | 2.326 | 0.228 |
| 45 | 0.0348 | 0.9547 | 0.0453 | −0.84 | 2.609 | 63.67 | 0.98 | 2.491 | 0.118 |
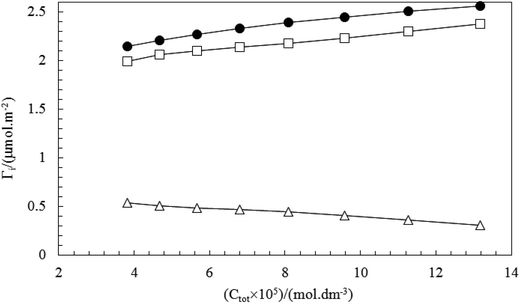
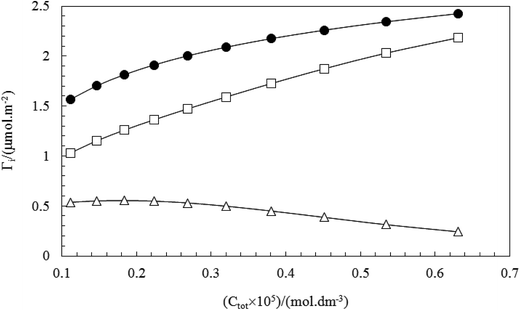
In order to determine the surfactant composition at the surface (Γ1, Γ2) were used eqn (5) and (6). Fig. 13 and 14 show plots of total adsorption (Γtot), the adsorbed amount of CnPC (ΓCnPC) and TX100 (ΓTX100) at the surface as a function of the total surfactant concentration (Ctot) in pre-micellar region, typically. The variation of adsorption (Γtot, Γ1 and Γ2) with composition follows distinctively same patterns at various mole fractions. Fig. 13 and 14 show that the adsorbed amount of TX100 (ΓTX-100) increases and the corresponding amount of CnPC (ΓCnPC) adsorbed at the surface decreases continuously as a function of the total surfactant concentration. This indicates that CnPC molecules (a surfactant with a larger polar head group) present at the original surface are continuously being displaced by TX100 molecules, due to the higher surface activity of TX100.
The values of Atot and surface coverage (=Atot/Amin) of mixture in the binary system at various surface tension can be calculated according to eqn (4) using the total surfactant adsorption (Γtot) (see Table 3).
As Table 3 show, the values of Atot for binary mixtures decrease with decreasing surface tension (or increasing the mole fraction of TX100 at the air–water interface (Xs1)).
In the high surface tension (at low concentration of non-ionic surfactant), the mean area occupied by each molecule at the interface (Atot) is very high due to the electrostatic self-repulsion between head groups of the cationic surfactants, and then with decreasing of surface tension the value of Atot decreases.
By considering that the surface tension value decreases with the increase of total concentration of surfactant, while the values of Atot decreases with increasing of Xs1. This can be attributed to the following reasons: (i) the decrease in self-repulsion of the cationic surfactants (or the population of C14PC or C14PC components at the interface decreases), (ii) the decrease in steric self-repulsion of the nonionic upon mixing, due to the dilution effect mentioned previously.
The alkyl chain length also plays an important role on Atot values. Short chain length of C14PC occupies smaller Atot than C16PC chains do at the interface, which is due to accompanied by higher population (see results in the same bulk mole fraction of cationic surfactant: y1 ≈ 0.199).
4. Conclusion
In this work, surface properties of binary mixtures of the two cationic surfactants (alkyl pyridinium chlorides: C14PC and C16PC) with the non-ionic surfactant Triton X-100 (TX100) have been studied at different total mole fractions in pre-micellar region. The interaction parameters (βs) and the mole fractions of the surfactants in the mixed monolayer (Xsi) were calculated using regular solution theory (Rosen theory) at various fixed values of surface tension.The values of Xs1 and Xs2 calculated by this model show higher contribution of TX100 (Xs1) in the mixed monolayers. Results showed that the hydrophobic chain length of the cationic surfactant and the initial total mole fraction in the mixed solutions affect their partitioning in the adsorbed mixed monolayers. The value of βs reflects the molecular interaction parameter for mixed monolayers.
Negative values of βs parameter were obtained for both C14PC–TX100 and C16PC–TX100 mixed monolayers, this indicates that synergism take place in the mixing process. Dilution effect upon mixing and a large number of attractive Van der Waals interactions between neighboring hydrophobic parts for CnPC/TX100 mixtures is proposed as a major factor to the negative βs values observed for mixed monolayers. Also, the interaction in the mixed monolayer at the air–water interface (the βs values become more negatives) is increased with increasing in the hydrophobic group in ionic surfactant of the mixture. Moreover, it can be seen that the values of Atot and surface coverage will decrease with decreasing surface tension and increasing the mole fraction of non-ionic surfactant at the air–water interface (Xs1). Finally, these studies show that the surface parameters (βs, Xsi and etc.) are very dependent on the values of the selected fixed surface tension (in the curves of pure and surfactant mixtures) for the calculation of C1, C2 and C12 at pre-micellar region. This effect has not been previously reported in many papers related to mixed surfactants studies.
Acknowledgements
We gratefully acknowledge the financial support received for this research work from the Research Council of Semnan University.References
- R. Sharma and R. Kumar Mahajan, RSC Adv., 2012, 2, 9571–9583 RSC.
- N. Ranjan Biswal and S. Paria, RSC Adv., 2014, 4, 9182–9188 RSC.
- W. V. Rybinski and M. J. Schwuger, Langmuir, 1986, 2, 639–643 CrossRef.
- P. Posocco, A. Perazzo, V. Preziosi, E. Laurini, S. Pricl and S. Guido, RSC Adv., 2016, 6, 4723–4729 RSC.
- A. Bera, K. Ojha and A. Mandal, J. Surfactants Deterg., 2013, 16, 621–630 CrossRef CAS.
- M. J. Rosen, Molecular interaction and synergism in binary mixtures of surfactants, ACS symposium series 311, American Chemical Society, Washington, DC, 1986 Search PubMed.
- P. M. Holland and D. N. Rubingh, Mixed surfactants systems, ACS symposium series 50, American Chemical Society, Washington DC, 1992, ch. 1 Search PubMed.
- D. E. Mohammad, N. A. Negm and M. R. Mishrif, J. Surfactants Deterg., 2013, 16, 723–731 CrossRef.
- M. S. Sheikh and K. ud-Din, Colloids Surf., A, 2011, 378, 60–66 CrossRef CAS.
- H. Gharibi, B. M. Razavizadeh and M. Hashemianzaheh, Colloids Surf., A, 2000, 174, 375–386 CrossRef CAS.
- B. M. Razavizadeh, M. Mousavi-Khoshdel, H. Gharibi, R. Behjatmanesh-Ardakani, S. Javadian and B. Sohrabi, J. Colloid Interface Sci., 2004, 276, 197–207 CrossRef CAS PubMed.
- B. Sohrabi, H. Gharibi, B. Tajik, S. Javadian and M. Hashemianzadeh, J. Phys. Chem. B, 2008, 112, 14869–14876 CrossRef CAS PubMed.
- M. J. Rosen and Q. Zhou, Langmuir, 2001, 17, 3532–3537 CrossRef CAS.
- Q. Zhou and M. J. Rosen, Langmuir, 2003, 19, 4555–4562 CrossRef CAS.
- K. L. Mittal, Solution chemistry of surfactants, Plenum Press, New York, 1979, vol. 1 Search PubMed.
- M. J. Rosen and X. Y. Hua, J. Colloid Interface Sci., 1982, 86, 164–172 CrossRef CAS.
- X. Y. Hua and M. J. Rosen, J. Colloid Interface Sci., 1982, 90, 212–219 CrossRef CAS.
- M. Shafi Sheikh, K. ud-Din and A. Ahmad Dar, Colloids Surf., A, 2011, 378, 60–66 CrossRef.
- K. ud-Din, G. Sharma and A. Z. Naqvi, Colloids Surf., A, 2011, 385, 63–71 CrossRef.
- N. Azum, M. Abdul Rub and A. M. Asiri, Colloids Surf., B, 2014, 121, 158–164 CrossRef CAS PubMed.
- A. Trawinska, E. Hallmann and K. Medrzycka, Colloids Surf., A, 2016, 488, 162–172 CrossRef CAS.
- N. A. Negm, M. R. Mishrif and D. E. Mohamed, Colloids Surf., A, 2015, 480, 122–129 CrossRef CAS.
- K. ud-Din, M. S. Sheikh and A. A. Dar, J. Phys. Chem. B, 2010, 114, 6023–6032 CrossRef PubMed.
- A. Bagheri and A. Abolhasani, Korean J. Chem. Eng., 2015, 32, 308–315 CrossRef CAS.
- P. M. Holland and D. N. Rubingh, J. Phys. Chem., 1983, 87, 1984–1990 CrossRef CAS.
- M. J. Rosen and J. T. Kunjappu, Surfactants and Interfacial Phenomena, John Wiley & Sons Press, New Jersey, 4th edn, 2012, ch. 2 Search PubMed.
- S. R. Patil, N. Buchavzov, E. Carey and C. Stubenrauch, Soft Matter, 2008, 4, 840–848 RSC.
| This journal is © The Royal Society of Chemistry 2017 |

