 Open Access Article
Synthesis of g-C3N4 nanosheet modified SnO2 composites with improved performance for ethanol gas sensing
Jianliang Cao a,
Cong Qina,
Yan Wang
 *b,
Huoli Zhanga,
Bo Zhangc,
Yuxiao Gonga,
Xiaodong Wangc,
Guang Sunc,
Hari Balac and
Zhanying Zhang*c
aCollege of Chemistry and Chemical Engineering, Henan Polytechnic University, Jiaozuo 454000, PR China
bSchool of Safety Science and Engineering, State Key Laboratory Cultivation Base for Gas Geology and Gas Control, Henan Polytechnic University, Jiaozuo 454000, PR China. E-mail: yanwang@hpu.edu.cn; Fax: +86 391 3987440; Tel: +86 391 3987440
cSchool of Materials Science and Engineering, Henan Polytechnic University, Jiaozuo 454000, PR China. E-mail: zhangzy@hpu.edu.cn
First published on 12th May 2017
Abstract
The composites of SnO2 have attracted much interest in the last few years due to their excellent sensing properties. A series of composites were prepared with two-dimensional (2D) g-C3N4 nanosheet modified SnO2 by a simple hydrothermal method in this work. The as-prepared composites were characterized by the techniques of powder X-ray diffraction (XRD), thermogravimetric analysis (TG), scanning electron microscopy (SEM), transmission electron microscopy (TEM), energy dispersive X-ray spectroscopy (EDS), N2 sorption and X-ray photoelectron spectroscopy (XPS). The gas sensing measurement results indicated that the sensor based on g-C3N4/SnO2 composite showed high sensitivity and excellent selectivity for detection of ethanol vapor. At 500 ppm of ethanol vapor, the response value (Ra/Rg) of 5 wt% 2D g-C3N4 modified SnO2 was 240 at 300 °C. Therefore, the g-C3N4/SnO2 composites have a great potential ethanol gas sensing application.
1. Introduction
Gas sensors have wide applications in many fields, such as environmental protection, toxic gas detection, emission monitoring, chemical process control and so on.1–8 For ethanol sensors, many metal-oxides have been investigated as semiconductor gas sensors in recent years, such as hollow ZnO microspheres,9 lance-shaped CuO nanostructures,10 Au-functional NiO nanoparticles,11 Mn-doped Co3O4,12 α-Fe2O3@graphene nanostructures,13 WO3 nanofibers,14 CdO and MnO2 thin films,15 and noble metal decorated SnO2.16 Moreover, for gas sensing materials, the composites of SnO2 exhibit excellent sensing properties such as high response, low-cost, fast response and recovery, which have attracted much interest in the past few years.17–24However, among these sensors, the poor electrical characteristics prevent their direct applications. g-C3N4 is an organic and nontoxic semiconductor, which has attracted much attention, exhibiting excellent photoactivity, photocatalysis and electron transport.25,26 For example, She et al.27 have reported that the CeO2 nanoparticles were dispersed on the surface of the g-C3N4 and the CeO2/g-C3N4 composites showed high photocatalytic activity and stability in the environment applications. Furthermore, Zhang et al.28 investigated the MnO2/g-C3N4 sandwich nanocomposite which showed satisfying performance on turn-on fluorescence response. Recently, Zeng et al.29 prepared the α-Fe2O3/g-C3N4 composites which displayed distinguished cataluminescence properties in the process of detecting H2S gas. These reports indicate that g-C3N4 had the ability to improve electrical characteristics of metal oxides.
In this work, the 2D g-C3N4 nanosheets (2D g-C3N4) were synthesized according to the previous literature report.30 The 2D g-C3N4 modified SnO2 composites were prepared with 2D g-C3N4, SnCl4·5H2O and NH3·H2O as the precursor materials by the hydrothermal method. The as-prepared samples were characterized by XRD, TG, SEM, TEM, N2 sorption and XPS. The sensing properties of the g-C3N4/SnO2 composites to ethanol gas were investigated in detail. The results showed that the 2D g-C3N4 can effectively improved sensing properties of SnO2 to ethanol gas. The composite of 5 wt% 2D g-C3N4 modified SnO2 has the optimum performance for detection of ethanol vapor.
2. Experimental
2.1 Chemicals
Urea, tin(IV) chloride pentahydrate (SnCl4·5H2O) and ammonia water (NH3·H2O) were purchased from Sinopharm Chemical Reagent Co., Ltd. All reagents were of analytical grade without further purification.2.2 Preparation of g-C3N4/SnO2 composites
Graphitic carbon nitride (g-C3N4) was synthesized by the pyrolysis of urea in the muffle furnace, 20 g urea was put into an alumina crucible with a cover, then heated to 250 °C within 110 min and kept at 250 °C for 1 h. The further treatment was performed at 350 and 550 °C for 2 h, respectively. The heating rate of the whole reaction was 2 °C min−1. The yellow powder (g-C3N4) was collected. Typically, 5 wt% 2D g-C3N4 modified SnO2 (g-C3N4-5P/SnO2) was prepared with the following method. 0.1 g of 2D g-C3N4 was dispersed in 130 mL DI water with ultrasonic treatment for 4 h, and 4.65 g SnCl4·5H2O was added into 144 mL ethanol. Then, the SnCl4·5H2O ethanol solution was slowly added into the g-C3N4 solution with magnetic stirring. Subsequently, 14 mL NH3·H2O was injected into the mixture solution. Finally, the mixture was transferred into a 500 mL Teflon-lined steel autoclave and the sealed tank was put into an oven and heated at 150 °C for 24 h. The resulting product was separated by centrifuging and washed several times with DI water and ethanol. Then, the product was dried at 60 °C for 12 h to obtain the composite. According to this method, the g-C3N4/SnO2 composites with 2.5 wt% and 7.5 wt% g-C3N4 modified SnO2 were also prepared and marked as g-C3N4-2.5P/SnO2 and g-C3N4-7.5P/SnO2. For the comparison purpose, the pure SnO2 particles were prepared without adding 2D g-C3N4.2.3 Characterization
X-ray diffraction (XRD) analysis was performed on a Bruker-AXS D8 Advance diffractometer, with CuKα radiation at 40 kV and 25 mA in a scanning range of 10–80° (2θ). Thermogravimetry analysis (TG) was done on a NETZSCH STA449C Simultaneous Thermal Analyzer. Scanning electron microscope (SEM) images were performed on a FEI Quanta 250 FEG scanning electron microscope with an accelerating voltage of 30 kV. Transmission electron microscopy (TEM) analysis was performed on a JEOL JEM-2100 microscope, operating at 200 kV. The samples were dispersed in ethanol and treated with ultrasound for 5 min, and then deposited on a copper grid coated with preformed holey carbon film. N2 adsorption–desorption isotherms were collected at liquid nitrogen temperature using a Quantachrome Autosorb-iQ sorption analyzer, and the sample was degassed at 150 °C for more than 6 h. The specific surface areas (SBET) of the samples were calculated following the multi-point BET (Brunauer–Emmett–Teller) procedure. The pore size distributions were determined from the adsorption branch of the isotherms using the DFT method. X-ray photoelectron spectroscopy (XPS) measurements were carried out on a Perkin-Elmer PHI 5600 spectrophotometer with the MgKα radiation, and the C 1s peak was fixed at a binding energy of 284.6 eV.2.4 Fabrication and analysis of gas sensor
The gas-sensing properties were investigated by using an intelligent gas sensing analysis system of CGS-4TPS from Beijing Elite Tech Co., Ltd. The as-prepared sample was mixed with several drops of distilled water to form a paste. The paste was then coated onto a ceramic substrate (13.4 mm × 7 mm, screen-printed with Ag–Pd comb-like electrodes) to obtain the resistance-type sensor. The schematic diagram of the typical gas sensor and the measuring principle were shown in Fig. 1. The test gases were injected into the closed chamber (with a volume of 0.018 m3) by a microinjector. In order to improve the stability and repeatability, the sensor was aged at 200 °C for 12 h. During the test, the operating temperature range was set at 200–380 °C, and the relative humidity was 40% in the test chamber. The gas response (S) was defined as the ratio of Ra/Rg, where Ra and Rg were the resistances of sensor measured in air and in test gas, respectively. The response and recovery times were defined as the time required for a change in response reach 90% of the equilibrium value after injecting and removing the test gas. | ||
| Fig. 1 (a) The appearance of the CGS-4TPS gas sensing test system, (b) the internal structure diagram of the test system, and (c) the structure diagram of the gas sensor substrate. | ||
3. Results and discussion
3.1 Characterization of 2D g-C3N4, SnO2 and g-C3N4/SnO2 composites
XRD patterns of the as-prepared samples are displayed in Fig. 2. As can be seen from Fig. 2(a), two diffraction peaks at 13.1° and 27.5° can be observed, which were accorded to the (100) and (002) plane of g-C3N4. These two peaks could be due to the inter-layer structure of tri-s-triazine unit with interplanar spacing and the conjugated aromatic system, respectively,29 which indicated that g-C3N4 was prepared successfully. Fig. 2(c–e) shows the XRD patterns of g-C3N4/SnO2 composites with different content of g-C3N4. It can be observed obviously that some diffraction peaks are seen at 2 theta of 26.61°, 33.89°, 37.94°, 51.78°, 65.93°, which are assigned to the (110), (101), (200), (211) and (301) planes of the tetragonal rutile structure SnO2 (JCPDS card no. 41-1445), respectively. However, compared with the XRD pattern of pure SnO2 in Fig. 2(b), no diffraction peaks of g-C3N4 can be observed in the patterns of g-C3N4/SnO2 composites. The main reason is the relatively low g-C3N4 content. Meanwhile, the diffraction peak of g-C3N4 at 27.5° could probably be overlapped with the strong diffraction peak of SnO2 at 26.6°.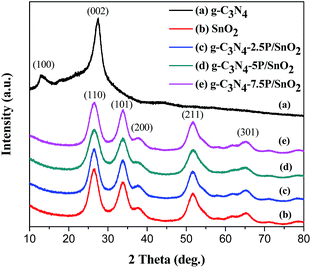 | ||
| Fig. 2 XRD patterns of (a) 2D g-C3N4, (b) SnO2, (c) g-C3N4-2.5P/SnO2, (d) g-C3N4-5P/SnO2 and (e) g-C3N4-7.5P/SnO2. | ||
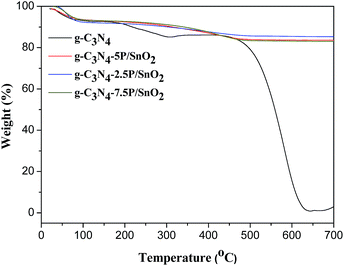
TG analysis was carried out from 20 to 700 °C with a heating rate of 10 °C min−1 under air atmosphere to reveal the thermal stability of g-C3N4, g-C3N4-2.5P/SnO2, g-C3N4-5P/SnO2 and g-C3N4-7.5P/SnO2 at different temperatures. As is shown in Fig. 3, in the range of 50–150 °C of the curves, moisture and impurities were lost a little part weight. The second agravity peak is between 150 and 350 °C, which is due to the desorption of solvent. With increase of the temperature, a fast weight loss attributed to the decomposition of g-C3N4 was observed in the range of 450–620 °C. As shown in the profile of g-C3N4-5P/SnO2, the remanent content of the composite is 83% after the decomposition of g-C3N4. It is demonstrated that g-C3N4 has good thermal stability and can be used to modify the sensing materials when the operating temperature is below 400 °C and the g-C3N4 is not decomposed in the process of the gas sensing tests.
As is shown in Fig. 4(a), the morphologies of the as-prepared g-C3N4 possess many wrinkles with overlap at the edges, which demonstrates that it possesses the two dimensional (2D) nano-lamellar structure. From Fig. 4(b), we can find many irregular SnO2 particles with different sizes. The result in Fig. 4(c) indicates that some SnO2 particles are dispersed on the surface of 2D g-C3N4 nanosheets. It shows that it is a suitable route to synthesize g-C3N4/SnO2 composites using the hydrothermal treatment. Fig. 5(a) shows a typical EDS spectrum of g-C3N4-5P/SnO2 composite. It is noted that four elements of Sn, O, C and N are synchronous existent in the same area observed in Fig. 5(b–f). The percentage composition of the four elements of C, N, Sn and O are 5.25 wt%, 8.87 wt%, 56.0 wt% and 29.9 wt%, respectively. The EDS mapping of C, N, O and Sn elements corresponding to Fig. 5(b) are displayed in Fig. 5(c), (d), (e) and (f), respectively. According to Fig. 5, the structural feature of g-C3N4-5P/SnO2 composite is that 2D g-C3N4 and SnO2 particles are combined together effectively.
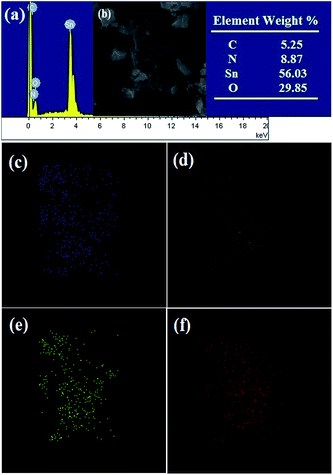 | ||
| Fig. 5 (a) EDS spectra of the g-C3N4-5P/SnO2 composite, (b) SEM image and elements content for selected EDS area, and EDS mappings of C (c), N (d), O (e), Sn (f) element related to (b). | ||
Furthermore, the 2D g-C3N4 and g-C3N4-5P/SnO2 composite were characterized by TEM. As shown in Fig. 6(a), the pure g-C3N4 is two dimensional nanosheets with many wrinkles. Fig. 6(b) displays that the SnO2 nanoparticles are highly distributed on the surface of the 2D g-C3N4. Fig. 6(c) shows the HRTEM image of g-C3N4-5P/SnO2 composite, it can be seen that the SnO2 nanoparticles with diameters of 3–5 nm.
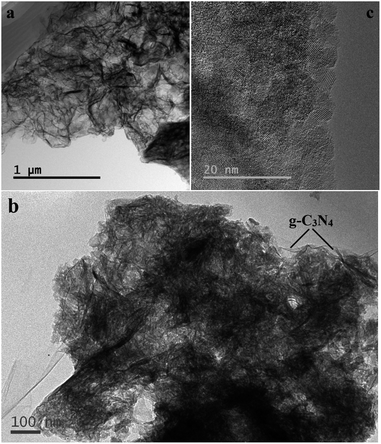 | ||
| Fig. 6 TEM images of (a) 2D g-C3N4, (b) g-C3N4-5P/SnO2 composite, and (c) HRTEM image of the g-C3N4-5P/SnO2 composite. | ||
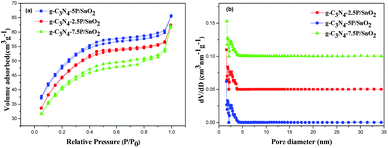
The porosity of the g-C3N4-2.5P/SnO2, g-C3N4-5P/SnO2 and g-C3N4-7.5P/SnO2 composites were verified by N2-sorption analysis. Fig. 7 depicts N2 adsorption–desorption isotherm and the corresponding pore size distribution of the composites. The isotherms (Fig. 7(a)) of the samples are of classical type IV, which possess the characteristic of mesoporous materials according to the IUPAC. The hysteresis loop in the range of 0.4–1.0 (P/P0) belong to the H3-type, which indicates the presence of mesoporous structure in the composites.30 The pore size distribution curves of the g-C3N4-2.5P/SnO2, g-C3N4-5P/SnO2 and g-C3N4-7.5P/SnO2 composites are shown in Fig. 7(b). The curves depict that the samples have relatively small pores with a size distribution of 1–5 nm and the pores are concentrated upon 2.6 nm according to the DFT method. The specific surface area of g-C3N4-2.5P/SnO2, g-C3N4-5P/SnO2 and g-C3N4-7.5P/SnO2 composites are 117.6 m2 g−1, 160.2 m2 g−1 and 134.8 m2 g−1, respectively. The highest surface area of g-C3N4-5P/SnO2 may make it possesses better gas sensing performance.
In order to investigate the heterojunction of the g-C3N4/SnO2 composite, the XPS technique was carried out to obtain the interactions between SnO2 and g-C3N4 (Fig. 8). Fig. 8(a) displays the survey scan spectra of g-C3N4, SnO2 and g-C3N4-5P/SnO2 composite. It is observed that Sn, O, C and N elements exist in the g-C3N4-5P/SnO2 composite and Sn, O and C exist in SnO2. The C 1s peak from SnO2 is due to the adventitious carbon. The XPS spectra of the g-C3N4 sample shows only C and N elements. As shown in Fig. 8(b), two signal peaks of Sn 3d in pure SnO2 at binding energies of 486.78 eV and 495.18 eV are corresponding to Sn 3d3/2 and Sn 3d5/2, respectively. However, these two signal peaks of Sn 3d in g-C3N4-5P/SnO2 had a shift. The peak positions are changed to 486.58 eV of Sn 3d3/2 and 494.98 eV of Sn 3d5/2, respectively. This phenomenon can be attributed to the interactions between g-C3N4 and Sn, and the heterojunction of interface region between g-C3N4 and SnO2. For high resolution XPS spectra, as is shown in Fig. 8(c), there are few distinction of O 1s between SnO2 and g-C3N4-5P/SnO2. Fig. 8(d) displays the high resolution XPS spectra of C 1s. Three peaks for C 1s binding energies exist at 284.6 eV, 285.89 eV and 288.2 eV, respectively. As is well known, the signal at 284.6 eV corresponds to sp2 C–C bonds, while the signal at 285.89 eV is identical to the combination of C–N groups. And the signal at 288.2 eV comes from the sp2 C atoms from the aromatic rings N–C![[double bond, length as m-dash]](https://www.rsc.org/images/entities/char_e001.gif) N. It can be seen from Fig. 8(e) that there are three signals with binding energies at 398.75, 399.8 and 400.8 eV, respectively. The peak at 398.75 eV is ascribed to sp2-hybridized aromatic N bound to C atoms, the peak at 399.8 eV comes from the tertiary N bonded to C atoms in the form of N–(C)3. And the peak at 400.8 eV is related to the N–H structure.
N. It can be seen from Fig. 8(e) that there are three signals with binding energies at 398.75, 399.8 and 400.8 eV, respectively. The peak at 398.75 eV is ascribed to sp2-hybridized aromatic N bound to C atoms, the peak at 399.8 eV comes from the tertiary N bonded to C atoms in the form of N–(C)3. And the peak at 400.8 eV is related to the N–H structure.
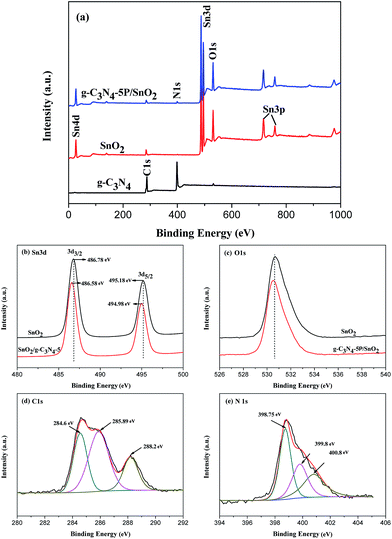 | ||
| Fig. 8 XPS survey of g-C3N4, SnO2 and g-C3N4-5P/SnO2 samples: (a) the general scan spectrum, (b) Sn 3d spectrum, (c) O 1s spectrum, (d) C 1s spectrum, and (e) N 1s spectrum. | ||
3.2 Gas-sensing properties
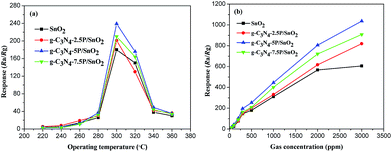
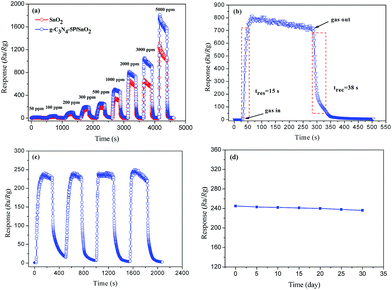
A series of gas-sensing tests were performed to investigate the properties of the g-C3N4/SnO2 composites based sensors to ethanol vapor. For comparison, the pure SnO2 based sensor was also tested. The operating temperature can strongly affect the chemical reaction happened on the surface of sensing materials. Herein, the response values (Ra/Rg) of the g-C3N4/SnO2 composite and the pure SnO2 based sensors to 500 ppm ethanol vapor were measured at different operating temperature. As can be seen from Fig. 9(a), all the sensors exhibited the similar variation tendency with the increase of operating temperature. And all the sensors reached the maximum response value at 300 °C due to the chemisorbed oxygen species achieving the required energy to react with ethanol vapor molecules. And the reaction effectively happened on metal oxides semiconductor surface varying the resistance significantly.31 It can also be seen that the response values of the g-C3N4/SnO2 composite based sensors are much higher than that of the pure SnO2 based sensor. The response value of the composites increased with adding g-C3N4 content from 2.5 to 5 wt%. However, the response value decreased with the further increased g-C3N4 content. The response values of the pure SnO2, g-C3N4-2.5P/SnO2, g-C3N4-5P/SnO2 and g-C3N4-7.5P/SnO2 to 500 ppm ethanol are 180, 201, 240, and 210, respectively. A suitable content of g-C3N4 in the composite is beneficial to the dispersity and preferable heterojunctional structure, which can be formed in the interface region between 2D g-C3N4 and SnO2. However, when the g-C3N4 content in the composites exceed a value (e.g. 5 wt% in this work), it may form the connection of bulk. As a result, the specific surface area of the composite decrease and there are reduced active sites for adsorption oxygen and ethanol gas, leading to the degradation of gas sensing properties. Consequently, the gas sensor performance increases at first and decreases when the g-C3N4 content in the composites increases.32 The high content of 2D g-C3N4 may lead to the connection of the g-C3N4 nanosheets, which could form the micro electric bridges on the surface. The micro electric bridges may result in the semiconductor's resistance reduced. Therefore, the response value of the g-C3N4-7.5P/SnO2 composite sensor to ethanol vapor decreased. Thus, the optimum operating temperature is at 300 °C and the optimum g-C3N4 content is 5 wt% 2D g-C3N4 modified SnO2 composite. Therefore, all of the further tests were carried on using the g-C3N4-5P/SnO2 composite sensor at 300 °C. Fig. 9(b) shows the response values of all the sensors at different concentrations of ethanol at 300 °C. It can be seen that the response values increased promptly with the increasing of ethanol concentration in the range of 50–2000 ppm. However, the response values increased slowly when the ethanol concentration is in the range of 2000–3000 ppm. It can be concluded that the adsorption of these sensors to ethanol has reached approximately saturation. The response values of these sensors to ethanol at 300 °C from high to low are g-C3N4-5P/SnO2, g-C3N4-7.5P/SnO2, g-C3N4-2.5P/SnO2 and SnO2, respectively.Fig. 10(a) displays the continuous response–recover curves of the pure SnO2 and g-C3N4-5P/SnO2 composite based sensors to different ethanol concentrations at 300 °C. Each response–recovery cycle was taken up about 500 s with a response interval of 250 s and a recovery interval of 250 s. It can be seen that the response values of the both sensors increased with the increase of ethanol concentration in the range of 50–5000 ppm. As seen in Fig. 10(a), the g-C3N4-5P/SnO2 composite sensor exhibited much higher response value than that of pure SnO2 sensor to ethanol vapor in the range of 50–5000 ppm. The response value of the g-C3N4-5P/SnO2 composite sensor to 5000 ppm ethanol reached about 1900, which is nearly two times higher than that of the pure SnO2 sensor. Response–recovery time is one of the most critical influential factor on the response of gas sensor. Fig. 10(b) shows the response–recovery time of the g-C3N4-5P/SnO2 composite sensor to 2000 ppm ethanol at 300 °C. As seen in Fig. 10(b), the response promptly reached the maximum value when the g-C3N4-5P/SnO2 composite sensor was exposed to ethanol vapor. And the response time and the recovery time are 15 s and 38 s, respectively.
The repeatability of sensing material plays an important role in the practical application of gas sensor. The repeatability of the g-C3N4-5P/SnO2 composite based sensor to 500 ppm ethanol vapor was performed at 300 °C. Fig. 10(c) shows the response–recovery cycle curves. And the response values of the tests are 239, 241, 240 and 245, respectively. The g-C3N4-5P/SnO2 composite sensor shows an excellent repeatable performance for ethanol gas sensing. Moreover, the stability of the g-C3N4-5P/SnO2 composite based sensor was also investigated and a long-term response value was measured. Fig. 10(d) shows the response value of the g-C3N4-5P/SnO2 composite based sensor was exposed to 500 ppm ethanol for 30 days. The response value was measured every 5 days and the response value was nearly kept at 240. It indicated that the g-C3N4-5P/SnO2 composite sensor had a good stability, which could be one of the potential candidates for ethanol gas sensor. Selectivity is another pivotal criterion of gas sensor.
The selectivity of the pure SnO2 and g-C3N4-5P/SnO2 composite sensors to five different 500 ppm gases at 300 °C was investigated. The five different gases are respectively ethanol, methanol, formaldehyde, acetone and toluene. The response values were measured and the results are shown in Fig. 11. It is observed that the g-C3N4-5P/SnO2 composite sensor has a better selectivity to ethanol than the pure SnO2 sensor in the five different gases at 300 °C.
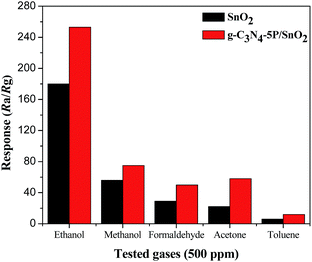 | ||
| Fig. 11 Comparison of the response values of the pure SnO2 and the g-C3N4-5P/SnO2 composite sensors to 500 ppm different gases at 300 °C. | ||
The performances of different sensing materials are listed in Table 1. As can be seen from Table 1, according to the literature, the response values of SnO2@MoS2,22 ZnO/graphene,8 In-doped SnO2,23 SnO2/graphene24 were 160, 280, 80, 38.58, respectively. In this work, the response value of 5 wt% 2D g-C3N4 modified SnO2 to 500 ppm of ethanol vapor was 240 at 300 °C. Therefore, the g-C3N4/SnO2 composites show the excellent sensing properties to ethanol vapor, which have a great potential application.
3.3 Gas sensing mechanism of the g-C3N4/SnO2 composites
In general, for the g-C3N4/SnO2 composites, the incorporation of 2D g-C3N4 plays an important role on preventing the aggregation of SnO2 particles and forms a large surface area structure, which is beneficial to the adsorption and diffusion process of ethanol molecules. And the 2D g-C3N4 nanosheets can provide more active sites to adsorb O2 molecules and ethanol gas molecules. The improved gas sensing performance of the g-C3N4/SnO2 composite sensor to ethanol could be mainly attributed to the heterojunction of interface region between g-C3N4 and SnO2 and the interactions between Sn and g-C3N4. According to the XPS result, the shift of Sn 3d signal peaks illustrates that there are the interactions between Sn and g-C3N4. The electrical properties at the heterojunctions changes while ethanol gas molecules pass through the interface region between g-C3N4 and SnO2. This coadjacent retiform structure could provide higher efficiency for the gas adsorption and diffusion between SnO2 and g-C3N4. Both of SnO2 and g-C3N4 are n-type semiconductor. The band gap are 3.71 eV and 2.7 eV, respectively. The conduction band level of g-C3N4 is negative than SnO2. When SnO2 and g-C3N4 were combined, they formed a heterojunction structure. The electrons will inflow from the conduction band of g-C3N4 to the conduction band of SnO2, leading to a higher potential barrier. As a result, the electrons and holes are separated.33 Meanwhile, the heterojunction structure may suppress the recombination of electron–hole and urge electrons to transfer quickly from ethanol vapour to the surface of SnO2/g-C3N4. Therefore, this lead to a higher response because of the increased conductivity of the heterojunction structure.32 In addition, surface adsorbed oxygen theory is also used to explain gas sensing mechanism. Oxygen molecules would adsorb on surface of SnO2 and capture electrons from the conduction band of SnO2 when the sensor was exposed in air (eqn (1)). Then oxygen molecules were ionized to O2−, O− and O2−, and the formation of depletion layers led to the increase of resistance of the composite sensor. Nevertheless, when the sensor was exposed into the ethanol gas, the ethanol molecules would react with oxygen ions absorbed on the surface of the sensor. As displayed in eqn (2) and (3), the ethanol molecules were oxidized into acetaldehyde and eventually turned into carbon dioxide and water. As a result, the trapped electrons released back to the depletion layer of the sensing film, resulting in the decrease of the resistance of the composite sensor.| O2 + e− → O2− | (1) |
| 2CH3CH2OH + O2− → 2CH3CHO + 2H2O + e− | (2) |
| 2CH3CHO + 5O2− → 4CO2 + 4H2O + 5e− | (3) |
4. Conclusions
In summary, the g-C3N4/SnO2 composites were prepared by a facile method through hydrothermal treatment. And it was found that the sensor based on g-C3N4/SnO2 composite showed high sensitivity and excellent selectivity for detection of ethanol vapor. At 500 ppm of ethanol vapor, the response value (Ra/Rg) of 5 wt% 2D g-C3N4 modified SnO2 was 240 at 300 °C. The improved sensing properties of the g-C3N4/SnO2 composites are mainly attributed to the large specific surface and the modified electronic characteristics. Considering its facile effective synthesis approach, the g-C3N4/SnO2 composite will be an ideal candidate for ethanol gas sensor application, optic devices and photocatalysis.Acknowledgements
This work was supported by the National Natural Science Foundation of China (51404097, 51504083, U1404613), Program for Science & Technology Innovation Talents in Universities of Henan Province (17HASTIT029), the Research Foundation for Youth Scholars of Higher Education of Henan Province (2016GGJS-040), Natural Science Foundation of Henan Province of China (162300410113), China Postdoctoral Science Foundation funded project (2016M592290), the Fundamental Research Funds for the Universities of Henan Province (NSFRF1606, NSFRF140101), Program for innovative Research of Henan Province (16IRTSTHN005), and Foundation for Distinguished Young Scientists of Henan Polytechnic University (J2016-2, J2017-3).Notes and references
- D. Zhang, J. Liu, H. Chang, A. Liu and B. Xia, Characterization of a hybrid composite of SnO2 nanocrystal-decorated reduced graphene oxide for ppm-level ethanol gas sensing application, RSC Adv., 2015, 5, 18666–18672 RSC.
- O. Korostynska, A. Mason, M. Ortoneda-Pedrolam and A. Al-Shamma'a, Electromagnetic wave sensing of NO3 and COD concentrations for real-time environmental and industrial monitoring, Sens. Actuators, B, 2014, 198, 49–54 CrossRef CAS.
- D. Zhang, J. Tong, B. Xia and Q. Xue, Ultrahigh performance humidity sensor based on layer-by-layer self-assembly of graphene oxide/polyelectrolyte nanocomposite film, Sens. Actuators, B, 2014, 203, 263–270 CrossRef CAS.
- S. T. Navale, A. T. Mane, M. A. Chougule, N. M. Shinde, J. Kim and V. B. Patil, Highly selective and sensitive CdS thin film sensors for detection of NO2 gas, RSC Adv., 2014, 4, 44547–44554 RSC.
- H. Zhang, J. Feng, T. Fei, S. Liu and T. Zhang, SnO2 nanoparticles-reduced graphene oxide nanocomposites for NO2 sensing at low operating temperature, Sens. Actuators, B, 2014, 190, 472–478 CrossRef CAS.
- N. Karmakar, R. Fernandes, S. Jain, U. V. Patil, N. G. Shimpi, N. V. Bhat and D. C. Kothari, Room temperature NO2 gas sensing properties of p-toluenesulfonic acid doped silver-polypyrrole nanocomposite, Sens. Actuators, B, 2017, 242, 118–126 CrossRef CAS.
- F. Perrozzi, S. M. Emamjomeh, V. Paolucci, G. Taglieri, L. Ottaviano and C. Cantalini, Thermal stability of WS2 flakes and gas sensing properties of WS2/WO3 composite to H2, NH3 and NO2, Sens. Actuators, B, 2017, 243, 812–822 CrossRef CAS.
- S. Liang, J. Zhu, J. Ding, H. Bi, P. Yao, Q. Han and X. Wang, Deposition of cocoon-like ZnO on graphene sheets for improving gas-sensing properties to ethanol, Appl. Surf. Sci., 2015, 357, 1593–1600 CrossRef CAS.
- Y. Chen, X. Li, X. Li, J. Wang and Z. Tang, UV activated hollow ZnO microspheres for selective ethanol sensors at low temperatures, Sens. Actuators, B, 2016, 232, 158–164 CrossRef CAS.
- A. Umar, J.-H. Lee, R. Kumar, O. Al-Dossary, A. A. Ibrahim and S. Baskoutas, Development of highly sensitive and selective ethanol sensor based on lance-shaped CuO nanostructures, Mater. Des., 2016, 105, 16–24 CrossRef CAS.
- S. Park, H. Kheel, G.-J. Sun, S. K. Hyun, S. E. Park and C. Lee, Ethanol sensing properties of Au-functional NiO nanoparticles, Bull. Korean Chem. Soc., 2016, 37, 713–719 CrossRef CAS.
- C. Stella, N. Soundararajan and K. Ramachandran, Undoped and Mn-doped Co3O4 nanorods for ethanol sensing, J. Mater. Sci.: Mater. Electron., 2015, 26, 4178–4184 CrossRef CAS.
- S. Liang, J. Zhu, C. Wang, S. Yu, H. Bi, X. Liu and X. Wang, Fabrication of α-Fe2O3@graphene nanostructures for enhanced gas-sensing property to ethanol, Appl. Surf. Sci., 2014, 292, 278–284 CrossRef CAS.
- S. Cao, C. Zhao, T. Han and L. Peng, Hydrothermal synthesis, characterization and gas sensing properties of the WO3 nanofibers, Mater. Lett., 2016, 169, 17–20 CrossRef CAS.
- R. Chandiramouli and B. G. Jeyaprakash, Operating temperature dependent ethanol and formaldehyde detection of spray deposited mixed CdO and MnO2 thin films, RSC Adv., 2015, 5, 43930–43940 RSC.
- Y. V. Kaneti, J. Yue, J. Moriceau, C. Chen, M. Liu, Y. Yuan, X. Jiang and A. Yu, Experimental and theoretical studies on noble metal decorated tin oxide flower-like nanorods with high ethanol sensing performance, Sens. Actuators, B, 2015, 219, 83–93 CrossRef CAS.
- V. Srivastava and K. Jain, At room temperature graphene/SnO2 is better than MWCNT/SnO2 as NO2 gas sensor, Mater. Lett., 2015, 169, 28–32 CrossRef.
- Z. Song, Z. Wei, B. Wang, Z. Luo, S. Xu, W. Zhang, H. Yu, M. Li, Z. Huang, J. Zang, F. Yi and H. Liu, Sensitive Room-Temperature H2S Gas Sensors Employing SnO2 Quantum Wire/Reduced Graphene Oxide Nanocomposites, Chem. Mater., 2016, 28, 1205–1212 CrossRef CAS.
- S. Mao, S. Cui, G. Lu, K. Yu, Z. Wen and J. Chen, Tuning gas-sensing properties of reduced graphene oxide using tin oxide nanocrystals, J. Mater. Chem., 2012, 22, 11009–11013 RSC.
- S. Das and V. Jayaraman, SnO2: A comprehensive review on structures and gas sensors, Prog. Mater. Sci., 2014, 66, 112–255 CrossRef CAS.
- M. Narjinary, P. Rana, A. Sen and M. Pal, Enhanced and selective acetone sensing properties of SnO2-MWCNT nanocomposites: Promising materials for diabetes sensor, Mater. Des., 2017, 115, 158–164 CrossRef CAS.
- H. Yan, P. Song, S. Zhang, Z. Yang and Q. Wang, Dispersed SnO2 nanoparticles on MoS2 nanosheets for superior gas-sensing performances to ethanol, RSC Adv., 2015, 5, 79593–79599 RSC.
- K. Inyawilert, A. Wisitsoraat, C. Sriprachaubwong, A. Tuantranont, S. Phanichphant and C. Liewhiran, Rapid ethanol sensor based on electrolytically-exfoliated graphene-loaded flame-made In-doped SnO2 composite film, Sens. Actuators, B, 2015, 209, 40–55 CrossRef CAS.
- M. T. V. O. Jayaweera, R. C. L. De Silva, I. R. M. Kottegoda and S. R. D. Rosa, Synthesis, characterization and ethanol vapor sensing performance of SnO2/Graphene composite film, J. Phys., 2015, 15, 1–10 Search PubMed.
- H. Dai, S. Zhang, G. Xu, Y. Peng, L. Gong, X. Li, Y. Li, Y. Lin and G. Chen, Highly photoactive heterojunction based on g-C3N4 nanosheets decorated with dendritic zinc(II) phthalocyanine through axial coordination and its ultrasensitive enzyme-free sensing of choline, RSC Adv., 2014, 4, 58226–58230 RSC.
- Q. Lu, J. Zhang, X. Liu, Y. Wu, R. Yuan and S. Chen, Enhanced electrochemiluminescence sensor for detecting dopamine based on gold nanoflower@graphitic carbon nitride polymer nanosheet-polyaniline hybrids, Analyst, 2014, 139, 6556–6562 RSC.
- X. She, H. Xu, H. Wang, J. Xia, Y. Song, J. Yan, Y. Xu, Q. Zhang, D. Du and H. Li, Controllable synthesis of CeO2/g-C3N4 composites and their applications in the environment, Dalton Trans., 2015, 44, 7021–7031 RSC.
- X. L. Zhang, C. Zheng, S. S. Guo, J. Li, H. H. Yang and G. Chen, Turn-on fluorescence sensor for intracellular imaging of glutathione using g-C3N4 nanosheet-MnO2 sandwich nanocomposite, Anal. Chem., 2014, 86, 3426–3434 CrossRef CAS PubMed.
- B. Zeng, L. Zhang, X. Wan, H. Song and Y. Lv, Fabrication of α-Fe2O3/g-C3N4 composites for cataluminescence sensing of H2S, Sens. Actuators, B, 2015, 211, 370–376 CrossRef CAS.
- J. L. Cao, Y. Wang, T. Y. Zhang, S. H. Wu and Z. Y. Yuan, Preparation, characterization and catalytic behavior of nanostructured mesoporous CuO/Ce0.8Zr0.2O2 catalysts for low-temperature CO oxidation, Appl. Catal., B, 2008, 78, 120–128 CrossRef CAS.
- Y. Xiao, Q. Yang, Z. Wang, R. Zhang, Y. Gao, P. Sun, Y. Sun and G. Lu, Improvement of NO2 gas sensing performance based on discoid tin oxide modified by reduced graphene oxide, Sens. Actuators, B, 2016, 227, 419–426 CrossRef CAS.
- Y. Zhang, D. Zhang, W. Guo and S. Chen, The α-Fe2O3/g-C3N4 heterostructural nanocomposites with enhanced ethanol gas sensing performance, J. Alloys Compd., 2016, 685, 84–90 CrossRef CAS.
- Y. Zang, L. Li, X. Li, R. Lin and G. Li, Synergistic collaboration of g-C3N4/SnO2 composites for enhanced visible-light photocatalytic activity, Chem. Eng. J., 2014, 246(16), 277–286 CrossRef CAS.
| This journal is © The Royal Society of Chemistry 2017 |

