 Open Access Article
Creative Commons Attribution 3.0 Unported Licence
Removal of waterborne phage and NO3− in the nZVI/phage/NO3− system: competition effect†
Rong Cheng *a,
Xing-yan Xuea,
Guan-qing Lia,
Lei Shia,
Mi Kanga,
Tao Zhanga,
Ya-ping Liua,
Xiang Zheng*a and
Jian-long Wangb
aSchool of Environment and Natural Resources, Renmin University of China, No. 59 Zhongguancun Street, Haidian District, Beijing 100872, P. R. China. E-mail: chengrong@ruc.edu.cn; zhengxiang7825@163.com; Fax: +86 1062511042; Tel: +86 1082502065
bInstitute of Nuclear and New Energy Technology, Tsinghua University, Beijing 100084, P. R. China
First published on 11th May 2017
Abstract
Waterborne pathogenic viruses are a threat to public health. Nanoscale zero-valent iron (nZVI) has increasingly been applied to the removal of viruses. However, current studies are usually based on single component systems, which are not consistent with reclaimed water containing various pollutants in complex mixtures. In this study, a coexisting system containing microorganisms and chemical substances was constructed. Phage f2 and NO3− were selected as the model virus and nutrient substance in water to investigate the removal of waterborne phage and a chemical substance in an nZVI/phage/NO3− system. The results showed that phage f2 and NO3− could coexist without interference in a phage/NO3− system, while there was competition between phage f2 and NO3− for nZVI when nZVI was added. The removal efficiency of phage f2 decreased with an increase in NO3− concentration (0–100 mg L−1). When the initial concentration of virus was 8 × 10⁵ PFU mL−1, the virus removal efficiency was not altered by NO3−; however, it was significantly reduced by NO3− when the initial concentration of the virus was increased (8 × 10⁶ to 8 × 10⁷ PFU mL−1). In addition, the virus (8 × 10⁶ PFU mL−1) reduced the NO3− (20 mg L−1) removal by nZVI (60 mg L−1). With an increase in nZVI dosage, the virus removal efficiency first increased and then decreased irrespective of NO3− being present. Nevertheless, the turning point of virus removal efficiency was retard in the presence of NO3−. The removal efficiency of NO3− increased with an increase in the nZVI dosage (20–120 mg L−1) irrespective of whether the virus was present, but the effect of virus on NO3− removal was weakened. Under acidic conditions, phage f2 was superior to NO3− in reacting with nZVI, and NO3− was superior to phage f2 under alkaline conditions.
1. Introduction
Reusing wastewater is an effective way to solve the problem of water shortage worldwide.1 However, the sources of reclaimed water are usually the secondary effluents from municipal wastewater treatment plants, which commonly contain toxic trace organics, heavy metals, and different types of pathogenic microorganisms including bacteria, viruses and parasites.2 Viruses, with small sizes of approximately 0.01–0.1 μm and strong resistance to traditional water treatment,3 pose serious health threats. It was reported that approximately 600![[thin space (1/6-em)]](https://www.rsc.org/images/entities/char_2009.gif) 000 children all over the world die from rotavirus infection every year.4 Therefore, it is essential and urgent to remove waterborne pathogenic viruses from reclaimed water.
000 children all over the world die from rotavirus infection every year.4 Therefore, it is essential and urgent to remove waterborne pathogenic viruses from reclaimed water.
Chlorine and UV disinfection are the two main technologies applied in water and wastewater disinfection. For chlorine disinfection, the formation of disinfection byproducts, including trihalomethanes, haloacetic acids and nitrosamines, has been a great challenge for more than a century.5 Another concern with chlorination is that some viruses such as Cryptosporidium and Giardia tend to develop resistance to chlorine. As a result, higher doses of chlorine are needed for complete virus inactivation.6 UV disinfection has received much attention since no disinfection byproducts are produced.7 However, UV disinfection has some disadvantages including high energy consumption and high water treatment cost.8 Moreover, the phenomenon of photoreactivation can sometimes occur.9
Nanoscale zero-valent iron (nZVI), with sizes of approximately 1–100 nm, have been used for a wide variety of applications including the removal of groundwater pollutants and the harvesting of oleaginous micro alga.10–12 Recently, nZVI has increasingly been applied in removing and inactivating viruses, such as f2, MS2 and φX174,13–15 due to its small size, large specific surface area and high reactivity.16 In previous studies, virus removal with nZVI under different conditions and the inactivation mechanism were studied.13,14 However, current studies are usually based on the systems with a single component, which are not consistent with real reclaimed water where various pollutants are present as complex mixtures.17 When nZVI is injected into the reclaimed water for removing viruses, it also interacts with other pollutants.
As a nutrient element, nitrogen is essential for microorganisms. However, an excessive release of nitrogen can cause eutrophication. In addition, the release of nitrogen species is a threat to public health. In particular, nitrate has been identified as a potential health hazard to humans, particularly to pregnant women and infants.18,19 In recent years, the reduction of nitrate by nZVI was reported in several studies, considering factors influencing nitrate reduction and possible products of nitrate reduction.20–24
In this study, NO3− was selected as a pollutant, and the pathogenic virus phage f2, which has similar properties to some pathogenic viruses such as Norwalk, poliovirus and hepatitis A virus, was chosen as the model virus. In addition, the effect of NO3− on virus removal by nZVI and the effect of the virus on NO3− removal by nZVI were studied. We believe that the interaction between nZVI, virus and NO3− was important for the removal of virus and NO3−, and it is necessary to study the removal of the virus and NO3− in an nZVI/virus/NO3− system, which is rather limited to date. In addition, effects of nZVI concentration and pH value on the interactions between phage f2 and NO3− were also investigated.
2. Materials and methods
2.1 Materials
Chemicals used in the experiments were of reagent grade. All chemicals including agar, nutrient broth, nutrient agar medium, ferrous sulfate, sodium borohydride, sodium hydroxide, hydrochloric acid and sodium nitrate were purchased from the Sinopharm Chemical Reagent Co., Ltd (Beijing, China). All solutions were prepared using ultrapure water before use (Milli-Q, Millipore, US).2.2 Synthesis and characterization of nZVI
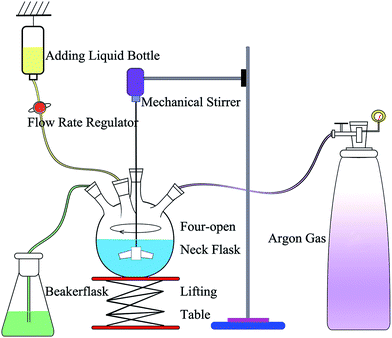
The synthesis of nZVI was conducted in a four-open neck flask (Fig. 1), and nZVI was prepared by a chemical reduction method in aqueous solutions. Argon gas was used to remove oxygen from the flask, and anaerobic conditions were maintained throughout the process. A mechanical stirrer was used to blend the solution and prevent the reunion of nZVI. A lifting table was used to adjust the height of the flask. A 100 mL aliquot of an aqueous solution of 1.00 M NaBH4, in a bottle, was added dropwise to the four-open neck flask with 100 mL of an aqueous solution of 0.20 M FeSO4, and nZVI was obtained through the following chemical reaction [eqn (1)]. The flow rate regulator was used to adjust the dropping speed. The ultrapure water in the flask could be deoxygenated during the reaction process and then used for washing the synthesized particles. The as-prepared particles were washed 3 times with degassed ultrapure water, dried in a vacuum dryer, and then characterized with a scanning electron microscopy (SEM) and X-ray diffraction (XRD). The SEM image and XRD spectrum of nZVI are shown in the ESI (Fig. S1 and S2†).| 2Fe2+ + BH4− + 3H2O → 2Fe0 + H3BO3 + 3H+ + 2H2 | (1) |
2.3 Preparation of phage f2
Phage f2 was prepared using E. coli 285 as a host. Phage f2 and E. coli 285 were purchased from the Institute of Hygiene and Environmental Medicine, Academy of Military Medical Sciences (Beijing, China). The culture medium of E. coli 285 was as follows: 10 g of peptone, 5 g of sodium chloride and 3 g of beef extract in 1 L of ultrapure water.Phage f2 concentrate was prepared as described with the following procedures. E. coli 285 was incubated at 37 °C for 12 h, and a single colony was added into a flask containing 10 mL of liquid medium and incubated at 37 °C for 6–8 h. Then, 1 mL of liquid culture was added into a flask containing 100 mL of liquid medium to prolong the incubation at 37 °C for 6–8 h. After that, 1 mL of phage f2 was added and incubated at 37 °C for 24 h. The mixture was collected, centrifuged (4000 rpm, 10 min) and filtered with a 0.22 μm microporous membrane. The filtrate was the phage f2 concentrate.
2.4 Experimental procedure
Experiments were conducted in a flask with solution volume of 500 mL. A certain amount of nitrate solution and phage f2 were added to the flask containing a certain amount of nZVI. Then, the flask was placed on a shaker with constant temperature (30 °C) with a required rotation rate (120 rpm). The experiments were performed with exposure to air. The initial pH value of reactant solution was adjusted by sodium hydroxide and hydrochloric acid. A certain amount of sample was withdrawn from different test groups at regular intervals. The nitrate solution and phage f2 solution were taken as controls. Each experiment was performed in triplicate.For the experiments referring to the effects of NO3− on the phage f2 removal, the nZVI dosage was 60 mg L−1 and the initial pH value was 7.0. When testing the effects of the NO3− concentration, the initial concentration of phage f2 was 8 × 10⁶ PFU mL−1, and the initial concentrations of NO3− were 10, 50, 100 mg L−1. When testing the effects of virus concentration, NO3− added was 20 mg L−1, and the initial concentrations of phage f2 were 8 × 10⁵, 8 × 10⁶, 8 × 10⁷ PFU mL−1.
For the experiments referring to the effects of phage f2 on the NO3− removal, the nZVI dosage, initial pH value, virus concentration, and the NO3− added were 60 mg L−1, 7.0, 8 × 10⁶ PFU mL−1, 20 mg L−1, respectively.
For the experiments referring to the effects of nZVI dosage, the initial pH value, virus concentration, and the NO3− added were 7.0, 8 × 10⁶ PFU mL−1, 20 mg L−1, respectively. The nZVI dosages were set to be 20, 40, 60, 80, 100 mg L−1.
For the experiments referring to the effects of pH, the nZVI dosage, virus concentration, and the NO3− added were 60 mg L−1, 8 × 10⁶ PFU mL−1, 20 mg L−1, respectively. The initial pH values were set to 5.0, 7.0, and 9.0.
2.5 Analytical methods
The concentration of phage f2 was determined by the double layer agar method.25 The sample was diluted with phosphate buffered saline (PBS), incubated at 37 °C, and then the plaque forming units of each dish were counted. The phage f2 concentration was reported as plaque forming unites per milliliter (PFU mL−1). The concentrations of total nitrogen, NO3−–N, NH4+–N and NO2−–N in the solution were analyzed with spectrophotometric determination method using a UV-Vis spectrophotometer (DR 6000, HACH, US).24,26,27 The pH value of the solution was measured with a pH meter (STARTER 3100, OHAUS, US).3. Results and discussion
3.1 Effects of NO3− on the phage f2 removal by nZVI
Fig. 2 illustrated the effects of NO3− concentration on the phage f2 removal by nZVI. After a 120 min reaction, the removal efficiencies of phage f2 were 6.9, 4.1, 2.6 and 0.9 log by nZVI in the presence of 0, 10, 50 and 100 mg L−1 NO3−, respectively. Clearly, the virus removal efficiency by nZVI was significantly reduced with the addition of NO3−. As more NO3− was added, a lower virus removal efficiency was obtained. On one hand, parts of the reactive sites on the surface of nZVI were occupied by NO3−. Therefore, the chance for phage f2 to contact with nZVI was decreased. On the other hand, the reactive oxygen species including ·OH, H2O2 and ·O2− would be produced by the reaction between nZVI and oxygen in the nZVI/O2/H2O system [eqn (2)–(6)],14 which should be an important factor for virus inactivation. However, in the presence of NO3−, nZVI could be consumed by the reaction between nZVI and NO3− directly, since NO3− was an electron acceptor and nZVI was a reducing nanomaterial. Then, reactive oxygen species generated by nZVI decreased.28–30 In addition, nZVI would be rapidly corroded and deactivated.
| Fe0 + O2 + 2H+ → Fe(II) + H2O2 | (2) |
| Fe0 + H2O2 + 2H+ → Fe(II) + 2H2O | (3) |
| Fe(II) + H2O2 → Fe(III) + ·OH + OH− | (4a) |
| Fe(II) + H2O2 → Fe(IV) + H2O | (4b) |
| Fe(II) + O2 → Fe(III) + ·O2− | (5) |
| Fe(II) + ·O2− + 2H+ → Fe(III) + H2O2 | (6) |
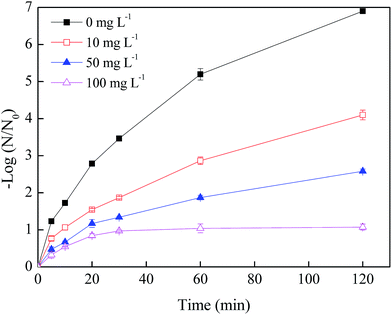 | ||
| Fig. 2 Effects of NO3− concentration on the virus removal by nZVI (nZVI: 60 mg L−1, phage f2 initial concentration: 8 × 10⁶ PFU mL−1, pH: 7.0, T: 30 °C, shaking rate: 120 rpm). | ||
The effects of products of NO3− on virus removal were considered. As noted in Section 3.2, NH4+ and NO2− were the products of NO3− reduction by nZVI. Then, the effects of NH4+ and NO2− on phage f2 were studied. The results showed that the removal efficiencies of phage f2 by NH4+ after a 120 min reaction were 0.04 log and 0.05 log when the concentrations of NH4+ were 0.5 mg L−1 and 1 mg L−1, respectively. Moreover, the removal efficiency of phage f2 by NO2− was 0.02 log after a 120 min reaction when the concentration of NO2− was 0.02 mg L−1. Clearly, NH4+ and NO2− had no significant impact on the virus survival under the experimental conditions.
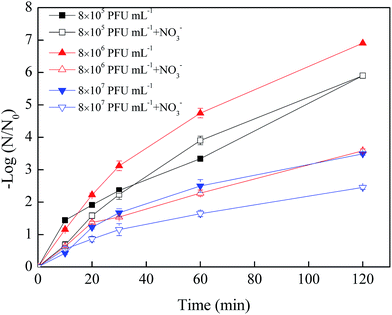 | ||
| Fig. 3 Effects of virus initial concentration on the virus removal by nZVI with NO3− (nZVI: 60 mg L−1, NO3−: 20 mg L−1, pH: 7.0, T: 30 °C, shaking rate: 120 rpm). | ||
In the absence of NO3−, the removal efficiencies of phage f2 by nZVI were 5.9, 6.9 and 3.5 log after a 120 min reaction when the virus initial concentrations were 8 × 10⁵, 8 × 10⁶ and 8 × 10⁷ PFU mL−1, respectively. Clearly, the nZVI was sufficient for virus removal when the virus initial concentration was lower than 8 × 10⁶ PFU mL−1, but it may have been insufficient when the virus initial concentration increased to 8 × 10⁷ PFU mL−1. Similar results were obtained in our previous studies.13 In addition, phage f2 with high concentration would be an aggregate, which protected the inner phage from being inactivated by nZVI.
3.2 Effects of phage f2 on NO3− removal by nZVI
In the nZVI/NO3− system, NO3− can be reduced to NH4+, NO2− and N2 by nZVI via a series of reactions. The possible reaction pathways are proposed for the NO3− reduction by nZVI as eqn (7)–(14).18,20,31–34| 4Fe0 + NO3− + 10H+ → NH4+ + 3H2O + 4Fe2+ | (7) |
| Fe0 + NO3− + 2H+ → Fe2+ + NO2− + H2O | (8) |
| 2.82Fe0 + 0.75Fe2+ + NO3− + 2.25H2O → 1.19Fe3O4 + NH4+ + 0.5OH− | (9) |
| 3Fe0 + NO3− + 3H2O → Fe3O4 + NH4+ + 2OH− | (10) |
| 3Fe0 + NO2− + 8H+ → 3Fe2+ + NH4+ + 2H2O | (11) |
| 5Fe0 + 2NO3− + 6H2O → 5Fe2+ + N2 + 12OH− | (12) |
| 3Fe0 + 2NO2− + 8H+ → 3Fe2+ + N2 + 4H2O | (13) |
| 15Fe0 + 8NO3− + 4H2O → 5Fe3O4 + 4N2 + 8OH− | (14) |
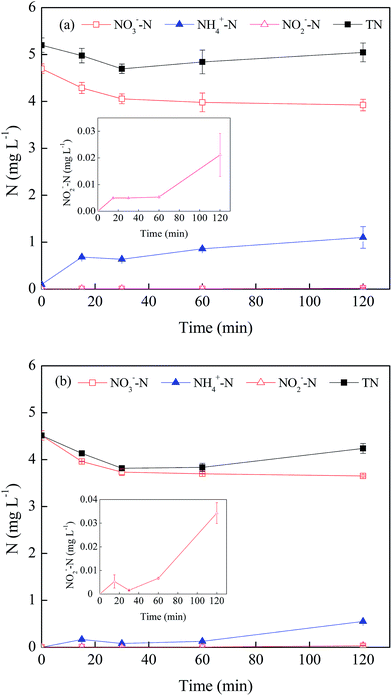
Fig. 4 illustrates the total nitrogen mass and the evolution processes of three nitrogen species including NO3−, NH4+ and NO2− in the nZVI/phage/NO3− system. Along with an increase in reaction time, the total nitrogen in the solution decreased in the absence of phage f2. This indicated that part of NO3− was reduced to N2 by nZVI based on the nitrogen balance [eqn (12)–(14)].20,32 Compared with that in the system without phage f2, the total nitrogen increased in the presence of the virus. To determine the source of nitrogen, some control experiments were conducted, and the different nitrogen species were determined. The results showed that NO3−–N, NH4+–N and total nitrogen in the f2 solution was 0.23 mg L−1, 0.10 mg L−1 and 0.71 mg L−1, respectively. In addition, NO2−–N was not detected in the f2 solution. This confirmed that parts of the nitrogen in the system with virus came from the original f2 solution. In addition, in the nZVI/phage system, the total nitrogen mass increased from 0.71 mg L−1 to 0.87 mg L−1 after a 120 min reaction. This indicated that the virus could be decomposed after being inactivated by nZVI. Then, the nitrogen in the protein and RNA from the virus were eventually released into the solution, which resulted in an increase in the total nitrogen mass of the solution. Considering the varying process, there was no significant change in the total nitrogen in the nZVI/phage/NO3− system over time, though there was a slight fluctuation during the reaction. This indicated that very little N2 was produced in the system with the virus, which was different from the system without the virus analyzed earlier.
With regards to NO3−, the changes in the processes over time were similar in the two systems. In the absence of phage f2, approximately 19.1% NO3− was removed by nZVI after a 120 min reaction. In the presence of phage f2, 17.0% NO3− was removed after a 120 min reaction. The NO3− removed by nZVI was a little less when the virus was present. This indicated that virus might inhibit the NO3− reduction by nZVI, but the effect was not so prominent.
Among the products of NO3−, NH4+ was the main product of NO3− reduction by nZVI. This indicated that NO3− was reduced by nZVI to NH4+ [eqn (7)–(11)].18 The concentration of NH4+–N in the presence of virus (1.10 mg L−1) was higher than that in the system without the virus (0.60 mg L−1). As mentioned above, there was 0.10 mg L−1 NH4+–N in the original f2 solution. However, the amount could not compensate the difference of NH4+–N between the two systems. This meant that there was less NO3− removed but more NH4+ produced when the virus was present. There were two possibilities to explain these observations. Organic nitrogen and NO3− from the f2 solution could be transformed into NH4+ through the effect of nZVI. In addition, the nitrogen in the protein and RNA of the virus could be transformed into NH4+ via a series of reactions. NO2−–N was also detected in the product of NO3−, but the mass was very low (<0.03 mg L−1) [eqn (8)]. Similar results were obtained in the NO3− reduction by nZVI.18,33 Moreover, there was some fluctuation in NO2−–N concentration, and it indicated that NO2− was the intermediate product in the NO3− reduction process by nZVI.33 Then, NO2− was continuously transformed to other substances such as NH4+ [eqn (12)].34
In general, in the presence of phage f2, the reduction process of NO3− was affected since parts of the nZVI were responsible for phage f2 inactivation. In addition, the pathway for the transformation of NO3− to N2 might be inhibited.
3.3 Effects of nZVI dosage on the interactions
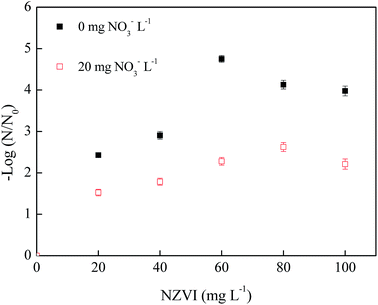 | ||
| Fig. 5 Effects of nZVI dosage on phage f2 removal with/without NO3− (phage f2 initial concentration: 8 × 10⁶ PFU mL−1, pH: 7.0, T: 30 °C, shaking rate: 120 rpm, time: 60 min). | ||
In general, the removal efficiency of phage f2 by nZVI in the absence of NO3− (2.4–4.8 log) was higher than that of the system with NO3− (1.5–2.6 log). Clearly, NO3− could inhibit the virus removal by nZVI. The existence of NO3− would decrease the chance for the virus to make contact with nZVI and reactive oxygen species generated by nZVI. Moreover, the corrosion and deactivation of nZVI would be accelerated. As a result, the virus removal efficiency decreased. In the absence of NO3−, the virus removal efficiency began to drop when the nZVI dosage was greater than 60 mg L−1. However, the virus removal efficiency began to drop when the nZVI dosage was greater than 80 mg L−1 in the presence of NO3−. Clearly, the required dosage of nZVI to achieve the maximal virus removal efficiency by nZVI was different in the absence of NO3− (60 mg L−1) and in the presence of NO3− (80 mg L−1). It indicated the competition between phage f2 and NO3− for nZVI in the nZVI/phage/NO3− system. In the presence of NO3−, nZVI could be consumed by NO3−, and the agglomeration of nZVI would be relieved to some extent. This means that NO3− inhibited the virus removal by nZVI, and the required dosage of nZVI to achieve the maximal virus removal efficiency increased.
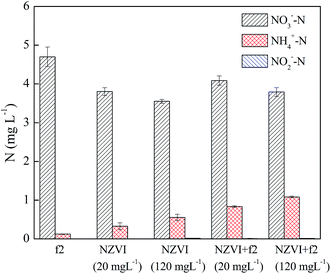
In the absence of phage f2, the removal efficiency of NO3− by nZVI was increased by 5.5% when the nZVI concentration increased from 20 to 120 mg L−1. NO3− could be removed by the direct reduction effect of nZVI. As a result, the NO3− removal efficiency was increased when the nZVI dosage increased. Moreover, some products of nZVI including Fe2+ and Fe3O4 could be produced during the experiment. Moreover, Fe2+ and Fe3O4 could promote the removal of NO3−.36 Similar results were obtained in the presence of phage f2. Compared with the system without phage f2, the removal efficiencies of NO3− by nZVI were decreased by 2.8% and 0.9% in the presence of phage f2 when the nZVI dosages were 20 and 120 mg L−1, respectively. Although the difference was not so obvious between the system with phage f2 and without phage f2, the difference had fallen along with the increase in the nZVI dosage. This meant that the effect of virus on the NO3− removal decreased with the increase in nZVI dosage, which indicated a competition between the virus and NO3−.
When the nZVI dosages were 20 and 120 mg L−1, the concentrations of NH4+–N in solution were 0.3 and 0.6 mg L−1 in the absence of phage f2, and were 0.8 and 1.1 mg L−1 in the presence of phage f2, respectively. On one hand, the concentration of NH4+–N increased with an increase in the nZVI dosage. Similar results were obtained by previous studies.37,38 On the other hand, the concentration of NH4+–N in the presence of the virus was higher than that of the system without the virus. As explained in Section 3.2, part of the extra NH4+–N in the system with the virus might come from the f2 solution. Moreover, organic nitrogen from decomposed phage f2 could also transform into NH4+–N. In addition, NO2−–N was also detected throughout the reduction process, but the mass was very low (<0.02 mg L−1). Similar results were reported in previous studies.18,33
3.4 Effect of pH value on the interactions
As shown in Fig. 7, when the initial pH value was 5.0, the removal efficiency of phage f2 was reduced in the initial 60 min in the presence of NO3−. However, all of the phage f2 was removed within 120 min whether NO3− was present. This meant that the reaction rate was hindered by NO3−, but the virus could be completely and finally removed within 120 min. Products of nZVI generated from the reaction between nZVI and NO3− could contribute to the virus removal. For example, Fe(II) was more stable under acidic conditions. As a result, more viruses were inactivated.39 In addition, some substances, such as Fe(II), Fe(III), Fe(IV), ·OH and H2O2, would be produced when nZVI reacted with oxygen in water.14 In addition, different radical species dominated the mixture at different pH values. Under acidic conditions, ·OH was expected to be the dominant radical35 and made a significant contribution to the virus removal due to its high reactivity.
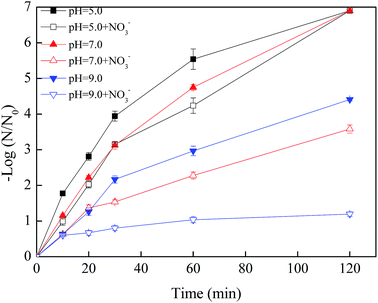 | ||
| Fig. 7 Effects of pH value on the virus removal by nZVI with/without NO3− (nZVI: 60 mg L−1, phage f2 initial concentration: 8 × 10⁶ PFU mL−1, NO3− added: 20 mg L−1, T: 30 °C, shaking rate: 120 rpm). | ||
When the pH values were 7.0 and 9.0, the virus removal efficiencies were reduced within 120 min in the presence of NO3−, and the reduction increased along with the reaction time (Fig. 7). On one hand, the reaction between NO3− and nZVI was the acidic-driven reaction process. Products under a natural or alkaline condition, such as Fe2+, would be less than that of the acidic condition.40 On the other hand, Fe(IV) and ·O2− were expected to be the dominant radicals under a natural or alkaline condition, which had less impact on the virus removal due to their low reactivity.14
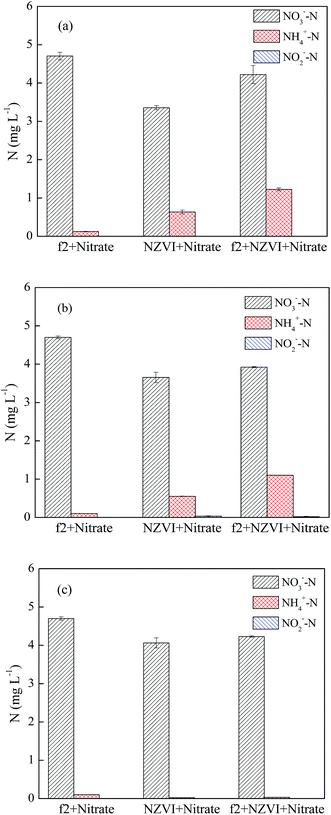
In the absence of phage f2, approximate 25.5%, 19.1% and 10.0% NO3− were reduced by nZVI after a 120 min reaction when the pH values were 5.0, 7.0 and 9.0, respectively. Clearly, the NO3− removal by nZVI decreased with an increase in the pH value, which was similar to the results of previous studies.28,41,42 The NO3− removal by nZVI proceeded on the nZVI surface. At low pH values, the formation of iron oxides, which would reduce the activity of nZVI, could be retarded.28 In addition, the passive layer on the nZVI surface could be dissolved under acid conditions, and then the regenerated Fe0 could effectively reduce NO3−.37 In the presence of phage f2, approximately 10.2%, 16.5% and 10.0% NO3− were reduced by nZVI after a 120 min reaction when the pH values were 5.0, 7.0 and 9.0, respectively. What is interesting is that the removal efficiency of NO3− under neutral conditions was the highest when phage f2 was present. This is much different from that without phage f2. As mentioned above, a higher solution pH value was not favorable for NO3− reduction by nZVI according to eqn (7) and (8). As a result, the removal efficiency of NO3− was relatively lower under alkaline conditions irrespective of whether phage f2 was present. However, the removal efficiency of NO3− was also relatively lower under acidic conditions when phage f2 was present. As mentioned, an acidic condition was favorable for both NO3− reduction and phage f2 inactivation by nZVI. Moreover, the virus removal efficiency was still higher under an acidic condition than that under neutral conditions when NO3− was present as stated in Section 3.4.1. Therefore, the results indicated that phage f2 was superior to NO3− in reacting with nZVI under acidic conditions.
Compared with the system without phage f2, the removal efficiencies of NO3− by nZVI decreased by 15.3%, 2.6% and 0 in the presence of phage f2 when the pH values were 5.0, 7.0 and 9.0, respectively. Clearly, the effect of the virus on NO3− removal by nZVI rapidly decreased when the pH value increased from 5.0 to 7.0. Particularly, when the pH value was 9.0, the removal efficiency of NO3− by nZVI was almost the same irrespective of whether phage f2 was present. As mentioned, the activity of nZVI was relatively lower under alkaline conditions. Hence, the alkaline condition was not favorable for both NO3− reduction and phage f2 inactivation by nZVI. However, the removal efficiency of NO3− was not affected under alkaline conditions when phage f2 was present, while the virus removal efficiency was greatly reduced when NO3− was present. This meant that NO3− was superior to phage f2 in reacting with nZVI under alkaline conditions.
In the absence of phage f2, the concentrations of NH4+–N in solution were 0.60, 0.50 and 0.02 mg L−1 when the pH values were 5.0, 7.0 and 9.0, respectively. Clearly, the NH4+–N concentration decreased with an increase in the pH value. As explained in Section 3.4.1, NO3− removal by nZVI was the acidic-driven reaction process. As a result, more NO3− was transformed to NH4+ at lower pH values. In the presence of virus, the concentrations of NH4+–N were 1.2, 1.1 and 0.03 mg L−1 when the pH values were 5.0, 7.0 and 9.0, respectively. Clearly, the concentration of NH4+–N in the presence of virus was higher than that of the system without the virus. As explained in Section 3.2, organic nitrogen and NO3− from the f2 solution, and nitrogen in the protein and RNA of the virus could be transformed into NH4+ via a series of reactions. The virus removal efficiency by nZVI under acidic conditions was higher than that of an alkaline condition.13,14 Therefore, the concentration of NH4+–N under acidic conditions was higher than that of alkaline conditions. In addition, NO2−–N was also detected throughout the reduction process, but the mass was very low (<0.02 mg L−1). Similar results were obtained in the NO3− reduction by nZVI.18,33
4. Conclusions
In a phage/NO3− system, phage f2 and NO3− could coexist without interferences, while there was competition between phage f2 and NO3− for nZVI when nZVI was added into the system. NO3− reduced phage f2 removal, and phage f2 also reduced NO3− removal.The removal efficiency of phage f2 by nZVI decreased with an increase in the NO3− concentration (0–100 mg L−1). When the initial concentration of virus was 8 × 10⁵ PFU mL−1, the removal efficiency of phage f2 was not severely altered by NO3−, and all of the phage f2 could be removed within 120 min by nZVI (60 mg L−1) in the presence of NO3− (20 mg L−1). However, the virus removal efficiency was obviously reduced in the presence of NO3− when the virus initial concentration was increased (8 × 10⁶ to 8 × 10⁷ PFU mL−1). Also, virus (8 × 10⁶ PFU mL−1) reduced the NO3− (20 mg L−1) reduction by nZVI (60 mg L−1), and the pathway for the transformation of NO3− to N2 might be inhibited. NH4+ was the main product, and NO2− (<0.03 mg L−1) was the intermediate product of NO3− reduction by nZVI.
With an increase in nZVI dosage, the virus removal efficiency was firstly increased and then decreased whether NO3− was present. Nevertheless, the turning point of virus removal efficiency was retard in the presence of NO3−. In the absence of NO3−, the virus removal efficiency began to decrease when the nZVI dosage was greater than 60 mg L−1. However, the virus removal efficiency began to decrease when the nZVI dosage was greater than 80 mg L−1 in the presence of NO3−. With regards to NO3−, the removal efficiency of NO3− increased with an increase in the NZVI dosage (20–120 mg L−1) whether the virus was present, but the effect of the virus on the NO3− removal by nZVI was weakened.
The virus removal efficiency decreased with an increase in the initial pH value whether NO3− was present. Also, the effect of NO3− on virus removal by nZVI was much stronger under neutral and alkaline conditions. The removal efficiency of NO3− also decreased with an increase in the initial pH value when phage f2 was absent. However, when phage f2 was present, the removal efficiency of NO3− under a neutral condition was the highest. When the pH value was 9.0, the removal efficiency of NO3− by nZVI was not affected by phage f2. This meant that phage f2 was superior to NO3− under acidic conditions and NO3− was superior to phage f2 under alkaline conditions in reacting with nZVI.
Acknowledgements
The research was supported by the National Natural Science Foundation of China (Grant No. 51478460, 51108454), the Fundamental Research Funds for the Central Universities, and the Research Funds of Renmin University of China (Grant No. 10XNJ062), which are greatly acknowledged.References
- J. Chu, J. Chen, C. Wang and P. Fu, Wastewater reuse potential analysis: implications for China's water resources management, Water Res., 2004, 38, 2746–2756 CrossRef CAS PubMed
.
- J. B. Rose, L. J. Dickson, S. R. Farrah and R. P. Carnahan, Removal of pathogenic and indicator microorganisms by a full-scale water reclamation facility, Water Res., 1996, 30, 2785–2797 CrossRef CAS
.
- B. Zeitler and I. Rapp, Surface-dried viruses can resist glucoprotamin-based disinfection, Appl. Environ. Microbiol., 2014, 80, 7169–7175 CrossRef CAS PubMed
.
- U. D. Parashar, C. J. Gibson, J. S. Bresee and R. I. Glass, Rovirus and severe children diarrhea, Emerging Infect. Dis., 2006, 12, 304–306 CrossRef PubMed
.
- S. E. Hrudey, Chlorination disinfection by-products, public health risk tradeoffs and me, Water Res., 2009, 43, 2057–2092 CrossRef CAS PubMed
.
- W. Q. Betancourt and J. B. Rose, Drinking water treatment processes for removal of Cryptosporidium and Giardia, Vet. Parasitol., 2004, 126, 219–234 CrossRef CAS PubMed
.
- L. Liberti, M. Notarnicola and D. Petruzzelli, Advanced treatment for municipal wastewater reuse in agriculture. UV disinfection: parasite removal and by-product formation, Desalination, 2003, 152, 315–324 CrossRef CAS
.
- P. Setlow, Spores of Bacillus subtilis: their resistance to and killing by radiation, heat and chemicals, J. Appl. Microbiol., 2006, 101, 514–525 CrossRef CAS PubMed
.
- K. Oguma, H. Katayama and S. Ohgaki, Photoreactivation of Legionella pneumophila after inactivation by low-or medium-pressure ultraviolet lamp, Water Res., 2004, 38, 2757–2763 CrossRef CAS PubMed
.
- Y. C. Lee, K. Lee, Y. Hwang, H. R. Andersen, B. Kim, S. Y. Lee, M. H. Choi, J. Y. Park, Y. K. Han, Y. K. Oh and Y. S. Huh, Aminoclay-templated nanoscale zero-valent iron (nZVI) synthesis for efficient harvesting of oleaginous microalga, Chlorella sp. KR-1, RSC Adv., 2014, 4, 4122–4127 RSC
.
- P. D. Mines, J. Byun, Y. Hwang, H. A. Patel, H. R. Andersen and C. T. Yavuz, Nanoporous networks as effective stabilisation matrices for nanoscale zero-valent iron and groundwater pollutant removal, J. Mater. Chem. A, 2016, 4, 632–639 CAS
.
- Y. Hwang, A. Salatas, P. D. Mines, M. H. Jakobsen and H. R. Andersen, Graduated characterization method using a multi-well microplate for reducing reactivity of nanoscale zero valent iron materials, Appl. Catal., B, 2016, 2016(181), 314–320 CrossRef
.
- R. Cheng, G. Li, C. Cheng, P. Liu, L. Shi, Z. Ma and X. Zheng, Removal of bacteriophage f2 in water by nanoscale zero-valent iron and parameters optimization using response surface methodology, Chem. Eng. J., 2014, 252, 150–158 CrossRef CAS
.
- J. Y. Kim, C. Lee, D. C. Love, D. L. Sedlak, J. Yoon and K. L. Nelson, Inactivation of MS2 coliphage by ferrous ion and zero-valent iron nanoparticles, Environ. Sci. Technol., 2011, 16, 6978–6984 CrossRef PubMed
.
- Y. You, J. Han, P. C. Chiu and Y. Jin, Removal and inactivation of waterborne viruses using zerovalent iron, Environ. Sci. Technol., 2005, 23, 9263–9269 CrossRef
.
- R. Cheng, J. L. Wang and W. X. Zhang, Comparison of reductive dechlorination of pchlorophenol using Fe0 and nanosized Fe0, J. Hazard. Mater., 2007, 144, 334–339 CrossRef CAS PubMed
.
- A. Bakir, S. J. Rowland and R. C. Thompson, Competitive sorption of persistent organic pollutants onto microplastics in the marine environment, Mar. Pollut. Bull., 2012, 64, 2782–2789 CrossRef CAS PubMed
.
- Y. H. Hwang, D. G. Kim and H. S. Shin, Mechanism study of nitrate reduction by nano zero valent iron, J. Hazard. Mater., 2011, 185, 1513–1521 CrossRef CAS PubMed
.
- A. M. Comerton, R. C. Andrews and D. M. Bagley, Evaluation of an MBR-RO system to produce high quality reuse water: microbial control, DBP formation and nitrate, Water Res., 2005, 39, 3982–3990 CrossRef CAS PubMed
.
- D. G. Kim, Y. H. Hwang, H. S. Shin and S. O. Ko, Kinetics of nitrate adsorption and reduction by nano-scale zero valent iron (NZVI): effect of ionic strength and initial pH, J. Civ. Eng., 2015, 20, 1–13 Search PubMed
.
- A. M. E. Khalil, O. Eljamal, S. Jribi and N. Matsunaga, Promoting nitrate reduction kinetics by nanoscale zero valent iron in water via copper salt addition, Chem. Eng. J., 2016, 287, 367–380 CrossRef CAS
.
- L. Peng, Y. Liu, S. H. Gao, X. Chen, P. Xin, X. H. Dai and B. J. Ni, Evaluation on the nanoscale zero valent iron based microbial denitrification for nitrate removal from groundwater, Sci. Rep., 2015, 5, 1–11 Search PubMed
.
- Y. An, T. Li, Z. Jin, M. Dong, Q. Li and S. Wang, Decreasing ammonium generation using hydrogenotrophic bacteria in the process of nitrate reduction by nanoscale zero-valent iron, Sci. Total Environ., 2009, 407, 5465–5470 CrossRef CAS PubMed
.
- K. H. Shin and D. K. Cha, Microbial reduction of nitrate in the presence of nanoscale zero-valent iron, Chemosphere, 2008, 72, 257–262 CrossRef CAS PubMed
.
- X. Zheng, D. Chen, Z. Wang, Y. Lei and R. Cheng, Nano-TiO2-membrane adsorption reactor (MAR) for virus removal in drinking water treatment, Chem. Eng. J., 2013, 230, 180–187 CrossRef CAS
.
- G. F. Wang, M. Satake and K. Horita, Spectrophotometric determination of nitrate and nitrite in water and some fruit samples using column preconcentration, Talanta, 1998, 46, 671–678 CrossRef CAS PubMed
.
- J. E. Yang, J. J. Kim, E. O. Skogley and B. E. Schaff, A simple spectrophotometric determination of nitrate in water, resin, and soil extracts, Soil Sci. Soc. Am. J., 1998, 62, 1108–1115 CrossRef CAS
.
- J. H. Zhang, Z. W. Hao, Z. Zhang, Y. P. Yang and X. H. Xu, Kinetics of nitrate reductive denitrification by nanoscale zero-valent iron, Process Saf. Environ. Prot., 2010, 88, 439–445 CrossRef CAS
.
- C. Tang, Z. Zhang and X. Sun, Effect of common ions on nitrate removal by zero-valent iron from alkaline soil, J. Hazard. Mater., 2012, 231–232, 114–119 CrossRef CAS PubMed
.
- Y. Zhang, Y. Li, J. Li, L. Hu and X. Zheng, Enhanced removal of nitrate by a novel composite: nanoscale zero valent iron supported on pillared clay, Chem. Eng. J., 2011, 171, 526–531 CrossRef CAS
.
- C. H. Liao, S. F. Kang and Y. W. Hsu, Zero-valent iron reduction of nitrate in the presence of ultraviolet light, organic matter and hydrogen peroxide, Water Res., 2003, 37, 4109–4118 CrossRef CAS PubMed
.
- Z. Zhang, Z. W. Hao, Y. P. Yang, J. H. Zhang, Q. Wang and X. H. Xu, Reductive denitrification kinetics of nitrite by zero-valent iron, Desalination, 2010, 257, 158–162 CrossRef CAS
.
- Z. Jiang, L. Lv, W. Zhang, Q. Du, B. Pan, L. Yang and Q. Zhang, Nitrate reduction using nanosized zero-valent iron supported by polystyrene resins: role of surface functional groups, Water Res., 2011, 45, 2191–2198 CrossRef CAS PubMed
.
- M. J. Alowitz and M. M. Scherer, Kinetics of nitrate, nitrite, and Cr(VI) reduction by iron metal, Environ. Sci. Technol., 2002, 36, 299–306 CrossRef CAS PubMed
.
- P. Borm, F. C. Klaessig, T. D. Landry, B. Moudgil, J. Pauluhn, K. Thomas, R. Trottier and S. Wood, Research strategies for safety evaluation of nanomaterials, part V: role of dissolution in biological fate and effects of nanoscale particles, Toxicol. Sci., 2006, 90, 23–32 CrossRef CAS PubMed
.
- J. Xu, Z. W. Hao, C. S. Xie, x. s. Lv, Y. P. Yang and X. H. Xu, Promotion effect
of Fe2+ and Fe3O4 on nitrate reduction using zero-valent iron, Desalination, 2012, 284, 9–13 CrossRef CAS
.
- T. Suzuki, M. Moribe, Y. Oyama and M. Niinae, Mechanism of nitrate reduction by zero-valent iron: equilibrium and kinetics studies, Chem. Eng. J., 2012, 183, 271–277 CrossRef CAS
.
- H. Song, B. H. Jeon, C. M. Chon, Y. Kim, I. H. Nam, F. W. Schwartz and D. W. Cho, The effect of granular ferric hydroxide amendment on the reduction of nitrate in groundwater by zero-valent iron, Chemosphere, 2013, 93, 2767–2773 CrossRef CAS PubMed
.
- J. Y. Kim, C. Lee, D. L. Sedlak, J. Yoon and K. L. Nelson, Inactivation of MS2 coliphage by Fenton's reagent, Water Res., 2010, 44, 2647–2653 CrossRef CAS PubMed
.
- H. Zhang, Z. H. Jin, L. Han and C. H. Qin, Synthesis of nanoscale zero-valent iron supported on exfoliated graphite for removal of nitrate, Trans. Nonferrous Met. Soc. China, 2006, 16, s345–s349 CrossRef
.
- I. F. Cheng, R. Muftikian, Q. Fernando and N. Korte, Reduction of nitrate to ammonia by zero-valent iron, Chemosphere, 1997, 35, 2689–2695 CrossRef CAS
.
- S. Choe, H. M. Liljestrand and J. Khim, Nitrate reduction by zero-valent iron under different pH regimes, Appl. Geochem., 2004, 19, 335–342 CrossRef CAS
.
Footnote |
| † Electronic supplementary information (ESI) available. See DOI: 10.1039/c7ra01724c |
| This journal is © The Royal Society of Chemistry 2017 |

