 Open Access Article
Graphene material preparation through thermal treatment of graphite oxide electrochemically synthesized in aqueous sulfuric acid
B. Gurzędaa,
T. Buchwaldb,
M. Nocuńc,
A. Bąkowicza and
P. Krawczyk *a
*a
aInstitute of Chemistry and Technical Electrochemistry, Poznan University of Technology, Berdychowo 4, 60-965 Poznań, Poland. E-mail: piotr.krawczyk@put.poznan.pl
bFaculty of Technical Physics, Poznan University of Technology, Piotrowo 3, 60-965 Poznań, Poland
cFaculty of Materials Science and Ceramics, AGH University of Science and Technology, al. Mickiewicza 30, 30-059 Kraków, Poland
First published on 4th April 2017
Abstract
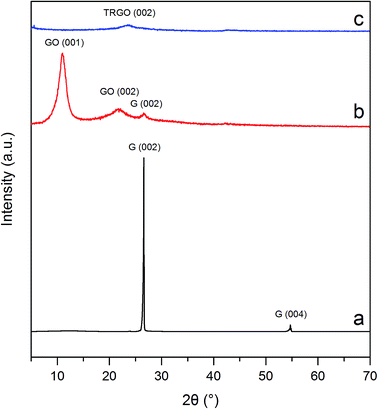
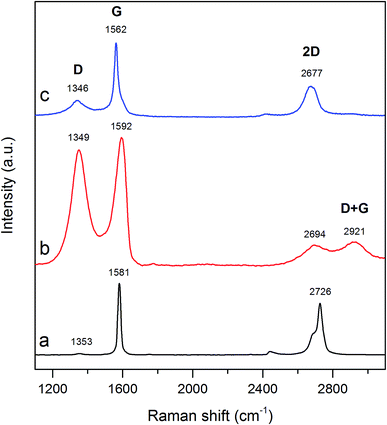
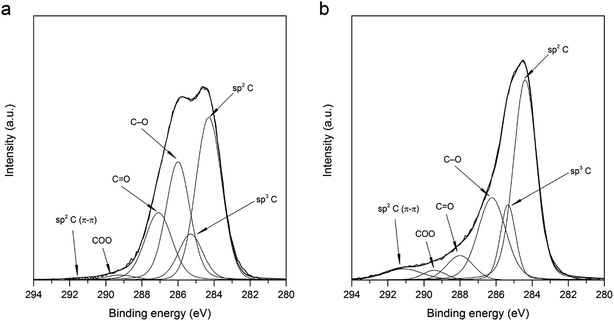
The present work demonstrates a simple and low-cost method to produce bulk quantities of graphene material through the thermal treatment of graphite oxide (GO). GO of a high oxidation degree was synthesized by electrochemical overoxidation of natural graphite in 11 M H2SO4 using linear sweep voltammetry (LSV) technique. The thus synthesized GO was thermally exfoliated-reduced at 500 °C in air, giving the final product – thermally reduced graphite oxide (TRGO). It should be emphasized that the process of TRGO formation from electrochemically obtained GO is for the first time described in the present work. Due to shock treatment, the BET specific surface area of TRGO increased from 4 to 455 m2 g−1. Additionally, a decrease in the concentration of oxygen functionalities was also observed. Thermal stability of electrochemically synthesized GO was investigated by thermogravimetric analysis (TGA). In order to characterize the synthesized TRGO, investigations by X-ray diffraction (XRD), Raman spectroscopy, X-ray photoelectron spectroscopy (XPS) and scanning electron microscopy (SEM) were performed.
1. Introduction
Graphene materials belong to the wide family of graphene nanomaterials containing graphene layers, such as multilayered materials, materials synthesized from graphite or graphene oxide (GO) and chemically modified forms of graphene oxide and reduced graphene oxide (RGO).1 Due to their interesting electrical, thermal and mechanical properties, the interest in graphene materials appears to be enormous.2–5A variety of methods have been employed to produce graphene materials, however exfoliation by mechanical (ball milling, micromechanical cleavage, sonication)5 as well as electrochemical treatment6–8 appear to be most often used. Graphene materials can also be synthesized by other methods, such as chemical or electrochemical reduction of graphene oxide,2,7 thermal exfoliation of graphite/graphene oxide,9–11 unzipping of carbon nanotubes,12 chemical vapour deposition,13 or plasma assisted method.14 Properties of graphene materials being strongly related to the method used as well as conditions applied, determine its practical application, i.e. energy storage devices (capacitors, batteries), catalysts support, sensors, composite materials and conductive inks.2,4,5,15,16
Taking into account the scale of the considered process of graphene formation, a special attention should be paid to the thermal exfoliation–reduction of GO. Owing to thus method large quantities of graphene material can be synthesized.11,17 Thermal treatment of GO reduces the concentration of oxygen functional groups, in parallel the volume of formed TRGO drastically increases comparing to the starting GO.9 GO being the precursor for thermal reduction process is commonly synthesized by chemical methods.9,10,17 However GO prepared by electrochemical overoxidation of graphite can be also used.11,18 GO can be thermally reduced by shock treatment at the temperatures higher than 1000 °C in air or argon atmosphere19–22 or by gradual heating under the inert gas flow (nitrogen or argon).9,23 To remove all oxygen functionalities from the graphitic structure, thermal treatment of GO should be carried out in the presence of hydrogen.17 On much less scale TRGO is produced by microwave assisted treatment of GO.24 The oxidation stage as well as the stage of graphene layer separation are influenced by the employed conditions (atmosphere, temperature, treatment time).14–22,24
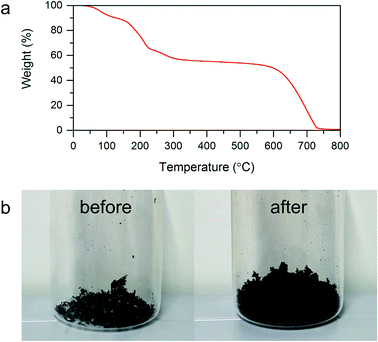
In this work, we present a simple, low-cost and scalable method enabling production the large amounts of graphene material through the thermal exfoliation–reduction of GO. Contrary to the most of research works, where as a precursor the GO synthesized by chemical methods is used, in our work the GO precursor characterized by the high content of oxygen functionalities was synthesized by electrochemical overoxidation of graphite flakes in aqueous H2SO4 solution. Contrary to the chemical methods, GO gathered by electrochemical methods is not contaminated by oxidant and by-products of the conducted oxidation. According to our best knowledge, the formation of graphene material from GO previously prepared by deep anodic overoxidation of graphite in aqueous H2SO4 is for the first time described in our present work. Additionally the amount of used reagents is significantly reduced. Process of thermal exfoliation–reduction of GO was carried out at elevated temperature under presence of air. In order to acquire information on the chemical composition of the synthesized carbon materials as well as their physicochemical features X-ray diffraction (XRD), scanning electron spectroscopy (SEM), Raman spectroscopy, and X-ray photoelectron spectroscopy (XPS) were performed. The choice of exfoliation temperature was proceeded by the thermogravimetric analysis (TGA).
2. Material and methods
2.1. Materials
Natural graphite flakes (purity 99.5%, flake size 170–283 μm) were purchased from Graphit Kropfmühl, Germany. Platinum mesh (purity 99.9%) and platinum wire (purity 99.9%, 1 mm diameter) were purchased from Goodfellow, United Kingdom. Sulfuric acid (purity 95%) was purchased from Avantor, Poland.2.2. Electrochemical oxidation of graphite
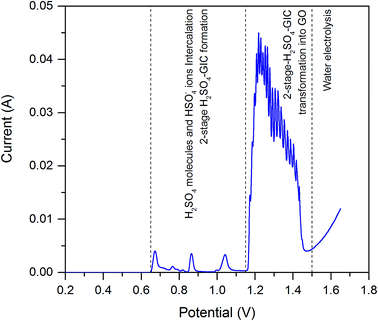
GO was synthesized by deep anodic oxidation of natural graphite flakes closed in platinum mesh. Natural graphite flakes played a role of the working electrode. Platinum wire was a counter electrode. Working electrode as well as counter electrode was immersed in 11 M H2SO4. Electrochemical synthesis were carried out in three-electrode system using linear sweep voltammetry method (LSV). As a reference electrode Hg/Hg2SO4/1 M H2SO4 was used. Measurements were performed in potential range from working electrode rest potential (ER) to 1.6 V with scan rate 0.01 mV s−1.2.3. Thermal exfoliation–reduction of GO
GO was thermally reduced through the thermal treatment, accompanied by its exfoliation, giving final product – TRGO. Quartz crucible filled with GO was rapidly inserted into the muffle furnace adjusted to the 500 °C. The process of thermal exfoliation–reduction was carried out under air atmosphere for 4 min. The as prepared TRGO was cooled in air to ambient temperature.2.4. Instrumentation
Process of graphite electrooxidation was carried out by linear sweep voltammetry using Autolab PGSTAT 302N potentiostat/galvanostat. Thermal treatment of GO was performed in muffle furnace Lentron. The porous structure of synthesized carbon materials was analyzed from nitrogen adsorption/desorption measurements using Autosorb iQ at 77 K. Specific surface area was calculated by Brunauer–Emmett–Teller method (BET). Thermal stability of GO was characterized by thermogravimetric analysis (TGA) using Setaram apparatus. During this measurements the sample was heated up to 800 °C with a heating rate equal to 5 °C min−1. Morphological characterization of GO and TRGO was performed by scanning electron microscopy (SEM) using S-3400N Hitachi microscope and high resolution transmission electron microscopy (HRTEM) (FEI S/TEM TITAN 80-300 microscope). X-ray diffraction (XRD) analysis was performed by PANalytical diffractometer using Cu Kα radiation (1.54 Å) with 2 theta scan range from 4° to 60° and step size of 0.04°. Raman spectroscopy measurements were recorded by inVia Renishaw micro-Raman system with an argon laser, emitting 514.5 nm wavelength. XPS spectra were recorded on VSW spectrometer equipped with hemispherical analyzer. Mg Kα X-ray radiation with 200 W energy was used as the excitation source.3. Results and discussion
3.1. Material preparation
3.2. Materials characterization
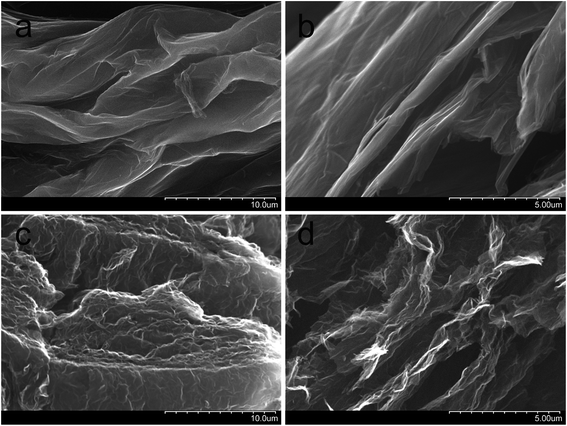
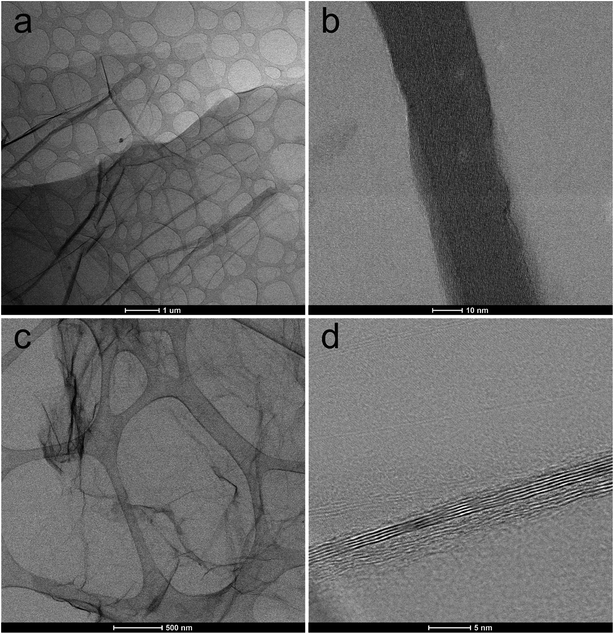
TEM images of GO and TRGO recorded under different magnifications support the above mentioned supposition (see Fig. 4). TEM micrograph of GO confirms its wrinkled structure (Fig. 4a) while HRTEM image discloses that layered structure partially preserved after the deep oxidation of graphite in sulfuric acid (Fig. 4b). It is worth to note that these observations are consistent with the results of XRD analysis. TEM image of TRGO reveals typical deformation of graphene sheets which become practically transparent for electron beam (Fig. 4c). Considerably larger area of a high transparency of graphene layers observed for the reduced graphite oxide (Fig. 4a) contrary to graphite oxide (Fig. 4c) indicates that thermal reduction leads to the partial delamination of graphene layers. HRTEM micrograph of synthesized TRGO (Fig. 4d) confirms the presence of few-layer graphene within its structure.
Besides the above mentioned results, the increased concentration of edges as well as surface defects are also noted. These effects are partially confirmed by the results of specific surface area measurements.
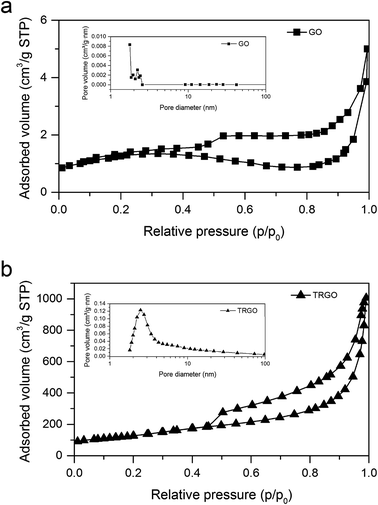 | ||
| Fig. 5 Nitrogen adsorption–desorption isotherms at 77 K and BJH adsorption pore size distribution for (a) GO and (b) TRGO. | ||
| Sample | S BET (m2 g−1) | V T (cm3 g−1) | V micro (cm3 g−1) | V meso (cm3 g−1) |
|---|---|---|---|---|
| a S BET – specific surface area; VT – total pore volume; Vmicro – micropore volume; Vmeso – mesopore volume. | ||||
| GO | 4 | 0.0056 | 0.00046 | 0.00096 |
| TRGO | 455 | 1.57 | 0.0028 | 0.21 |
| Atomic% | ||
|---|---|---|
| GO | TRGO | |
| C | 76.90 | 90.42 |
| O | 23.10 | 9.58 |
| Surface groups | Peak (eV) | Content (%) | Peak (eV) | Content (%) |
|---|---|---|---|---|
| sp2 C (π–π) | 291.4 | 0.22 | 291.1 | 4.57 |
| COO | 289.2 | 1.52 | 289.4 | 2.41 |
C![[double bond, length as m-dash]](https://www.rsc.org/images/entities/char_e001.gif) O O |
287.1 | 18.47 | 288.0 | 6.54 |
| C–O | 286.0 | 28.73 | 286.2 | 24.63 |
| sp3 C | 285.3 | 11.33 | 285.3 | 12.43 |
| sp2 C | 284.3 | 39.73 | 284.4 | 49.42 |
4. Conclusions
Our work describes simple and low-cost method to produce a bulk quantities of graphene material. The investigated process comprises of electrochemical oxidation of graphite in 11 M H2SO4 yielded GO and subsequent its thermal treatment giving final product thermal reduced graphite oxide (TRGO). Electrochemically synthesized GO is characterized by the lower oxidation degree as compared to the GO synthesized by Hummers method. Shock thermal treatment of GO caused significant reduction of oxygen functionalities with parallel delamination of graphene layers. Additionally, the structural properties of synthesized graphene material has been significantly modified compared to host material. TRGO is characterized by the relatively high specific surface area, increased amount of mesopores and enhanced concentration of edges as well as surface defects. The above mentioned features are very close to these noted for TRGO prepared from GO synthesized by Hummers method. It indicates that GO synthesized by anodic oxidation in 11 M H2SO4 can be used to produce TRGO instead of GO synthesized by Hummers method.Acknowledgements
This work was financially supported by the National Science Centre of Poland (3/31/PNCN/0371).References
- A. Bianco, H. M. Chen, T. Enoki, Y. Gogotsi and R. H. Hurt, Carbon, 2013, 63, 1 CrossRef.
- Y. Yang, C. Han, B. Jiang, J. Iocozzia, C. He, D. Shi, T. Jiang and Z. Lin, Mater. Sci. Eng., R, 2016, 102, 1 CrossRef.
- H. Hu, Z. Zhao, Q. Zhou, Y. Gogotsi and J. Qiu, Carbon, 2012, 50, 3267 CrossRef.
- Y. M. Shulga, S. A. Baskakov, E. I. Knerelman, G. I. Davidova, E. R. Badamshina, N. Y. Shulga, E. A. Skryleva, A. L. Agapov, D. N. Voylov, A. P. Sokolov and V. M. Martynenko, RSC Adv., 2014, 4, 587 RSC.
- M. Yi and Z. Shen, J. Mater. Chem. A, 2015, 3, 11700 Search PubMed.
- P. Poizot, B. Humbert, C. P. Ewels, J. Y. Mevellec, N. Stephant and J. Simonet, Carbon, 2016, 107, 823 CrossRef.
- S. Y. Toh, K. S. Loh, S. K. Kamarudin and W. R. W. Daud, Chem. Eng. J., 2014, 251, 422 CrossRef.
- S. Shahrokhian, R. Mohammadi and M. K. Amini, Electrochim. Acta, 2016, 206, 317 CrossRef.
- C. Botas, P. Álvarez, C. Blanco, R. Santamaría, M. Granda, M. D. Gutiérrez, F. Rodríguez-Reinoso and R. Menéndez, Carbon, 2013, 52, 476 CrossRef.
- X. Chen, D. Meng, B. Wang, B. W. Li, W. Li, C. W. Bielawski and R. S. Ruoff, Carbon, 2016, 101, 71 CrossRef.
- B. Gurzęda, P. Florczak, M. Wiesner, M. Kempiński, S. Jurga and P. Krawczyk, RSC Adv., 2016, 6, 63058 RSC.
- S. Salimian and M. E. A. Araghi, Carbon, 2016, 107, 754 CrossRef.
- S. D. Costa, J. Ek Weis, O. Frank, M. Fridrichová and M. Kalbac, RSC Adv., 2016, 76, 72859 RSC.
- S. W. Lee, C. Mattevi, M. Chhowalla and R. M. Sankaran, J. Phys. Chem. Lett., 2012, 3, 772 CrossRef PubMed.
- H. Gao and H. Duan, Biosens. Bioelectron., 2015, 65, 404 CrossRef PubMed.
- E. B. Secor, B. Y. Ahn, T. Z. Gao, J. A. Lewis and M. C. Hersam, Adv. Mater., 2016, 27, 6683 CrossRef PubMed.
- D. Zhan, Z. Ni, W. Chen, L. Sun, Z. Luo, L. Lai, T. Yu, A. T. S. Wee and Z. Shen, Carbon, 2011, 49, 1362 CrossRef.
- B. Gurzęda, P. Florczak, M. Kempiński, B. Peplińska, P. Krawczyk and S. Jurga, Carbon, 2016, 100, 540 CrossRef.
- M. M. Storm, M. Overgaard, R. Younesi, N. E. A. Reeler, T. Vosch, U. G. Nielsen, K. Edström and P. Norby, Carbon, 2016, 85, 233 CrossRef.
- S. R. C. Vivekchand, C. S. Rout, K. S. Subrahmanyam, A. Govindarajm and C. N. R. Rao, J. Chem. Sci., 2008, 120, 9 CrossRef.
- O. Akhavan, Carbon, 2010, 48, 509 CrossRef.
- M. J. McAllister, J. L. Li, D. H. Adamson, H. C. Schniepp, A. A. Abdala, J. Liu, M. Herrera-Alonso, D. L. Milius, R. Car, R. K. Prud’homme and I. A. Aksay, Chem. Mater., 2007, 19, 4396 CrossRef.
- C. Punckt, M. A. Pope, Y. M. Liu and I. A. Aksay, J. Electrochem. Soc., 2016, 163, 491 CrossRef.
- Q. Y. Yan, Q. Liu and J. Wang, Ceram. Int., 2016, 42, 3007 CrossRef.
- J. M. Skowroński, J. Appl. Electrochem., 1994, 24, 245 CrossRef.
- D. D. L. Chung, J. Electron. Mater., 1978, 7, 189 CrossRef.
- F. Beck, J. Jiang and H. Krohn, J. Electroanal. Chem., 1995, 389, 161 CrossRef.
- T. Kuila, A. K. Mishra, P. Khanra, N. H. Kim and J. H. Lee, Nanoscale, 2013, 5, 52 RSC.
- C. M. Chen, Q. Zhang, M. G. Yang, C. H. Huang, Y. G. Yang and M. Z. Wang, Carbon, 2012, 50, 3572 CrossRef.
- Y. Gao, H. Huang, W. Tang, X. Liu, X. Yang and J. Zhang, Microporous Mesoporous Mater., 2015, 217, 210 CrossRef.
- H. Xian, T. Peng, H. Sun and J. Wang, Nano-Micro Lett., 2015, 7, 17 CrossRef.
- Q. Du, M. Zheng, L. Zhang, Y. Wang, J. Chen, L. Xue, W. Dai, G. Ji and J. Cao, Electrochim. Acta, 2010, 55, 3897 CrossRef.
- P. Lian, X. Zhu, S. Liang, Z. Li, W. Yang and H. Wang, Electrochim. Acta, 2010, 55, 3909 CrossRef.
- Z. Q. Li, C. J. Lu, Z. P. Xia, Y. Zhou and Z. Luo, Carbon, 2007, 45, 1686 CrossRef.
- T. N. Blanton and D. Majumdar, Powder Diffr., 2013, 28, 68 CrossRef.
- S. Gadipelli and Z. X. Guo, Prog. Mater. Sci., 2015, 69, 1 CrossRef.
- A. Kaniyoor, T. T. Baby and S. Ramaprabhu, J. Mater. Chem., 2010, 20, 8467 RSC.
- D. Yang, A. Velamakanni, G. Bozoklu, S. Park, M. Stoller, R. D. Piner, S. Stankovich, I. Jung, D. A. Field, C. A. Ventrice Jr and R. S. Ruoff, Carbon, 2009, 47, 145 CrossRef.
- L. M. Malard, M. A. Pimenta, G. Dresselhaus and M. S. Dresselhaus, Phys. Rep., 2009, 473, 51 CrossRef.
- M. Ramm, M. Ata, T. Gross and W. Unger, Appl. Phys. A: Mater. Sci. Process., 2000, 70, 387 CrossRef.
- A. C. Ferrari, Solid State Commun., 2007, 143, 47 CrossRef.
- K. Krishnamoorthy, M. Veerapandian, K. Yun and S. J. Kim, Carbon, 2013, 53, 38 CrossRef.
- K. N. Kudin, B. Ozbas, H. C. Schniepp, R. K. Proud’homme, I. A. Aksay and R. Car, Nano Lett., 2008, 8, 36 CrossRef PubMed.
- A. M. Dimiev and J. M. Tour, ACS Nano, 2014, 8, 3060 CrossRef PubMed.
- Z. González, C. Botas, P. Álvarez, S. Roldán, S. Blanco, R. Santamaría, M. Granda and R. Menéndez, Carbon, 2012, 50, 828 CrossRef.
- S. Stankovich, D. A. Dikin, R. D. Piner, K. A. Kohlhaas, A. Kleinhammes, Y. Jia, Y. Wu, S. T. Nguyen and R. S. Ruoff, Carbon, 2007, 45, 1558 CrossRef.
- C. Liu, G. Hu and H. Gao, J. Supercrit. Fluids, 2012, 63, 99 CrossRef.
- T. D. Dao and H. M. Jeong, Mater. Res. Bull., 2015, 70, 651 CrossRef.
- Z. J. Fan, W. Kai, J. Yan, T. Wei, L. J. Zhi, J. Feng, Y. Ren, L. P. Song and F. Wei, ACS Nano, 2011, 5, 191 CrossRef PubMed.
- E. Paparazzo, Carbon, 2013, 63, 578 CrossRef.
- Y. Matsumoto, H. Tateishi, M. Koinuma, Y. Kamei, C. Ogata, K. Gezuhara, K. Hatakeyama, S. Hayami, T. Taniguchi and A. Funatsu, J. Electroanal. Chem., 2013, 704, 233 CrossRef.
| This journal is © The Royal Society of Chemistry 2017 |

