 Open Access Article
Creative Commons Attribution 3.0 Unported Licence
Na intercalation in Fe-MIL-100 for aqueous Na-ion batteries†
James S. Chavez,
Katharine L. Harrison and
Dorina F. Sava Gallis *
*
Nanoscale Sciences Department, Sandia National Laboratories, Albuquerque, NM 87185, USA. E-mail: dfsava@sandia.gov
First published on 4th May 2017
Abstract
Here we report for the first time the feasibility of using metal–organic frameworks (MOFs) as electrodes for aqueous Na-ion batteries. We show that Fe-MIL-100, a known redox-active MOF, is electrochemically active in a Na aqueous electrolyte, under various compositions. Emphasis was placed on investigating the electrode–electrolyte interface, with a focus on identifying the relationship between additives in the composition of the working electrode, particle size and overall performance. We found that the energy storage capacity is primarily dependent on the binder additive in the composite; the best activity for this MOF is obtained with Nafion as a binder, owing to its hydrophilic and ion conducting nature. Kynar-bound electrodes are clearly less effective, due to their hydrophobic character, which impedes wetting of the electrode. The binder-free systems show the poorest electrochemical activity. There is little difference in the overall performance as function of particle size (micro vs. nano), implying the storage capacities in this study are not limited by ionic and/or electronic conductivity. Excellent reversibility and high coulombic efficiency are achieved at higher potential ranges, observed after cycle 20. That is despite progressive capacity decay observed in the initial cycles. Importantly, structural analyses of cycled working electrodes confirm that the long range crystallinity remains mainly unaltered with cycling. These findings suggest that limited reversibility of the intercalated Na ions in the lower potential range, together with the gradual lack of available active sites in subsequent cycles is responsible for the rapid decay in capacity retention.
Introduction
Viable large-scale energy storage solutions are needed in order for grid operators to implement renewable energy sources in their infrastructure. This would allow for a flexible supply of energy, independent of typical peak consumption profiles. Several energy storage technologies for stationary applications have been developed.1 Of those, compressed air energy storage and electrochemical energy storage have been shown to have the most promising performance to cost ratio.2 In addition to cost, safety, reliability via long cycle life, round-trip energy efficiency and minimal maintenance are also important parameters to consider.1 Based on these requirements, room temperature/aqueous Na-ion batteries (NIB)3,4 are becoming increasingly attractive due to: (i) natural abundance and low production cost for Na; (ii) reduced safety consideration as compared to traditional rechargeable batteries based on flammable organic electrolytes; (iii) high ionic conductivity, associated with high round-trip efficiency and energy density.The vast majority of electrodes for NIB focus on known materials extensively developed for Li-ion batteries. This is primarily due to the fact that Na and Li-ions systems have related chemistries, albeit distinct kinetic and thermodynamic properties.5 Metal oxides and polyanionic type compounds have shown the most promising results to date.3 Although significant advancements have been achieved in recent years,6 there is still a need to implement novel materials with tailorable structures and differentiating reaction mechanisms.7
In this context, metal–organic frameworks (MOFs) are regarded as attractive battery electrode candidates owing their high porosity and tunable framework components. Also, their synthesis typically requires low energy input and relatively inexpensive starting materials. MOFs are three-periodic porous materials constructed from single-metal-ions or metal cluster nodes and organic linkers.8 Traditional applications of MOFs relate to gas storage and separations,9–13 catalysis,14 and luminescence,15–17 to name a few. Over the course of the past few years, the number of studies that focus on electrical conductivity18 and electrochemistry-related applications is steadily increasing; however these reports are still scarce.19–22 In particular, there are no studies that focus on the electrochemistry of MOFs in aqueous systems as battery electrodes. This is despite very encouraging performances achieved with Prussian blue analogues, a related materials class.23–25
Herein, we report for the first time the electrochemical activity of a MOF (Fe-MIL-100)26 as an electrode for aqueous NIB. The material choice was guided by: (i) its robustness in water, a prerequisite that few potentially redox-active MOFs can meet, and (ii) its known electrochemical activity in a variety of organic solvent electrolytes for NIB, as shown by our recent investigations.22 Fe-MIL-100 is constructed from Fe-based trimer building blocks, linked by 1,3,5-benzenetricarboxylate struts to generate an open framework based on mesoporous cages of 25 Å and 29 Å in diameter. The material is redox active via the Fe3+/Fe2+ redox couple.
Traditionally, composite fabrication and particle size are critical parameters to monitor in the performance of battery electrodes.27,28 Here, we focus on identifying the importance of the interface between the electrode and electrolyte in the overall performance of Fe-MIL-100 as an electrode for aqueous NIBs. In particular, the study highlights the role of the binder additives (Nafion, Kynar and binder-free) in the composite's electrochemical activity. In order to assess any conductivity limitations, the performance as function of particle size (micro vs. nanoscale) was also investigated. Finally, to better understand the mechanism for sodium storage, the nature of the charge storage process was interrogated. Detailed electrochemical characterization and structural analyses of the cycled electrodes are included.
Experimental section
All reactant materials were purchased from commercially available sources and used without further purification. Micro-Fe-MIL-100 (iron III 1,3,5-benzenetricarboxylate, hydrate, porous) was purchased under the chemical name of KRICT F100 from Strem Chemicals.Synthesis of nano-Fe-MIL-100
The synthesis was adapted from a previously published method.29 Anhydrous FeCl3 (162.2 mg, 1 mmol), 1,3,5-benzenetricarboxylic acid (140.8 mg, 0.67 mmol), and distilled H2O (5 mL) were added to a 10 mL CEM corporation pressure vial. The reaction mixture was rapidly heated to 130 °C within one min via a CEM discover SP microwave. The pressure vial was kept at this temperature for 5 min and 30 s and subsequently cooled down to 25 °C. The resulting product mixture yielded an ochre powder that was centrifuged at 2000g and washed with distilled water to remove any unreacted reactants. The mixture was then washed four times with EtOH, centrifuging between washes, yielding about 182 mg, 60% yield.Electrochemical characterization
Electrochemical characterization was conducted on a model Parr 263A potentiostat through cyclic voltammograms (CV) and galvanostatic cycling (GC) with potential limitations. Working and counter electrodes were made using BASi® stationary voltammetry electrodes with 6.4 mm outside diameter (OD) and 1.6 mm diameter glassy carbon. All tests were conducted in a three electrode cell with two glassy carbon and one Ag/AgCl reference electrode with 0.05 M NaCl in water as the electrolyte. Fig. S1† details a CV comparison of 0.05 and 5 M salt concentration.Working electrode (WE) preparation method 1
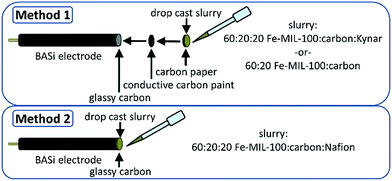
For binder-free and Kynar-bound MOF composites: two glassy carbon electrodes were first cleaned and polished. Carbon paper circles were punched out to fit the OD of the glassy carbon electrodes. One carbon paper circle was pasted on each glassy carbon electrode with conductive carbon paint to maintain an electrical connection to the BASi® electrodes. Kynar containing electrode mixtures were based on 60![[thin space (1/6-em)]](https://www.rsc.org/images/entities/char_2009.gif) :
:![[thin space (1/6-em)]](https://www.rsc.org/images/entities/char_2009.gif) 20
20![[thin space (1/6-em)]](https://www.rsc.org/images/entities/char_2009.gif) :
:![[thin space (1/6-em)]](https://www.rsc.org/images/entities/char_2009.gif) 20 wt% of active material (Fe-MIL-100): sp carbonblack (Alfa Aesar): Kynar Flex 2801 (hexafluoropropylene–vinylidene fluoride copolymer, Arkema). For the binder-free electrodes, that ratio was 60
20 wt% of active material (Fe-MIL-100): sp carbonblack (Alfa Aesar): Kynar Flex 2801 (hexafluoropropylene–vinylidene fluoride copolymer, Arkema). For the binder-free electrodes, that ratio was 60![[thin space (1/6-em)]](https://www.rsc.org/images/entities/char_2009.gif) :
:![[thin space (1/6-em)]](https://www.rsc.org/images/entities/char_2009.gif) 20 wt% active material (Fe-MIL-100): sp carbonblack (Alfa Aesar). 1200 wt% acetone was added to a glass vial, and the slurries were then mixed via stir bar for 24 h at room temperature before use. The mixtures were subsequently drop cast onto the electrodes with carbon paper after allowing time for the carbon paint to dry. Carbon paper was used for all experiments involving slurries because it was found that the carbon paper was a necessary intermediate in the aqueous system in order for the slurry to adhere to the electrodes. The electrodes were then allowed to dry in ambient temperature air.
20 wt% active material (Fe-MIL-100): sp carbonblack (Alfa Aesar). 1200 wt% acetone was added to a glass vial, and the slurries were then mixed via stir bar for 24 h at room temperature before use. The mixtures were subsequently drop cast onto the electrodes with carbon paper after allowing time for the carbon paint to dry. Carbon paper was used for all experiments involving slurries because it was found that the carbon paper was a necessary intermediate in the aqueous system in order for the slurry to adhere to the electrodes. The electrodes were then allowed to dry in ambient temperature air.
Working electrode (WE) preparation method 2
For experiments involving Nafion®, no carbon paper was used due to Nafion's adhesive properties onto the electrodes, while the wt% mixture of active materials to carbon was maintained described above. Fe-MIL-100, sp carbon, and Nafion® (Nafion® perfluorinated resin solution 5 wt% in mixture of lower aliphatic alcohols and water, Sigma-Aldrich) were all mixed in anti-static weigh boats into a homogeneous paste and slathered onto bare polished glassy carbon electrodes for drying. For all experiments, weight was acquired by taring the electrodes and measuring the weight of slurry or paste once adhered to and dried on the electrode. A typical weight of the dried paste is about 1 mg. The two methods of working electrode preparation are depicted in Scheme 1.Counter electrode preparation
Although it is common in aqueous sodium-ion battery literature to test active materials against a sodium-free counter electrode (such as Pt or Zn for example),30 the absence of sodium in the counter electrode leads to side reactions such as metal dissolution/plating and/or electrolyte degradation (H2 and/or O2 evolution). In either case, the composition of the electrolyte is modified by the side reactions at the counter electrode. Indeed, in initial experiments containing the MOF as the working electrode and a Pt counter electrode, bubble formation was evident in the cell. Counter electrodes containing the relevant cation involved in the electrochemical system have been shown to be important for achieving high performance in aqueous batteries.31 Therefore, MOF-based electrodes were first sodiated to be used as counter electrodes in later experiments. The sodiation was achieved in a three electrode cell consisting of MOF-based electrodes prepared by methods 1 and 2 as working electrodes (WEs), Pt counter electrodes, and Ag/AgCl reference electrodes (REs). This procedure was modified from previously published work.25 The sodiation was performed by first purging the system with N2 gas and then running a galvanostatic reduction at a C/2.5 rate with a potential cutoff at −0.1 V vs. Ag/AgCl in 7 mL of 0.05 M NaCl DI water in a 20 mL scintillation vial. A N2 blanket was left flowing during all experiments. The electrochemical data depicting this sodiation step to prepare counter electrodes is presented in Fig. S2.†CV and/or GC experiments
CVs and GCs were conducted using the sodiated counter electrodes described above, Ag/AgCl REs, and WEs consisting of freshly prepared slurry/paste. The counter electrode was intentionally made to be 2–5 times the mass of the WE so that any electrochemical activity within the cell left the CE relatively unaltered. All values are reported against standard hydrogen electrode (SHE).Powder X-ray diffraction (PXRD)
Measurements were performed on a Siemens Kristalloflex D500 diffractometer, Cu Kα radiation (λ = 1.54178 Å).Scanning electron microscopy (SEM)
SEM analyses were captured on a FEI NovaNano SEM 230, at various accelerating voltages between 1 and 20 kV.Transmission electron microscopy (TEM)
TEM images were taken on JEOL 1200EX transmission electron microscope with a maximum acceleration voltage of 120 kV. Prior to TEM measurements, samples were dispersed in absolute ethanol and deposited on a carbon film coated copper grid.Results and discussion
In this study we focused on probing the suitability of MOFs (Fe-based MOF, Fe-MIL-100) as candidate electrodes for aqueous NIB. Specifically, we investigated the effects of electrode composition/binder (Kynar, Nafion and binder-free) as function of particle size (micro- vs. nano-) to better correlate structural features with this material's electrochemical activity in aqueous electrolytes.Particle size characterization of micro- and nano-Fe-MIL-100
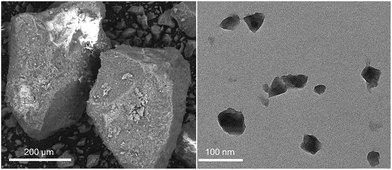
Two different particle sizes of the Fe-MIL-100 material were used in this study, micro- and nano-sized, as seen in Fig. 1a (SEM) and Fig. 1b (TEM), respectively. There is a wide size distribution for the large particles, 25–200 μm, whereas the nanoparticles are more homogeneous, with sizes in the 20–50 nm range.The initially desodiated micro-Fe-MIL-100 is first reduced and then oxidized. The Nafion-bound electrode exhibits larger reduction and oxidation current densities than the other binder systems and has a well-defined oxidation peak at ∼0.55 V and a smaller peak at ∼0.2 V. All curves exhibit strong reductive peaks at ∼0.1 V and shoulders at higher potentials, Fig. 2a. The Kynar-bound and binder-free electrodes share similar characteristics, but exhibit lower current densities. The nano-Fe-MIL-100 CVs generally show similar activity to micro-Fe-MIL-100, Fig. 2b. However, nano-Fe-MIL-100 shows higher peak current densities than micro-Fe-MIL-100 for the Kynar- and Nafion-bound electrodes. In conjunction, the oxidation peaks shift such that they merge closer together for nano-Fe-MIL-100. Also, the binder-free nano-Fe-MIL-100 electrode exhibits lower current density and less distinctive peaks than all other samples.
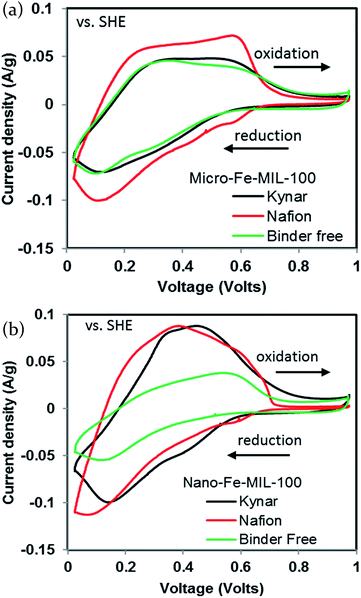 | ||
| Fig. 2 First cycle cyclic voltammograms of (a) micro-Fe-MIL-100 and (b) nano-Fe-MIL-100 at a scan rate of 1 mV s−1 with a 0.05 M NaCl in water electrolyte. | ||
Na storage capacity of Nafion, Kynar and binder-free micro- and nano-Fe-MIL-100 electrodes
The theoretical capacity of Fe-MIL100 is 93 mA h g−1, when considering Fe3+/Fe2+ the electrochemically active redox couple. Fig. 3a and b show the sodium storage capacity over 30 cycles for micro-Fe-MIL-100 and nano-Fe-MIL-100, respectively, cycled at a C/3 rate. All cells exhibit the highest reduction capacities in the first cycles, which drop sharply and reach steady values after ∼10–20 cycles. For the best performing system in this work, Nafion-bound micro-Fe-MIL-100, the first cycle capacity is of 55 mA h g−1, representing ∼60% of the theoretical capacity. Interestingly, this storage capacity is the same as the one measured by us on the same MOF active material, but within a coin cell configuration and using an organic electrolyte.22 We directly compared the voltage profiles of the aqueous and organic electrolytes setups in Fig. S3.† There are several differences between the electrochemical behavior in the two systems. First, the potential where electrochemical activity occurs is higher in the aqueous electrolyte. Second, the electrochemical activity occurs in distinct, flat plateaus in the organic electrolytes but the plateaus slope much more gradually in the aqueous electrolyte. This suggests that different mechanisms might be responsible for the capacity in different electrolytes, including: (i) unique redox sites with different energies; (ii) different Na solvation structures, which may favor access to distinct sites; (iii) distinct intercalation mechanisms.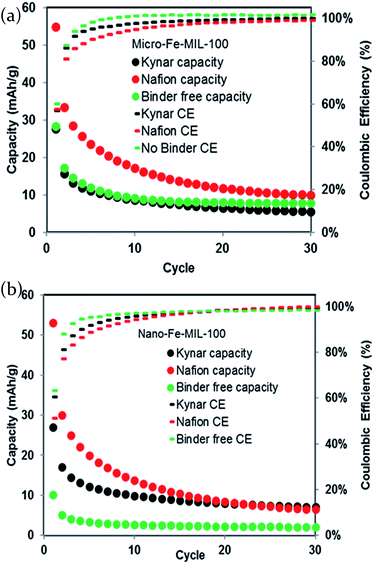 | ||
| Fig. 3 Cycle life (reduction values) and coulombic efficiency of (a) micro-Fe-MIL-100 and (b) nano-Fe-MIL-100 at a C/3 rate in a 0.05 M NaCl/water electrolyte. | ||
A comparison to other MOFs evaluated as electrodes reveals similar results, indicating limitations to the storage of charge in the MOFs studied thus far in the literature.22,32–34 Consistent with the CV data, the micro-Fe-MIL-100 Nafion-bound electrode, shows higher capacity than the Kynar-bound and binder-free electrodes, Fig. 3a. However, by cycle 30, the Nafion-bound electrode shows similar capacity as the other binder systems. Nano-Fe-MIL-100 performed similarly to micro-Fe-MIL-100 despite variations in peak current densities and peak locations evident in the CV, Fig. 3b. Consistent with the CV, the binder-free nano-Fe-MIL-100 exhibited the lowest capacity.
In general, particle size has little effect on the electrochemistry, indicating that the capacity limitations at the rates studied here are not related to the ionic and electronic conductivity limitations that sometimes plague materials with micron-sized particle morphologies.27
The composition of the electrode and in particular, the binder, greatly impacts the capacity in the early cycles of micro- and nano-Fe-MIL-100 alike. For both particle systems studied here, Nafion exhibits the highest charge storage capacity, particularly during the first 10 cycles. The improved performance of the Nafion-bound cells relates to the inherent hydrophilic nature of Nafion, which allows it to be used effectively in other aqueous systems, such as fuel cells35 and in electrocatalytic water splitting.36 Its hydrophilicity likely enhances wetting of the electrode allowing a more favorable interfacial interaction between the electrolyte and composite electrode. Additionally, whereas most binders function to simply hold together a composite electrode, Nafion is an ion transporter and can act as an electrolyte in aqueous systems. Specifically, while Nafion typically transports protons in aqueous systems such as fuel cells, it is also capable of transporting Na ions.37
Conversely, Kynar is a hydrophobic binder, which impedes wetting of the electrode and affects how the ions and water molecules arrange at the interface between the electrolyte and composite electrode. This had a noticeable effect on the performance of the Kynar-bound electrodes, clearly less effective than the Nafion-bound cells.
The binder-free systems show the poorest electrochemical activity. In particular, the binder-free nano-Fe-MIL-100 shows much lower capacity in all cycles than binder-free micro-Fe-MIL-100, as well as all other systems with binder. This is due to the fact that the smaller particle sizes are more difficult to adhere together without binder, as opposed to larger particles. Also, many more particle to particle connections are occurring in this system. In this case, it is likely that some of the active material lacks a low-impedance connection to the current collector. Poor electrical connections and isolation of some particles can lead to lower capacity.
Although the highest capacities are reached in the initial cycles, the coulombic efficiency (CE) exhibits the opposite trend for all binder systems; while starting at 60%, it increases with cycling to near 100% near cycle 20. Here we define CE as the oxidation (desodiation) charge capacity divided by the reduction (sodiation) charge capacity multiplied by 100 to convert to percentage. This effectively indicates the percentage of electrons consumed during sodiation that can be recovered upon desodiation. CE is typically defined this way when beginning with initially desodiated/delithiated materials. Si anodes serve as an example for which CE is defined as discharge capacity (oxidation or delithiation charge) divided by charge capacity (reduction or lithiation charge).38
Ex situ post cycling XRD of Nafion, Kynar and binder-free micro-Fe-MIL-100 electrodes
Powder X-ray diffraction analyses were conducted on all cycled electrodes to assess whether the decline in performance is related to a change in the crystalline structure of Fe-MIL-100. Fig. 4 and S4† show that the structures of micro-Fe-MIL-100 and nano-Fe-MIL-100, respectively, are mainly preserved and do not undergo any drastic structural changes under electrochemical activity. Additionally, no new crystalline or amorphous phases are noted.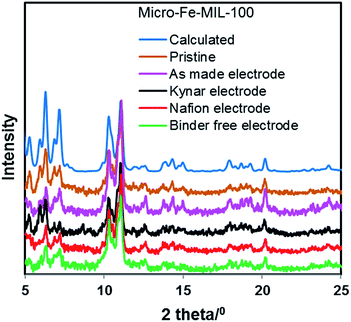 | ||
| Fig. 4 X-ray diffraction data of pristine and cycled micro-Fe-MIL-100 electrodes. All Kynar, Nafion, and Binder-free electrodes were characterized in their desodiated state, after 30 cycles. | ||
Voltage profiles and differential capacity plots for Nafion, Kynar and binder-free micro-Fe-MIL-100 electrodes
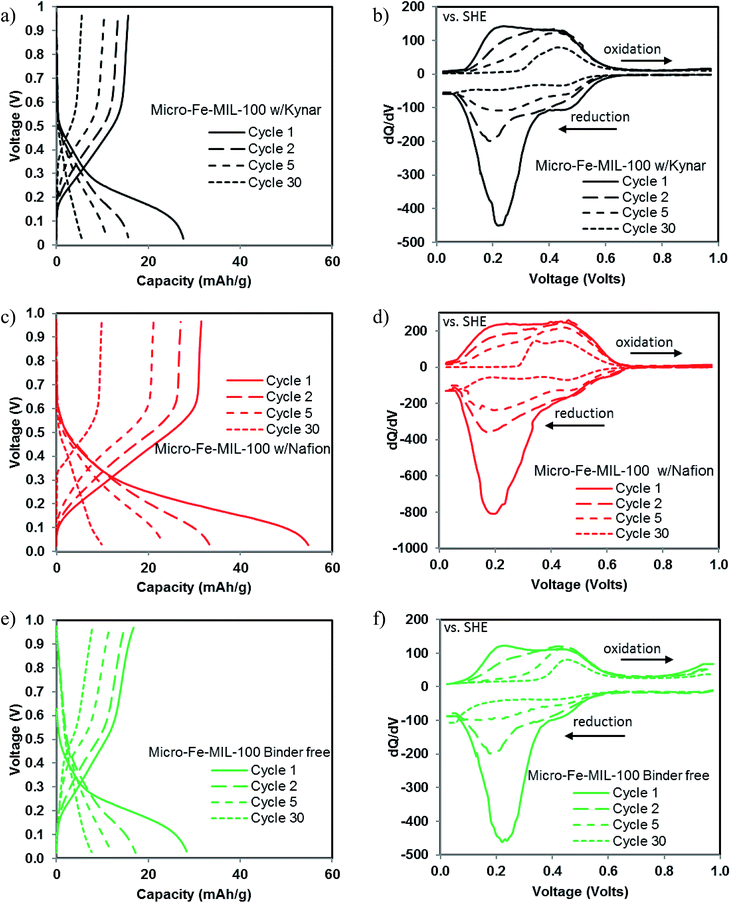
To better understand the cycle life behavior shown in Fig. 3, voltage profiles as functions of capacity and differential capacity (dQ/dV) for all compositions are presented in Fig. 5 for 1st, 2nd, 5th, and 30th cycle. Consistent with the CV data, the first cycle data shows that the bulk of the capacity during both reduction and oxidation occurs between ∼0.1 and ∼0.6 V. Highly sloping capacity plateaus are expected based on the wide CV peaks, rather than the flat plateaus that normally relate with sharp peaks. The sloping plateaus largely exhibit capacity between ∼0.1 and ∼0.3 V during first cycle reduction, consistent with the largest reduction peaks shown in the CV. We refer to capacity in this potential range as the lower potential capacity. Differences in reduction capacity between the various binder systems are largely associated with differences in capacity given by this lower potential capacity of the sloping plateau. A smaller amount of reduction capacity relates with reduction potentials between ∼0.3 and ∼0.6 V, which we refer to as the higher potential capacity. dQ/dV data is also consistent with the CV data for the first cycle; large reduction peaks are linked with lower potential capacity and smaller peaks are correlated with the higher potential capacity.Upon oxidation, the capacity curves do not mirror the reduction curves during the first cycle, but rather slope almost linearly from 0.1 V to 0.6 V with reduced capacity. Again, this is consistent with the CV and the dQ/dV plots for the first cycle in which the lower potential peaks are smaller during oxidation than during reduction and the oxidation peaks in general are less distinct than during reduction. The higher potential oxidation and reduction peaks in the dQ/dV data are more comparable in magnitude than the lower potential oxidation peaks.
During cycles 2, 5 and 30, the lower potential sloping plateau and the related reduction peaks in the dQ/dV data decrease greatly in magnitude. This decrease is accompanied by an increase in the CE but a decrease in overall capacity, Fig. 3. The higher potential capacity remains more consistent with cycling as compared to the lower potential capacity. Also, the magnitudes of the oxidation and reduction peaks are similar in the high potential capacity regime. The corresponding data for the nano-Fe-MIL-100 in Fig. S5† show very similar behavior as micro-Fe-MIL-100.
The enhanced capacity in the first cycles is largely associated with the lower potential sloping plateau shown in Fig. 5 and the lower potential peaks shown in the CV and dQ/dV, Fig. 2 and 5. With cycling, the low potential electrochemical activity is greatly reduced and the Nafion-bound system becomes more comparable to the other systems. All binder systems exhibit significant capacity fade with cycling and the binder is shown to have little effect by the 30th cycle.
Large irreversible capacity loss is evident in the early cycles, corresponding to low CE. The same phenomenon is frequently encountered in organic electrolyte systems and is often attributed to electrolyte breakdown with concomitant formation of a solid electrolyte interphase (SEI) in early cycles. However, in aqueous electrolytes, the breakdown products are gases (H2 and O2) rather than solid carbonaceous materials. Barring reaction of the active electrode material with water, H2, O2, or the electrolyte salt, irreversible capacity loss in early cycles is generally not attributed to SEI formation in aqueous electrolytes.4,39 Because SEI is likely not the cause of the large irreversible capacity loss, further examination of the electrochemical data is warranted to understand the trends in CE.
Interestingly, the system shows low CE in early cycles when the capacity is the highest, while the trend is reversed in later cycles, in particular after the 20th cycle. Examination of the multiple peaks in the CV, Fig. 2, and differential capacity plots, Fig. 5, also helps explain the trends in the cycle life and CE data. Although the first cycle in this system shows the highest initial capacity, the CE is only 60%, indicating that the first cycle is not entirely reversible, Fig. 3. Contrastingly, coinciding with the rapid capacity fade is an increase in CE to nearly 100% after 20 cycles, when the capacity stabilizes. Close examination of Fig. 2 and 5 reveal that the irreversibility in the system is largely connected with the lower potential sloping plateau capacity and the large lower potential peaks in the CV. The oxidation peaks associated with the lower potential reduction peaks are much smaller in magnitude than the reduction peaks. In contrast, the higher potential reduction peaks in the CV and dQ/dV plots are typically similar in magnitude to oxidation peaks in higher potential range. Furthermore, with greater numbers of cycles, the lower potential sloping plateau disappears (along with the corresponding peaks in the CV and dQ/dV plots) and the higher potential capacity dominates. Thus, the higher potential capacity is coupled with high CE. It is likely that the Na intercalation which occurs in the lower potential range is not very reversible, while the Na intercalation in the higher potential range is reversible. This difference in reversibility may be linked to the high and low potential activity being related to intercalation into different sites.
CV analysis at variable scan rates for Nafion micro-Fe-MIL-100 electrode
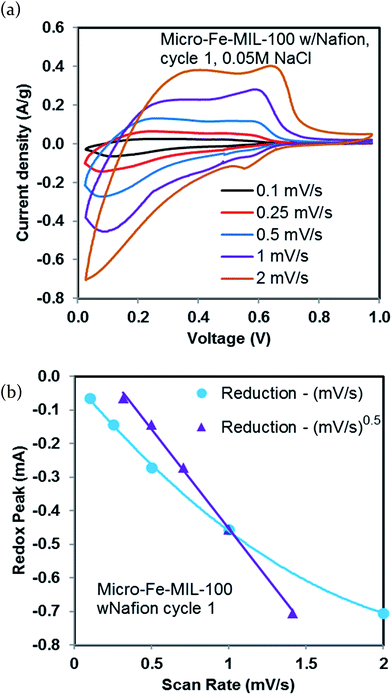
In order to better understand the mechanism for sodium storage in the best performing system (micro-Fe-MIL-100 with Nafion binder), we undertook a CV analysis at various scan rates (0.1, 0.25, 0.5, 1, and 2 mV s−1), Fig. 6a. The square root dependence of peak potential on scan rate shown in Fig. 6b indicates that charge storage is faradaic in nature and likely is associated with an intercalation process, as previously shown with other intercalation-based battery electrodes.4,40 The corresponding plot for the oxidation peaks exhibits the same trend, Fig. S6.†The complexity of the structure correlates with multiple possible Fe active sites where the Na intercalated species can be stored, as previously suggested by other studies.22,34 It is possible that some of these sites are not accessible to Na ions or not accessible to the electrons needed to undergo oxidation and reduction of the Fe species. Further evidence of multiple sites arises from the multiple broad peaks in the CV, Fig. 2, and changes in slope for the capacity in the GC data, Fig. 5. The changes in slope and multiple peaks suggest that there is a range of energies associated with Na+ intercalation.
There are several potential reasons for irreversibility in these systems. It is possible that Na is intercalated into several sites with different energies and only some of the sites have favorable energetics for the Na to deintercalate upon oxidation. Thus, with cycling, fewer Na ions can be intercalated into those sites because many are still occupied from the previous cycle. This trapping of Na could also explain the low CE in the early cycles. Additionally, even though the counter electrode is larger in mass than the working electrode, it also likely undergoes this process slowly over its cycling life, making the electrochemical cell overall less efficient. It is also foreseeable that within a larger voltage window, these Na ions could be deintercalated. However, the voltage window studied here was limited to prevent electrolyte breakdown.
Conclusions
In conclusion, this study has revealed that the electrode–electrolyte interface plays a critical role in the overall performance of the systems described herein. We have shown for the first time that Nafion may serve as an effective binder for MOF-based aqueous NIB, due to its hydrophilic nature and ion transporting properties. Alternatively, the Kynar bound electrodes were found to be less effective, because of its hydrophobicity, which hinders wetting of the electrode. The binder-free systems had the least favorable electrochemical activity, likely correlated with a poor electrical connection to the current collector. Interestingly, particle size plays only a minor role in the electrochemistry of Fe-MIL-100 in aqueous electrolytes.However, all cells experienced capacity degradation with progressive cycling. As the integrity of the active material was mainly preserved throughout cycling, the inability to reversibly access active sites for Na intercalation is likely the reason for the decay in performance. This may be a result of favourable energetics between Na and framework, which translates into a partially reversible intercalation-deintercalation process.
The findings of this work are important, as they provide useful information needed for the design of more efficient MOF-based electrode materials. Future work is focused on using presodiated MOFs, with different structural features, including but not limited to, pore size and type of redox-active metal-cluster building block.
Acknowledgements
The authors would like to acknowledge Travis Anderson and Harry Pratt for helpful discussions, as well as Charles Pearce and David Rademacher for help with the TEM and SEM imaging. This work is supported by the Laboratory Directed Research and Development Program at Sandia National Laboratories. Sandia National Laboratories is a multi-mission lab managed and operated by Sandia Corp., a wholly owned subsidiary of Lockheed Martin Corporation, for the US DOE's NNSA under contract DE-AC04-94AL85000.References
- Z. Yang, J. Zhang, M. C. W. Kintner-Meyer, X. Lu, D. Choi, J. P. Lemmon and J. Liu, Chem. Rev., 2011, 111, 3577–3613 CrossRef CAS PubMed.
- C. J. Barnhart and S. M. Benson, Energy Environ. Sci., 2013, 6, 1083–1092 CAS.
- H. Pan, Y.-S. Hu and L. Chen, Energy Environ. Sci., 2013, 6, 2338–2360 CAS.
- H. Kim, J. Hong, K.-Y. Park, H. Kim, S.-W. Kim and K. Kang, Chem. Rev., 2014, 114, 11788–11827 CrossRef CAS PubMed.
- S. Y. Hong, Y. Kim, Y. Park, A. Choi, N.-S. Choi and K. T. Lee, Energy Environ. Sci., 2013, 6, 2067–2081 CAS.
- X. Xiang, K. Zhang and J. Chen, Adv. Mater., 2015, 27, 5343–5364 CrossRef CAS PubMed.
- C. Fang, Y. Huang, W. Zhang, J. Han, Z. Deng, Y. Cao and H. Yang, Adv. Energy Mater., 2016, 6, 1501727 CrossRef.
- S. R. Batten, N. R. Champness, X.-M. Chen, J. Garcia-Martinez, S. Kitagawa, L. Öhrström, M. O'Keeffe, M. Paik Suh and J. Reedijk, Pure Appl. Chem., 2013, 85, 1715–1724 CrossRef CAS.
- B. Li, H.-M. Wen, W. Zhou and B. Chen, J. Phys. Chem. Lett., 2014, 5, 3468–3479 CrossRef CAS PubMed.
- M. Eddaoudi, D. F. Sava, J. F. Eubank, K. Adil and V. Guillerm, Chem. Soc. Rev., 2015, 44, 228–249 RSC.
- D. F. Sava, M. A. Rodriguez, K. W. Chapman, P. J. Chupas, J. A. Greathouse, P. S. Crozier and T. M. Nenoff, J. Am. Chem. Soc., 2011, 133, 12398–12401 CrossRef CAS PubMed.
- D. F. Sava Gallis, M. V. Parkes, J. A. Greathouse, X. Zhang and T. M. Nenoff, Chem. Mater., 2015, 27, 2018–2025 CrossRef CAS.
- D. F. Sava Gallis, K. W. Chapman, M. A. Rodriguez, J. A. Greathouse, M. V. Parkes and T. M. Nenoff, Chem. Mater., 2016, 28(10), 3327–3336 CrossRef CAS.
- J. Lee, O. K. Farha, J. Roberts, K. A. Scheidt, S. T. Nguyen and J. T. Hupp, Chem. Soc. Rev., 2009, 38, 1450–1459 RSC.
- Y. Cui, Y. Yue, G. Qian and B. Chen, Chem. Rev., 2012, 112, 1126–1162 CrossRef CAS PubMed.
- D. F. Sava, L. E. S. Rohwer, M. A. Rodriguez and T. M. Nenoff, J. Am. Chem. Soc., 2012, 134, 3983–3986 CrossRef CAS PubMed.
- D. F. Sava Gallis, L. E. S. Rohwer, M. A. Rodriguez and T. M. Nenoff, Chem. Mater., 2014, 26, 2943–2951 CrossRef CAS.
- L. Sun, M. G. Campbell and M. Dincă, Angew. Chem., Int. Ed., 2016, 55, 3566–3579 CrossRef CAS PubMed.
- S.-L. Li and Q. Xu, Energy Environ. Sci., 2013, 6, 1656–1683 CAS.
- L. Wang, Y. Han, X. Feng, J. Zhou, P. Qi and B. Wang, Coord. Chem. Rev., 2016, 307(2), 361–381 CrossRef CAS.
- A. Morozan and F. Jaouen, Energy Environ. Sci., 2012, 5, 9269–9290 CAS.
- D. F. Sava Gallis, H. D. Pratt III, T. M. Anderson and K. W. Chapman, J. Mater. Chem. A, 2016, 4, 13764–13770 CAS.
- J. Song, L. Wang, Y. Lu, J. Liu, B. Guo, P. Xiao, J.-J. Lee, X.-Q. Yang, G. Henkelman and J. B. Goodenough, J. Am. Chem. Soc., 2015, 137, 2658–2664 CrossRef CAS PubMed.
- C. D. Wessells, R. A. Huggins and Y. Cui, Nat. Commun., 2011, 2, 550 CrossRef PubMed.
- C. D. Wessells, S. V. Peddada, R. A. Huggins and Y. Cui, Nano Lett., 2011, 11, 5421–5425 CrossRef CAS PubMed.
- P. Horcajada, S. Surble, C. Serre, D.-Y. Hong, Y.-K. Seo, J.-S. Chang, J.-M. Greneche, I. Margiolaki and G. Ferey, Chem. Commun., 2007, 27, 2820–2822 RSC.
- Y. Wang, H. Li, P. He, E. Hosono and H. Zhou, Nanoscale, 2010, 2, 1294–1305 RSC.
- A. Magasinski, B. Zdyrko, I. Kovalenko, B. Hertzberg, R. Burtovyy, C. F. Huebner, T. F. Fuller, I. Luzinov and G. Yushin, ACS Appl. Mater. Interfaces, 2010, 2, 3004–3010 CAS.
- A. García Márquez, A. Demessence, A. E. Platero-Prats, D. Heurtaux, P. Horcajada, C. Serre, J.-S. Chang, G. Férey, V. A. de la Peña-O'Shea, C. Boissière, D. Grosso and C. Sanchez, Eur. J. Inorg. Chem., 2012, 32, 5165–5174 CrossRef.
- S. I. Park, I. Gocheva, S. Okada and J.-i. Yamaki, J. Electrochem. Soc., 2011, 158, A1067–A1070 CrossRef CAS.
- R. Ruffo, C. Wessells, R. A. Huggins and Y. Cui, Electrochem. Commun., 2009, 11, 247–249 CrossRef CAS.
- G. Férey, F. Millange, M. Morcrette, C. Serre, M.-L. Doublet, J.-M. Grenèche and J.-M. Tarascon, Angew. Chem., Int. Ed., 2007, 46, 3259–3263 CrossRef PubMed.
- A. Fateeva, P. Horcajada, T. Devic, C. Serre, J. Marrot, J.-M. Grenèche, M. Morcrette, J.-M. Tarascon, G. Maurin and G. Férey, Eur. J. Inorg. Chem., 2010, 24, 3789–3794 CrossRef.
- J. Shin, M. Kim, J. Cirera, S. Chen, G. J. Halder, T. A. Yersak, F. Paesani, S. M. Cohen and Y. S. Meng, J. Mater. Chem. A, 2015, 3, 4738–4744 CAS.
- K. Broka and P. Ekdunge, J. Appl. Electrochem., 1997, 27, 117–123 CrossRef CAS.
- K. Meyer, M. Ranocchiari and J. A. van Bokhoven, Energy Environ. Sci., 2015, 8, 1923–1937 CAS.
- H. L. Yeager, B. Kipling and R. L. Dotson, J. Electrochem. Soc., 1980, 127, 303–307 CrossRef CAS.
- C. K. Chan, H. Peng, G. Liu, K. McIlwrath, X. F. Zhang, R. A. Huggins and Y. Cui, Nat. Nanotechnol., 2008, 3, 31–35 CrossRef CAS PubMed.
- Y. Wang, J. Yi and Y. Xia, Adv. Energy Mater., 2012, 2, 830–840 CrossRef CAS.
- S. Ren, R. Chen, E. Maawad, O. Dolotko, A. A. Guda, V. Shapovalov, D. Wang, H. Hahn and M. Fichtner, Adv. Sci., 2015, 2, 1500128 CrossRef PubMed.
Footnote |
| † Electronic supplementary information (ESI) available: XRD, FT-IR and additional electrochemical characterization results. See DOI: 10.1039/c7ra01629h |
| This journal is © The Royal Society of Chemistry 2017 |

