 Open Access Article
A single colorimetric sensor for multiple targets: the sequential detection of Co2+ and cyanide and the selective detection of Cu2+ in aqueous solution†
Hyo Jung Jang,
Tae Geun Jo and
Cheal Kim *
*
Department of Fine Chemistry and Department of Interdisciplinary Bio IT Materials, Seoul National University of Science and Technology, Seoul 139-743, Korea. E-mail: chealkim@seoultech.ac.kr; Fax: +82-2-973-9149; Tel: +82-2-970-6693
First published on 22nd March 2017
Abstract
A new highly selective and multifunctional chemosensor 1 for the detection of Co2+, Cu2+ and CN−, based on 4-diethylaminosalicyl aldehyde and thiophene-2-carbohydrazide moieties, was designed and synthesized. 1 could simultaneously detect both Co2+ and Cu2+ by changing its color from colorless to yellow in aqueous solution. The binding modes of 1 to Co2+ and Cu2+ were determined to be a 2![[thin space (1/6-em)]](https://www.rsc.org/images/entities/char_2009.gif) :
:![[thin space (1/6-em)]](https://www.rsc.org/images/entities/char_2009.gif) 1 complexation stoichiometry through job plot and ESI-mass spectrometry analysis. The detection limits (0.19 μM and 0.13 μM) of 1 for Co2+ and Cu2+ were lower than the DEP guideline (1.7 μM) of Co2+ and the WHO guideline (31.5 μM) of Cu2+ for drinking water. Importantly, 1 could detect and quantify Co2+ and Cu2+ in real water samples. Moreover, the resulting Co2+-2·1 complex sensed cyanide through naked-eye, showing recovery from Co2+-2·1 to 1. The sensing mechanisms of Cu2+ by 1 were explained by theoretical calculations.
1 complexation stoichiometry through job plot and ESI-mass spectrometry analysis. The detection limits (0.19 μM and 0.13 μM) of 1 for Co2+ and Cu2+ were lower than the DEP guideline (1.7 μM) of Co2+ and the WHO guideline (31.5 μM) of Cu2+ for drinking water. Importantly, 1 could detect and quantify Co2+ and Cu2+ in real water samples. Moreover, the resulting Co2+-2·1 complex sensed cyanide through naked-eye, showing recovery from Co2+-2·1 to 1. The sensing mechanisms of Cu2+ by 1 were explained by theoretical calculations.
1. Introduction
The development of colorimetric chemosensors for detecting metal ions has received considerable interest in chemical, environmental and biological areas.1–6 Cobalt is an important trace element found in rocks, minerals, soils and seawater, and plays a critical role in biological systems.7–11 It is well known that Co2+ is an important component of vitamin B12 and other biological compounds, and also plays a critical role in the metabolism of iron and the synthesis of hemoglobin.12–14 However, exposure to high levels of cobalt can lead to toxicological effects, including heart disease, thyroid enlargement, asthma, decreased cardiac output, lung disease, dermatitis and vasodilation.15–22 For these reasons, a highly selective and sensitive determination of trace amounts of Co2+ is necessary in biological and environmental systems.Copper is the third most abundant metal in the human body.23–26 It functions as a significant cofactor in the process of superoxide dismutase, cytochrome c oxidase and tyrosinase.27,28 However, excess intake of Cu2+ can trigger adverse health effects such as Alzheimer's, Menke's, Parkinson's and Wilson's diseases.29–31 The World Health Organization (WHO) has recommended the maximum limit of copper in drinking water at 2 ppm (31.5 μM).32,33 Therefore, much effort has been devoted to the development of various chemosensors for Cu2+ detection.34–40
Cyanide has received attention, because it is known as one of the most rapidly acting and strong poisons. The toxicity is caused by its propensity to bind to the iron in cytochrome c oxidase, interfering with electron transport and resulting in hypoxia.41–44 In spite of the toxicity, cyanide has been required in diverse industrial processes such as raw materials for synthetic fibers, resins, herbicides, and the gold-extraction process.45–48 For these reasons, the development of chemosensors for the recognition and detection of cyanide has also received considerable attention.
Many analytical methods for the detection of Co2+, Cu2+, and CN− have been developed such as atomic absorption-emission spectrometry, inductively coupled plasma atomic emission spectroscopy and electrochemical methods. However, the methods demand expensive equipment, highly trained operators and complicated pre-treatment for routine monitoring and application.49 On the contrary to these analytic methods, colorimetric methods have the several merits such as low cost, high sensitivity, and easy monitoring of the target ions.50
Herein, we report on the synthesis and sensing properties of a new thiophene-2-carbohydrazide based chemosensor 1. The chemosensor 1 could simultaneously detect both Co2+ and Cu2+ ions via color changes from colorless to yellow in aqueous solution. In addition, the in situ formed Co2+-2·1 complex exhibited highly selective recognition of CN− through a color change from yellow to colorless in aqueous solution. The sensing mechanisms of 1 toward Co2+, Cu2+, and CN− were explained by using various analytical methods.
2. Experimental
2.1. Materials and equipment
All the solvents and reagents (analytical and spectroscopic grade) were purchased from Sigma-Aldrich. Absorption spectra were recorded at room temperature using a Perkin Elmer model Lambda 25 UV/vis spectrometer. 1H and 13C NMR spectra were recorded on a Varian 400 MHz and 100 MHz spectrometer and chemical shifts (δ) were recorded in ppm. Electro spray ionization mass spectra (ESI-MS) were collected on a Thermo Finnigan (San Jose, CA, USA) LCQ™ Advantage MAX quadrupole ion trap instrument by infusing samples directly into the source using a manual method. Spray voltage was set at 4.2 kV, and the capillary temperature was at 80 °C. Elemental analysis for carbon, nitrogen, and hydrogen was carried out using a Flash EA 1112 elemental analyzer (thermo) at the Organic Chemistry Research Center of Sogang University, Korea.2.2. Synthesis of sensor 1
A solution of thiophene-2-carbohydrazide (0.145 g, 1 mmol) was added to quinolone-2-carboxaldehyde (0.19 g, 1.2 mmol) in ethanol (5 mL). The reaction solution was stirred for 12 h at room temperature. A white precipitate formed was filtered, washed several times with methanol and diethyl ether, and dried in vacuum to afford the pure white solid. Yield 0.24 g (85%); 1H NMR (400 MHz DMSO-d6, ppm): δ 12.17 (s, 1H), 8.59 (s, 1H), 8.44 (d, J = 8 Hz, 1H), 8.31 (s, 1H), 8.20 (s, 1H), 8.09 (s, 1H), 8.02 (m, J = 24 Hz, 3H), 7.79 (t, J = 16 Hz, 1H), 7.63 (t, J = 12 Hz, 1H), 7.25 (t, J = 8 Hz, 1H); 13C NMR (100 MHz, DMSO-d6, 25 °C): δ = 152.56, 149.86, 142.08, 140.39, 137.69, 135.36, 134.74, 134.11, 133.22, 132.59, 122.72. ESI-MS: m/z [1 + H+]+ calcd 282.07, found, 282.00.2.3. UV-vis titration measurements of Co2+ and Cu2+
Sensor 1 (0.16 mg, 0.001 mmol) was dissolved in dimethyl sulfoxide (DMSO, 1 mL) and 60 μL of this solution (1 mM) was diluted with 2.94 mL of bis–tris buffer/DMSO (95/5, 10 mM bis–tris, pH = 7.0) to make the final concentration of 20 μM. Co(NO3)2·6H2O (1.45 mg, 0.005 mmol) was dissolved in bis–tris buffer (1 mL) and 0.6–2.25 μL of this Co2+ solutions (5 mM) were transferred to the sensor 1 solution (20 μM) prepared above. After mixing them for a few seconds, UV-vis spectra were taken at room temperature. The same experimental procedures were also carried out for Cu2+ ion.2.4. Job plot measurements of Co2+ and Cu2+
Sensor 1 (0.16 mg, 0.001 mmol) was dissolved in DMSO (1 mL) and 600 μL of the sensor 1 (1 mM) was diluted to 39.4 mL bis–tris buffer/DMSO (95/5, v/v) solution to make to final concentration of 20 μM. 2.7, 2.4, 2.1, 1.8, 1.2, 0.9, 0.6 and 0.3 mL of the sensor 1 solution were taken and transferred to quartz cells. 40 μL of the Co2+ solution (20 mM) was diluted to 39.6 mL buffer/DMSO (95/5, v/v) solution. 0.3, 0.6, 0.9, 1.2, 1.5, 1.8, 2.1, 2.4 and 2.7 mL of the Co2+ solution were transferred to each sensor 1 solution. Each cell had a total volume of 3 mL. After mixing them for a few seconds, UV-vis spectra were taken at room temperature. The same experimental procedures were also carried out for Cu2+ ion.2.5. Competition experiments of Co2+ and Cu2+
Sensor 1 (0.16 mg, 0.001 mmol) was dissolved in DMSO (1 mL) and 60 μL of this solution (1 mM) was diluted with 2.94 mL of bis–tris buffer/DMSO (95/5, v/v) to make the final concentration of 20 μM. MNO3 (M = Na, K, Ag, 0.02 mmol) or M(NO3)2 (M = Mn, Fe, Co, Ni, Cu, Zn, Cd, Hg, Mg, Ca, Pb, 0.02 mmol) or M(NO3)3 (M = Fe, Cr, Al, Ga, In, 0.02 mmol) were separately dissolved in bis–tris buffer (1 mL). 2.25 μL of each metal-ion solution (20 mM) was taken and added to 3 mL of the solution of sensor 1 (20 μM) to give 7.5 equiv. Then, 2.25 μL of Co2+ solution (20 mM) was added into the mixed solution of each metal ion and 1 to make 7.5 equiv. After mixing them for a few seconds, UV-vis spectra were taken at room temperature. The same experimental procedures were also carried out for Cu2+ ion.2.6. pH effect tests of Co2+ and Cu2+
A series of solutions with pH values ranging from 2 to 12 were prepared by mixing sodium hydroxide solution and hydrochloric acid. After the solution with a desired pH was achieved, sensor 1 (0.16 mg, 0.001 mmol) was dissolved in DMSO (1 mL), and then 60 μL of the sensor (1 mM) was diluted with 2.94 mL of bis–tris buffer/DMSO (95/5, v/v) to make the final concentration of 20 μM. Co(NO3)2·6H2O (5.82 mg, 0.02 mmol) was dissolved in bis–tris buffer (1 mL). 2.25 μL of the Co2+ solution (20 mM) was transferred to each sensor solution (20 μM) prepared above. After mixing them for a few seconds, UV-vis spectra were taken at room temperature. The same experimental procedures were also carried out for Cu2+ ion.2.7. Determination of Co2+ and Cu2+ in water samples
UV-vis spectral measurements of water samples containing Cu2+ were carried by adding 60 μL solution of the sensor 1 (1 mM) and 0.3 mL of 100 mM bis–tris buffer stock solution to 2.64 mL sample solutions. After mixing them for a few seconds, UV-vis spectra were taken at room temperature. The same experimental procedures were also carried out for Cu2+ ion.2.8. Theoretical calculations
All theoretical calculations were performed by using Gaussian 03 program.51 The molecular geometries were optimized by the Density Functional Theory (DFT) calculations based on the hybrid exchange-correlation functional B3LYP.52,53 The 6-31G** basis set54,55 was used for the main group (C, H, O and N) and the Lanl2DZ effective core potential (ECP)56,57 was considered for Cu2+. The vibrational frequency calculations were carried out. There was no imaginary frequency for the optimized geometries of 1 and Cu2+-2·1, indicating that these structures were local energy minima. For all calculations, the solvent effect of water was considered by using the Cossi and Barone's CPCM (conductor-like polarizable continuum model).58,59 The twenty lowest singlet states were calculated by using Time-Dependent Density Functional Theory (TD/DFT). The GaussSum 2.1 (ref. 60) was used to calculate the contributions of molecular orbitals in electronic transition.2.9. UV-vis titration measurements of Co2+-2·1 with CN−
Sensor 1 (0.16 mg, 0.001 mmol) was dissolved in DMSO (1 mL) and 60 μL of this solution (1 mM) was diluted with 2.94 mL of bis–tris buffer/DMSO (95/5, 10 mM bis–tris, pH = 7.0) to make the final concentration of 20 μM. 2.25 μL of Co2+ solution (20 mM) was transferred to each sensor solution (20 μM) to give 0.75 equiv. Then, tetraethylammonium cyanide (16.56 mg, 0.1 mmol) was dissolved in bis–tris (100 mM, 1 mL) and 1.8–19.8 μL of this CN− solutions (100 mM) were transferred to Co2+-2·1 solution (20 μM) to give 33 equiv. After mixing them for a few seconds, UV-vis spectra were taken at room temperature.2.10. Job plot measurements of Co2+-2·1 with CN−
Sensor 1 (0.16 mg, 0.001 mmol) was dissolved in DSMO (1 mL) and 600 μL of the sensor 1 (1 mM) were diluted to 39.4 mL bis–tris buffer/DMSO (95/5, v/v) solution to make the final concentration of 20 μM. Co(NO3)2·6H2O (5.94 mg, 0.02 mmol) was dissolved in bis–tris buffer (5 mL) and 40 μL of this Co2+ solution (20 mM) was transferred to the sensor solution (20 μM) to make Co2+-2·1 complex. 2.7, 2.4, 2.1, 1.8, 1.2, 0.9, 0.6 and 0.3 mL of the Co2+-2·1 solution were taken and transferred to quartz cells. Tetraethylammonium cyanide (16.56 mg, 0.1 mmol) was dissolved in bis–tris (100 mM, 1 mL). 8 μL of the cyanide solution (100 mM) was diluted to 39.992 mL bis–tris buffer solution. 0.3, 0.6, 0.9, 1.2, 1.5, 1.8, 2.1, 2.4 and 2.7 mL of the diluted cyanide solution were transferred to each Co2+-2·1 solution. Each cell had a total volume of 3 mL. After mixing them for a few seconds, UV-vis spectra were taken at room temperature.2.11. Competition of Co2+-2·1 toward various anions
Sensor 1 (0.16 mg, 0.001 mmol) was dissolved in DMSO (1 mL) and 60 μL of this solution (1 mM) was diluted with 2.94 mL of bis–tris buffer/DMSO (95/5, v/v) to make the final concentration of 20 μM. Co(NO3)2·6H2O (5.94 mg, 0.02 mmol) was dissolved in bis–tris buffer (1 mL). 2.25 μL of this Co2+ solution (20 mM) was transferred to the 1 solution (20 μM) to make Co2+-2·1 complex. Then, tetraethylammonium salts of F−, Cl−, Br− and I−, and tetrabutylammonium salts of OAc−, H2PO4−, N3−, SCN− and BzO− (0.1 mmol), and sodium salts of S2− (0.1 mmol) were separately dissolved in bis–tris buffer (1 mL). 18 μL of each anion solution (100 mM) was taken and added into each Co2+-2·1 complex solution prepared above to make 30 equiv. Then, 18 μL of the tetraethylammonium cyanide solution (100 mM) was added into the mixed solution of each anion and Co2+-2·1 complex to make 30 equiv. After mixing them for a few seconds, UV-vis spectra were taken at room temperature.2.12. pH effect test of Co2+-2·1 with CN−
A series of solutions with pH values ranging from 2 to 12 were prepared by mixing sodium hydroxide solution and hydrochloric acid. After the solution with a desired pH was achieved, 60 μL of the 1 solution (1 mM) and 2.25 μL of the Co(NO3)2 solution (20 mM) were dissolved in bis–tris buffer/DMSO (95/5, v/v, pH 2–12), respectively. Then, 18 μL of tetraethylammonium cyanide solution (100 mM) was transferred to Co2+-2·1 complex solution prepared above. After mixing them for a few seconds, UV-vis spectra were taken at room temperature.3. Results and discussion
Sensor 1 was obtained by the combination of thiophene-2-carbohydrazide and quinolone-2-carboxaldehyde with 85% yield in ethanol (Scheme 1), and characterized by 1H NMR and 13C NMR, ESI-mass spectrometry, and elemental analysis.3.1. Absorption spectroscopic studies of 1 toward Co2+ and Cu2+
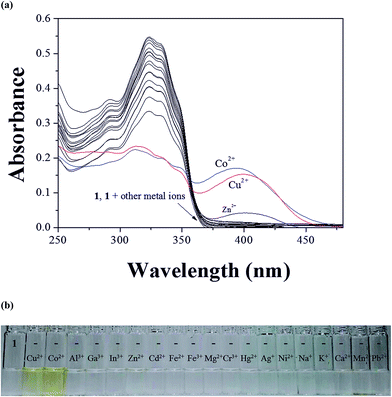
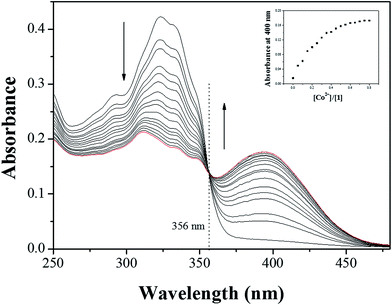
The colorimetric selectivity of sensor 1 toward various metal ions was conducted in bis–tris buffer/DMSO (95/5, v/v, pH = 7) (Fig. 1a). When 0.75 equiv. of various metal ions such as Al3+, Ga3+, In3+, Zn2+, Cd2+, Cu2+, Fe2+, Fe3+, Mg2+, Cr3+, Hg2+, Ag+, Co2+, Ni2+, Na+, K+, Ca2+, Mn2+ and Pb2+ were added to 1, only both Co2+ and Cu2+ showed distinct spectral changes at 400 nm and instant color changes from colorless to yellow, while other metal ions did not show any change in absorbance spectrum and color (Fig. 1b). These results suggested that the sensor 1 could be used as a “naked-eye” chemosensor for Co2+ and Cu2+ in aqueous media.First of all, we conducted the UV-vis titration to examine the concentration-dependent signaling of 1 toward Co2+ (Fig. 2). On the gradual addition of Co2+ to a solution of 1, the absorption band at 325 nm significantly decreased, and a new band at 400 nm gradually reached a maximum at 0.75 equiv. of Co2+. A clear isosbestic point was observed at 356 nm, indicating that only one product was generated from 1 upon binding to Co2+. The peak at 400 nm with the high molar extinction coefficient, 8.65 × 10³ M−1 cm−1, is too large to be Co-based d–d transitions according to the literatures.61–63 Therefore, the new peak might be attributed to a ligand-to-metal charge-transfer (LMCT).
The binding mode between 1 and Co2+ was determined through job plot analysis (Fig. S1†),64 which displayed a 2![[thin space (1/6-em)]](https://www.rsc.org/images/entities/char_2009.gif) :
:![[thin space (1/6-em)]](https://www.rsc.org/images/entities/char_2009.gif) 1 stoichiometry. To further confirm the binding mode of Co2+-2·1 complex, ESI-mass spectrometry analysis was carried out (Fig. 3). The positive-ion mass spectrum showed that the peak at m/z = 620.00 was assignable to [2·1 + Co2+ − H]+ [calcd 620.05]. Based on job plot and ESI-mass spectrometry analysis, we proposed the structure of Co2+-2·1 complex as shown in Scheme 2.
1 stoichiometry. To further confirm the binding mode of Co2+-2·1 complex, ESI-mass spectrometry analysis was carried out (Fig. 3). The positive-ion mass spectrum showed that the peak at m/z = 620.00 was assignable to [2·1 + Co2+ − H]+ [calcd 620.05]. Based on job plot and ESI-mass spectrometry analysis, we proposed the structure of Co2+-2·1 complex as shown in Scheme 2.
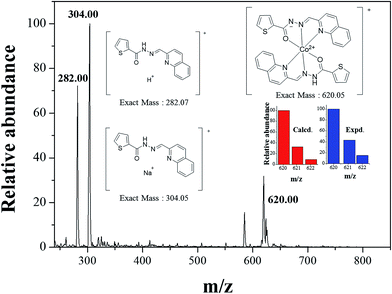 | ||
| Fig. 3 Positive-ion electrospray ionization mass spectrum of 1 (10 μM) upon addition of 1 equiv. of Co2+. | ||
Based on UV-vis titration data, the association constant of 1 for Co2+ was calculated to be 1.0 × 10¹⁰ M−2 by Li's equations (Fig. S2†),65 which is within the range of those (104–1022) reported for Co2+ sensing chemosensors.61,66,67 The limit of detection was calculated to be 0.19 μM on the basis of 3σ/slope (Fig. S3†),68 which is lower than the guideline of the New Jersey Ground Water Quality Standards rules (1.7 × 10⁻⁶ M).69 Importantly, the detection limit is the lowest one among those previously reported for simultaneous sensing of Co2+ and Cu2+ in aqueous solution with more than 90% of water, to the best of our knowledge (Table S1†).70,71 Thus, the sensor 1 could be a powerful tool for the detection of cobalt in groundwater.
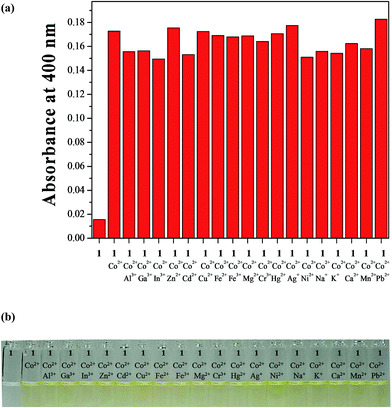
To investigate any interference from various competing metal ions in the detection of Co2+, the competition experiment was executed in the presence of Co2+ mixed with various metal ions (Fig. 4). Significantly, no interference was observed for the detection of Co2+ from Al3+, Ga3+, In3+, Zn2+, Cd2+, Cu2+, Fe2+, Fe3+, Mg2+, Cr3+, Hg2+, Ag+, Ni2+, Na+, K+, Ca2+, Mn2+ and Pb2+. These results indicated that 1 could be an excellent colorimetric sensor for Co2+ over competing relevant metal ions in aqueous solution.
For environmental applications, pH effect on the absorption response of sensor 1 to Co2+ ion was studied in a series of solutions with pH values ranging from 2 to 12 (Fig. S4†). The color of the Co2+-2·1 complex remained in the yellow region between pH 7.0 and 11.0. These results indicated that the sensor 1 could clearly detect Co2+ by the naked eye or UV-vis absorption measurements over a wide pH range of 7.0–11.0. Moreover, the reusability of sensor 1 was examined by adding ethylenediaminetetraacetic acid (EDTA) to the complexed solution of 1 and Co2+. The spectral changes were reversible after the alternating successive addition of Co2+ and EDTA (Fig. S5†). Therefore, sensor 1 toward Co2+ could be recyclable by using a suitable reagent such as EDTA.
For quantitative measurement of Co2+ in real samples, we constructed a calibration curve for the determination of Co2+ (Fig. S6†). Sensor 1 exhibited a good linear relationship between the absorbance of 1 and Co2+ concentration (0–3 μM) with a correlation coefficient of R2 = 0.9902 (n = 3). Based on the calibration curve, the chemosensor was applied for the determination of Co2+ in drinking and tap water samples. As shown in Table 1, the satisfactory recoveries and R.S.D. values were obtained for the water samples.
| Sample | Co(II) added (μmol L−1) | Co(II) found (μmol L−1) | Recovery (%) | R.S.D (n = 3) (%) |
|---|---|---|---|---|
| a Condition: [1] = 20 μmol L−1 in bis–tris buffer/DMSO (95/5, v/v). | ||||
| Drinking water | 0.00 | 0.00 | — | — |
| 2.00 | 2.08 | 104.0 | 0.66 | |
| Tap water | 0.00 | 0.00 | — | — |
| 2.00 | 1.89 | 94.5 | 1.43 | |
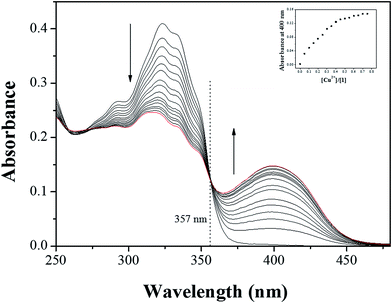
Next, we carried out the UV-vis titration to examine the concentration-dependent signaling of 1 toward Cu2+ ion (Fig. 5). Upon the gradual addition of Cu2+ to a solution of 1, the absorption band at 325 nm significantly decreased, and a new band at 400 nm gradually increased up to 0.7 equiv. of Cu2+. A clear isosbestic point was also observed 357 nm, which means that only one product was generated from 1 upon binding to Cu2+.
The binding mode between 1 and Cu2+ was determined through job plot analysis (Fig. S7†).64 It displayed a 2![[thin space (1/6-em)]](https://www.rsc.org/images/entities/char_2009.gif) :
:![[thin space (1/6-em)]](https://www.rsc.org/images/entities/char_2009.gif) 1 complexation stoichiometry between 1 and Cu2+. To further understand the binding mode of 1 with Cu2+, ESI-mass spectrometry analysis was carried out (Fig. 6). The positive-ion mass spectrum showed that the peak at m/z = 624.00 was assignable to [(2·1 + Cu2+ − H)]+ [calcd 624.05].
1 complexation stoichiometry between 1 and Cu2+. To further understand the binding mode of 1 with Cu2+, ESI-mass spectrometry analysis was carried out (Fig. 6). The positive-ion mass spectrum showed that the peak at m/z = 624.00 was assignable to [(2·1 + Cu2+ − H)]+ [calcd 624.05].
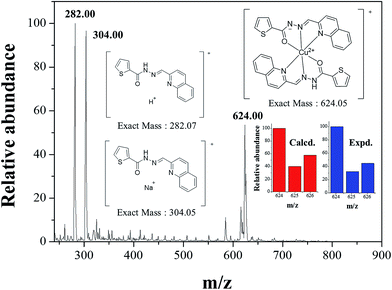 | ||
| Fig. 6 Positive-ion electrospray ionization mass spectrum of 1 (10 μM) upon addition of 1 equiv. of Cu2+. | ||
Through the UV-vis titration data, the association constant of 1 and Cu2+ was determined as 7.0 × 10⁹ M−1 on the basis of Li's equations (Fig. S8†).65 The value is within those (103–1012) reported for Cu2+ sensing chemosensors.72–77 The detection limit of Cu2+ by 1, on the basis of 3σ/slope,68 was determined to be 0.13 μM (Fig. S9†). Importantly, the value is much lower than the World Health Organization (WHO) guideline (31.5 μM) for Cu2+ in the drinking water.33,78 Importantly, the detection limit is also the lowest one among those previously reported for simultaneous detection of Co2+ and Cu2+ by organo-chemosensors in aqueous solution with more than 90% of water, to the best of our knowledge (Table S1†), while a few of inorganic- and nano-materials show better detection limits.70,71,79,80
To check the practical applicability of sensor 1 as a Cu2+ selective sensor, the competition experiment was conducted by the addition of Cu2+ ions (0.7 equiv.) to the solution of 1 containing various metal ions (0.7 equiv.) (Fig. S10†). There was no or slight interference in the detection of Cu2+ from the metal ions. For example, Mg2+, Cr3+, Hg2+, Na+, and K+ showed the slight interference, but the color of Cu2+-2·1 complex was still discernible. Thus, 1 could be used as a selective colorimetric sensor for Cu2+ in the presence of most competing metal ions.
In order to apply to environmental systems, the effect of pH on the absorption response of sensor 1 to Cu2+ was examined at pH values ranging from 2 to 12. As shown in Fig. S11,† sensing ability of 1 for Cu2+ was maintained between pH 7.0 and 10.0. This result assured of its application under physiological conditions, without any change in the detection of Cu2+.
For the reversibility test of sensor 1 toward Cu2+, ethylenediaminetraacetic acid (EDTA, 0.7 equiv.) was added to the complexed solution of sensor 1 and Cu2+ (Fig. S12†). The absorbance changes were almost reversible after several cycles with the sequentially alternative addition of Cu2+ and EDTA. These results showed that sensor 1 toward Cu2+ could be recyclable simply through treatment with a proper reagent such as EDTA. Therefore, reversibility and regeneration of sensor 1 could be applicable to the fabrication of chemosensor to detect Cu2+.
In order to examine the practical properties of the chemosensor 1 in environmental samples, the chemosensor 1 was applied for the determination of Cu2+ in water samples, using the calibration curve of 1 toward Cu2+ (Fig. S13†). Drinking and tap water samples were chosen. As shown in Table 2, appropriate recoveries and R.S.D values of the water samples were obtained.
| Sample | Cu(II) added (μmol L−1) | Cu(II) found (μmol L−1) | Recovery (%) | R.S.D (n = 3) (%) |
|---|---|---|---|---|
| a Condition: [1] = 20 μmol L−1 in bis–tris buffer/DMSO (95/5, v/v). | ||||
| Drinking water | 0.00 | 0 | — | — |
| 2.00 | 2.10 | 105.0 | 4.06 | |
| Tap water | 0.00 | 0.00 | — | — |
| 2.00 | 2.11 | 105.5 | 2.74 | |
3.2. Theoretical calculations for 1 and Cu2+-2·1 complex
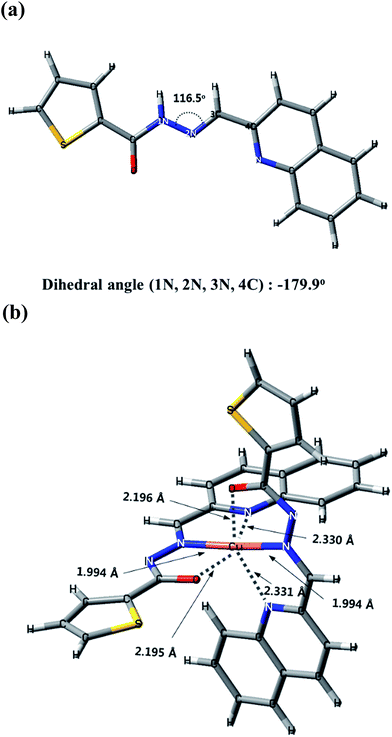
For a better understanding of the colorimetric sensing mechanism of 1 for Cu, theoretical calculations for 1 and Cu2+-2·1 were carried out in parallel to the experimental studies. Based on job plot and ESI-mass analysis, all calculations were conducted with a 2![[thin space (1/6-em)]](https://www.rsc.org/images/entities/char_2009.gif) :
:![[thin space (1/6-em)]](https://www.rsc.org/images/entities/char_2009.gif) 1 binding mode of 1 to Cu2+. Under these conditions, geometric optimizations and theoretical calculations of 1 and Cu2+-2·1 complex were carried out by applying density functional theory (DFT/B3LYP/main group atom: 6-31G** and Cu:Lanl2DZ/ECP). The energy-minimized structures with the significant structural properties are presented in Fig. 7. Sensor 1 was coordinated to Cu2+ via the O atom in the hydroxyl group and the N atoms in the imine and quinolone. The absorptions to the singlet excited states of 1 and Cu2+-2·1 complex were investigated using the TD/DFT calculations. Theoretical calculation data of 1 and Cu2+-2·1 were well matched with those obtained from their UV-vis absorption spectra. For 1, the main molecular orbital (MO) contribution of the first lowest excited state was determined for HOMO → LUMO transition (346.8 nm), which could be characterized by intramolecular charge transfer (ICT) (Fig. S14†). For Cu2+-2·1 complex, the MO contributions of the 14th and 16th lowest excited state were described in Fig. S15,† which could be characterized by ICT and ligand-to-metal charge-transfer (LMCT) transitions. Hence, these results indicated that the chelation of 1 to Cu2+ might induce the ICT and slight LMCT, which caused the red-shift (346.8 nm → 432.6 and 435.8 nm) with color change from colorless to yellow. Based on job plot, ESI-mass spectrometry analysis, theoretical calculations and the structures reported to literatures,47,63 we proposed the structure of Cu2+-2·1 complex as shown in Scheme 3.
1 binding mode of 1 to Cu2+. Under these conditions, geometric optimizations and theoretical calculations of 1 and Cu2+-2·1 complex were carried out by applying density functional theory (DFT/B3LYP/main group atom: 6-31G** and Cu:Lanl2DZ/ECP). The energy-minimized structures with the significant structural properties are presented in Fig. 7. Sensor 1 was coordinated to Cu2+ via the O atom in the hydroxyl group and the N atoms in the imine and quinolone. The absorptions to the singlet excited states of 1 and Cu2+-2·1 complex were investigated using the TD/DFT calculations. Theoretical calculation data of 1 and Cu2+-2·1 were well matched with those obtained from their UV-vis absorption spectra. For 1, the main molecular orbital (MO) contribution of the first lowest excited state was determined for HOMO → LUMO transition (346.8 nm), which could be characterized by intramolecular charge transfer (ICT) (Fig. S14†). For Cu2+-2·1 complex, the MO contributions of the 14th and 16th lowest excited state were described in Fig. S15,† which could be characterized by ICT and ligand-to-metal charge-transfer (LMCT) transitions. Hence, these results indicated that the chelation of 1 to Cu2+ might induce the ICT and slight LMCT, which caused the red-shift (346.8 nm → 432.6 and 435.8 nm) with color change from colorless to yellow. Based on job plot, ESI-mass spectrometry analysis, theoretical calculations and the structures reported to literatures,47,63 we proposed the structure of Cu2+-2·1 complex as shown in Scheme 3.
3.3. Absorption spectroscopic studies of Co2+-2·1 complex toward CN−
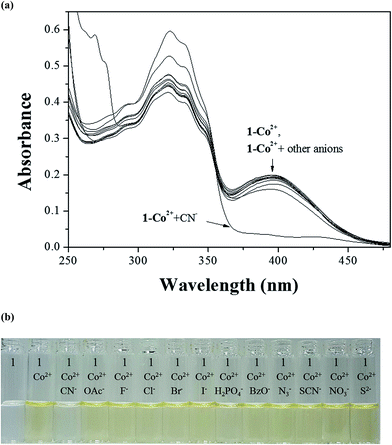
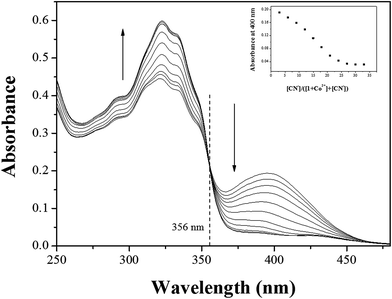
Some metal complexes showed the selectivity toward specific anions in the systems such as Cu–S, Cu–CN, and Hg–I.40,81,82 Therefore, we also examined the selectivity of Co2+-2·1 and Cu2+-2·1 complexes toward various anions. When 30 equiv. of various anions such as CN−, OAc−, F−, Cl−, Br−, I−, H2PO4−, BzO−, N3−, SCN−, NO3− and S2− were added to the two complexes in bis–tris buffer/DMSO (95/5, v/v, pH = 7), only CN− showed an instant selectivity to Co2+-2·1 complex (Fig. 8). Both UV-vis spectral and color changes from yellow to colorless were observed for CN−. These results indicated that Co2+-2·1 complex can serve as a “naked-eye” chemosensor for CN− in aqueous solution.In order to understand the binding properties of Co2+-2·1 complex with CN−, we carried out the UV-vis titration experiments (Fig. 9). On the treatment with CN− to the solution of Co2+-2·1, the absorption band at 400 nm significantly decreased, and the band at 325 nm increased with a distinct isosbestic point at 356 nm, indicating the formation of only one UV-active species. Moreover, the final UV-vis spectrum of Co2+-2·1 with CN− was nearly identical to that of 1 (Fig. S16†), indicating the reproduction of 1. These results led us to propose that Co2+-2·1 complex might undergo the demetallation by CN− as shown in Scheme 4.
The job plot for the binding between Co2+-2·1 complex and CN− revealed a 1![[thin space (1/6-em)]](https://www.rsc.org/images/entities/char_2009.gif) :
:![[thin space (1/6-em)]](https://www.rsc.org/images/entities/char_2009.gif) 1 stoichiometry (Fig. S17†). The binding constant between Co2+-2·1 and CN− was calculated as 3.0 × 10⁴ M−1 on the basis of the Benesi–Hildebrand equation (Fig. S18†).83 Based on the result of UV-vis titration, the detection limit for CN− was determined to be 24.11 μM on basis of 3 σ/K (Fig. S19†).68 Importantly, this is the third example of the cyanide-selective colorimetric chemosensor by using cobalt complex as a sensor in aqueous solution with more than 90% of water, to best of our knowledge (Table S2†).
1 stoichiometry (Fig. S17†). The binding constant between Co2+-2·1 and CN− was calculated as 3.0 × 10⁴ M−1 on the basis of the Benesi–Hildebrand equation (Fig. S18†).83 Based on the result of UV-vis titration, the detection limit for CN− was determined to be 24.11 μM on basis of 3 σ/K (Fig. S19†).68 Importantly, this is the third example of the cyanide-selective colorimetric chemosensor by using cobalt complex as a sensor in aqueous solution with more than 90% of water, to best of our knowledge (Table S2†).
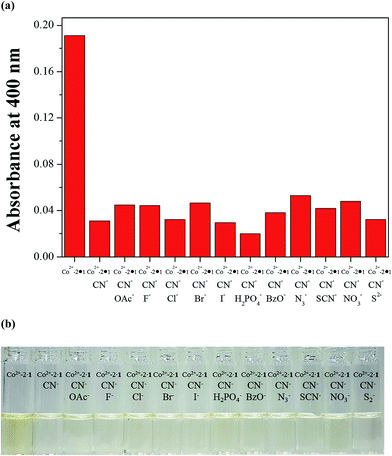
To check further the practical applicability of Co2+-2·1 as a CN−-selective sensor, competition experiments were carried out. For the competition test, the Co2+-2·1 complex was treated with 30 equiv. of CN− in the presence of various competing anions (30 equiv.) such as OAc−, F−, Cl−, Br−, I−, H2PO4−, BzO−, N3−, SCN−, NO3− and S2− in bis–tris buffer/DMSO (95/5, v/v, pH = 7) (Fig. 10). The coexistent anions showed no interference in the UV-vis spectral and color changes for the detection of CN−. These results suggested that Co2+-2·1 could be an excellent chemosensor for the detection of CN− over competing anions through naked eye.
In order to investigate pH dependence of Co2+-2·1 toward CN−, the pH test was carried out in a wide range of pH (Fig. S20†). The optimal range for the colorimetric sensing of CN− by Co2+-2·1 was turned out to be between pH 7.0 and pH 11.0. Therefore, CN− could be clearly detected by the naked eye or UV-vis absorption measurements using Co2+-2·1 over a range of pH 7.0–11.0.
4. Conclusion
We developed a simple thiophene-2-carbohydrazide-based colorimetric chemosensor 1 for Co2+ and Cu2+. The sensor 1 selectively detected Co2+ and Cu2+ through a color change from colorless to yellow. Importantly, 1 could quantify Co2+ and Cu2+ in real water samples with the satisfactory recoveries and R.S.D values. The binding of 1 with Co2+ and Cu2+ was reversible with a suitable reagent such as EDTA. In addition, the resulting Co2+-2·1 complex can be used as a colorimetric sensor for cyanide with changing its color form yellow to colorless in aqueous solution. The cyanide-sensing mechanism by Co2+-2·1 complex was proposed to be a simple demetallation between Co2+-2·1 and CN−. Therefore, these results may contribute to the development of a novel type of chemosensors for a multifunctional “naked-eye” detection of Co2+ and Cu2+ and for the sequential recognition of Co2+ and CN− by a colorimetric method in aqueous solution.Acknowledgements
Financial support from Basic Science Research Program through the National Research Foundation of Korea (NRF) funded by the Ministry of Education, Science and Technology (NRF-2014R1A2A1A11051794 and NRF-2015R1A2A2A09001301) are gratefully acknowledged. This subject is also supported by Korea Ministry of Environment (MOE) as “The Chemical Accident Prevention Technology Development Project”.References
- H. N. Kim, M. H. Lee, H. J. Kim, J. S. Kim and J. Yoon, Chem. Soc. Rev., 2008, 37, 1465–1472 RSC.
- Y. Ding, Y. Tang, W. Zhu and Y. Xie, Chem. Soc. Rev., 2015, 44, 1101–1112 RSC.
- Y. Xie, P. Wei, X. Li, T. Hong, K. Zhang and H. Furuta, J. Am. Chem. Soc., 2013, 135, 19119–19122 CrossRef CAS PubMed.
- B. Chen, Y. Ding, X. Li, W. Zhu, J. P. Hill, K. Ariga and Y. Xie, Chem. Commun., 2013, 49, 10136–10138 RSC.
- Y. Ding, X. Li, T. Li, W. Zhu and Y. Xie, J. Org. Chem., 2013, 78, 5328–5338 CrossRef CAS PubMed.
- S. Goswami, D. Sen and N. K. Das, Org. Lett., 2010, 12, 856–859 CrossRef CAS PubMed.
- K. W. Walker and R. A. Bradshaw, Protein Sci., 1998, 7, 2684–2687 CrossRef CAS PubMed.
- C. Little, S. E. Aakre, M. G. Rumsby and K. Gwarsha, Biochem. J., 1982, 207, 117–121 CrossRef CAS PubMed.
- M. Dennis and P. E. Kolattukudy, Proc. Natl. Acad. Sci. U. S. A., 1992, 89, 5306–5310 CrossRef CAS.
- D. G. Barceloux, J. Toxicol., Clin. Toxicol., 1999, 37, 201–206 CrossRef CAS PubMed.
- D. Maity, V. Kumar and T. Govindaraju, Org. Lett., 2012, 14, 6008–6011 CrossRef CAS PubMed.
- C. Y. Li, X. B. Zhang, Z. Jin, R. Han, G. L. Shen and R. Q. Yu, Anal. Chim. Acta, 2006, 580, 143–148 CrossRef CAS PubMed.
- D. Maity, A. Raj, D. Karthigeyan, T. K. Kundu and T. Govindaraju, RSC Adv., 2013, 3, 16788–16794 RSC.
- S. Y. Lee, J. J. Lee, K. H. Bok, S. Y. Kim and C. Kim, RSC Adv., 2016, 6, 28081–28088 RSC.
- J. Shi, C. Lu, D. Yan and L. Ma, Biosens. Bioelectron., 2013, 45, 58–64 CrossRef CAS PubMed.
- Y. Yao, D. Tian and H. Li, ACS Appl. Mater. Interfaces, 2010, 2, 684–690 CAS.
- Y. Tan, J. Yu, Y. Cui, Y. Yang, Z. Wang, X. Hao and G. Qian, Analyst, 2011, 136, 5283–5286 RSC.
- M. Iniya, D. Jeyanthi, K. Krishnaveni and D. Chellappa, RSC Adv., 2014, 4, 25393–25397 RSC.
- H. Y. Luo, X. B. Zhang, C. L. He, G. L. Shen and R. Q. Yu, Spectrochim. Acta, Part A, 2008, 70, 337–342 CrossRef PubMed.
- A. Léonard and R. Lauwerys, Mutat. Res., Genet. Toxicol., 1990, 239, 17–27 CrossRef.
- K. Y. Ryu, S. Y. Lee, D. Y. Park, S. Y. Kim and C. Kim, Sens. Actuators, B, 2017, 242, 792–800 CrossRef CAS.
- E. J. Song, G. J. Park, J. J. Lee, S. Lee, I. Noh, Y. Kim, S. J. Kim, C. Kim and R. G. Harrison, Sens. Actuators, B, 2015, 213, 268–275 CrossRef CAS.
- R. Uauy, M. Olivares and M. Gonzalez, Am. J. Clin. Nutr., 1998, 67, 952–959 Search PubMed.
- D. G. Barceloux, J. Toxicol., Clin. Toxicol., 1999, 37, 217–230 CrossRef CAS PubMed.
- S. Bothra, R. Kumar, A. Kuwar, N. Singh and S. K. Sahoo, Mater. Lett., 2015, 145, 34–36 CrossRef CAS.
- Y. B. Wagh, A. Kuwar, S. K. Sahoo, J. Gallucci and D. S. Dalal, RSC Adv., 2015, 5, 45528–45534 RSC.
- X. Chen, M. J. Jou, H. Lee, S. Kou, J. Lim, S. W. Nam, S. Park, K. M. Kim and J. Yoon, Sens. Actuators, B, 2009, 137, 597–602 CrossRef CAS.
- Y. S. Kim, G. J. Park, S. A. Lee and C. Kim, RSC Adv., 2015, 5, 31179–31188 RSC.
- Y. K. Jang, U. C. Nam, H. L. Kwon, I. H. Hwang and C. Kim, Dyes Pigm., 2013, 99, 6–13 CrossRef CAS.
- A. K. Mahapatra, G. Hazra, N. K. Das and S. Goswami, Sens. Actuators, B, 2011, 156, 456–462 CrossRef CAS.
- S. Goswami, D. Sen, N. K. Das and G. Hazra, Tetrahedron Lett., 2010, 51, 5563–5566 CrossRef CAS.
- B. Sarkar, Chem. Rev., 1999, 99, 2535–2544 CrossRef CAS PubMed.
- K. J. Barnham, C. L. Masters and A. I. Bush, Nat. Rev. Drug Discovery, 2004, 3, 205–214 CrossRef CAS PubMed.
- K. B. Kim, H. Kim, E. J. Song, S. Kim, I. Noh and C. Kim, Dalton Trans., 2013, 42, 16569–16577 RSC.
- N. Kumari, N. Dey, S. Jha and S. Bhattacharya, ACS Appl. Mater. Interfaces, 2013, 5, 2438–2445 CAS.
- Y. H. Tang, Y. Qu, Z. Song, X. P. He, J. Xie, J. Hua and G. R. Chen, Org. Biomol. Chem., 2012, 10, 555–560 CAS.
- D. T. Shi, B. Zhang, Y. X. Yang, C. C. Guan, X. P. He, Y. C. Li, G. R. Chen and K. Chen, Analyst, 2013, 138, 2808–28011 RSC.
- L. Tang, P. Zhou, K. Zhong and S. Hou, Sens. Actuators, B, 2013, 182, 439–445 CrossRef CAS.
- L. Tang and M. Cai, Sens. Actuators, B, 2012, 173, 862–867 CrossRef CAS.
- L. Tang, M. Cai, Z. Huang, K. Zhong, S. Hou, Y. Bian and R. Nandhakumar, Sens. Actuators, B, 2013, 185, 188–194 CrossRef CAS.
- X. Lou, J. Qin and Z. Li, Analyst, 2009, 134, 2071–2075 RSC.
- N. Khairnar, K. Tayade, S. K. Sahoo, B. Bondhopadhyay, A. Basu, J. Singh, N. Singh, V. Gite and A. Kuwar, Dalton Trans., 2015, 44, 2097–2102 RSC.
- J. H. Kang, S. Y. Lee, H. M. Ahn and C. Kim, Sens. Actuators, B, 2017, 242, 25–34 CrossRef CAS.
- H. J. Lee, S. J. Park, H. J. Sin, Y. J. Na and C. Kim, New J. Chem., 2015, 39, 3900–3907 RSC.
- Y. K. Tsui, S. Devaraj and Y. P. Yen, Sens. Actuators, B, 2012, 161, 510–519 CrossRef CAS.
- T. G. Jo, Y. J. Na, J. J. Lee, M. M. Lee, S. Y. Lee and C. Kim, Sens. Actuators, B, 2015, 211, 498–506 CrossRef CAS.
- G. R. You, G. J. Park, J. J. Lee and C. Kim, Dalton Trans., 2015, 44, 9120–9129 RSC.
- J. J. Lee, S. Y. Lee, K. H. Bok and C. Kim, J. Fluoresc., 2015, 25, 1449–1459 CrossRef CAS PubMed.
- M. R. B. Binet, R. Ma, C. W. McLeod and R. K. Poole, Anal. Biochem., 2003, 318, 30–38 CrossRef CAS PubMed.
- Y. W. Choi, G. J. Park, Y. J. Na, H. Y. Jo, S. A. Lee, G. R. You and C. Kim, Sens. Actuators, B, 2014, 194, 343–352 CrossRef CAS.
- R. M. Yucel, Y. He and A. M. Zaslavsky, Stat. Med., 2011, 30, 3447–3460 CrossRef PubMed.
- A. D. Becke, J. Chem. Phys., 1993, 98, 5648–5652 CrossRef CAS.
- C. Lee, W. Yang and R. G. Parr, Phys. Rev. B: Condens. Matter Mater. Phys., 1988, 37, 785–789 CrossRef CAS.
- P. C. Hariharan and J. A. Pople, Theor. Chim. Acta, 1973, 28, 213–222 CrossRef CAS.
- M. M. Francl, W. J. Pietro, W. J. Hehre, J. S. Binkley, M. S. Gordon, D. J. DeFrees and J. a. Pople, J. Chem. Phys., 1982, 77, 3654–3665 CrossRef CAS.
- W. R. Wadt and P. J. Hay, J. Chem. Phys., 1985, 82, 284–298 CrossRef CAS.
- P. J. Hay and W. R. Wadt, J. Chem. Phys., 1985, 82, 270–283 CrossRef CAS.
- V. Barone and M. Cossi, J. Phys. Chem. A, 1998, 102, 1995–2001 CrossRef CAS.
- M. Cossi and V. Barone, J. Chem. Phys., 2001, 115, 4708–4717 CrossRef CAS.
- N. M. O'Boyle, A. L. Tenderholt and K. M. Langner, J. Comput. Chem., 2008, 29, 839–845 CrossRef PubMed.
- J. J. Lee, Y. W. Choi, G. R. You, S. Y. Lee and C. Kim, Dalton Trans., 2015, 44, 13305–13314 RSC.
- G. J. Park, Y. J. Na, H. Y. Jo, S. A. Lee and C. Kim, Dalton Trans., 2014, 43, 6618–6622 RSC.
- G. J. Park, J. J. Lee, G. R. You, L. Nguyen, I. Noh and C. Kim, Sens. Actuators, B, 2016, 223, 509–519 CrossRef CAS.
- P. Job, Ann. Chim., 1928, 9, 113–203 CAS.
- G. Grynkiewicz, M. Poenie and R. Y. Tsien, J. Biol. Chem., 1985, 260, 3440–3450 CAS.
- F. A. Abebe, C. S. Eribal, G. Ramakrishna and E. Sinn, Tetrahedron Lett., 2011, 52, 5554–5558 CrossRef CAS.
- S. H. Mashraqui, M. Chandiramani, R. Betkar and K. Poonia, Tetrahedron Lett., 2010, 51, 1306–1308 CrossRef CAS.
- Y. Shiraishi, S. Sumiya and T. Hirai, Chem. Commun., 2011, 47, 4953–4955 RSC.
- C. Y. Tsai and Y. W. Lin, Analyst, 2013, 138, 1232–1238 RSC.
- D. Tsoutsi, L. Guerrini, J. M. Hermida-Ramon, V. Giannini, L. M. Liz-Marzán, A. Wei and R. A. Alvarez-Puebla, Nanoscale, 2013, 5, 5841–5846 RSC.
- A. Contino, G. Maccarrone, M. Zimbone, R. Reitano, P. Musumeci, L. Calcagno and I. P. Oliveri, J. Colloid Interface Sci., 2016, 462, 216–222 CrossRef CAS PubMed.
- Y. H. Lee, N. Park, Y. Bin Park, Y. J. Hwang, C. Kang and J. S. Kim, Chem. Commun., 2014, 50, 3197–3200 RSC.
- Y. Dai, Y. G. Wang, J. Geng, Y. X. Peng and W. Huang, Dalton Trans., 2014, 43, 13831–13834 RSC.
- C. B. Huang, H. R. Li, Y. Luo and L. Xu, Dalton Trans., 2014, 43, 8102–8108 RSC.
- X. Guan, W. Lin and W. Huang, Org. Biomol. Chem., 2014, 12, 3944–3949 CAS.
- Q. Zou, X. Li and H. Ågren, Dyes Pigm., 2014, 111, 1–7 CrossRef CAS.
- S. Pu, L. Ma, G. Liu, H. Ding and B. Chen, Dyes Pigm., 2015, 113, 70–77 CrossRef CAS.
- B. Sarkar, Chem. Rev., 1999, 113, 2535–2544 CrossRef.
- V. K. Gupta, R. Prasad and A. Kumar, Talanta, 2003, 60, 149–160 CrossRef CAS PubMed.
- A. K. Singh, P. Saxena, S. Mehtab and A. Panwar, Anal. Bioanal. Chem., 2006, 7, 1342–1346 CrossRef PubMed.
- G. J. Park, I. H. Hwang, E. J. Song, H. Kim and C. Kim, Tetrahedron, 2014, 70, 2822–2828 CrossRef CAS.
- S. Y. Lee, J. J. Lee, K. H. Bok, J. A. Kim, Y. K. So and C. Kim, Inorg. Chem. Commun., 2016, 70, 147–152 CrossRef CAS.
- H. A. Benesi and J. H. Hildebrand, J. Am. Chem. Soc., 1949, 71, 2703–2707 CrossRef CAS.
Footnote |
| † Electronic supplementary information (ESI) available: Supplementary data (experimental procedures and additional experimental data) associated with this article can be found. See DOI: 10.1039/c7ra01580a |
| This journal is © The Royal Society of Chemistry 2017 |


