
 Open Access Article
 This Open Access Article is licensed under a Creative Commons Attribution-Non Commercial 3.0 Unported Licence
MesoDyn prediction of a pharmaceutical microemulsion self-assembly consistent with experimental measurements
Xin Zhao a,
Zhengwu Wangb,
Shiling Yuanc,
Juan Lua and
Zhongni Wang*a
a,
Zhengwu Wangb,
Shiling Yuanc,
Juan Lua and
Zhongni Wang*a
aCollege of Chemistry, Chemical Engineering and Materials Science, Collaborative Innovation Center of Functionalized Probes for Chemical Imaging in Universities of Shandong, Shandong Normal University, Jinan 250014, P. R. China. E-mail: zhongniw@hotmail.com
bDepartment of Food Science Technology, Shanghai Jiaotong University, Shanghai 200240, P. R. China
cKey Laboratory of Colloid and Interface Chemistry, Institute of Theoretical Chemistry, Shandong University, Jinan 250100, P. R. China
First published on 7th April 2017
Abstract
In this work, for the first time a coarse-grained model in a mesoscopic dynamic (MesoDyn) simulation for a pharmaceutical nonionic surfactant Brij97 was presented. By using this coarse-grained model, the morphology transition from oil in water (O/W) to a bicontinuous microemulsion formed in the Brij97/isopropanol/isoamyl acetate/H2O quaternary system was predicted. Furthermore, the effect of emulsifier/isoamyl acetate mass ratio, Brij97/alcohol mass ratio and alcohol structure on the droplets size and kinetic formation process of the O/W microemulsion were studied. These MesoDyn predictions were consistent with experimental measurements. This makes it possible to further predict the formation mechanism of complex drug-loaded aggregates of Brij97 by using this coarse-grained model.
1 Introduction
Recently, pharmaceutical surfactant self-assemblies have aroused extensive interests due to their excellent abilities of sustained and controlled release for bioactive drugs.1 Polyoxyethylene oleyl ether Brij97, as a typical non-ionic surfactant, has its advantages in drug delivery on account of the special ability to enhance the permeation of a drug.2 In our previous studies, Brij97 could form various aggregates including micellar,3 microemulsion,4 lamellar,5 hexagonal6,7 and cubic8,9 liquid crystals. Although the formation conditions of various Brij97-based aggregates have been shown clearly, the detailed information of the self-assembled process of Brij97 in the oil–water interface at the nanometer scale10 is difficult to obtain from experiments.Aiming to address the limitation of the experiments, computer simulations have been proven to be valuable tools for providing additional information at molecular11 or mesoscopic scale.12 In particular, mesoscopic dynamics (MesoDyn) simulation have become a powerful analytical approach for exploring the phase behaviour and dynamic evolution process of polymer or surfactant in solvents at real conditions (pressure and temperature). Li, Y. et al.13 used MesoDyn method to simulate the aggregation behaviour of pluronic copolymer L64 solutions in the presence of SDS. The kinetic process of micelles formation underwent transitions from three to two stages with the increase of L64 concentration, which was hard to be observed from the experiments. The necessity of the shear and the weak charge to the formation of hexagonal templates in the P123 copolymer were confirmed by Yuan, S. et al. through MesoDyn simulations.12
Microemulsions, usually consisting of surfactant, co-surfactant, oil and water, are defined as optically isotropic transparent and thermodynamically stable systems.14 Microemulsions have been extensive applied in various fields, such as separation,15 chemical reactions,16 nanomaterial preparation,17 and drug delivery.18 Microemulsions application are largely dependent on their different structures, namely, oil-in-water (O/W), bicontinuous (B.C.), and water-in-oil (W/O) structures. However, as far as we know, the effect of components on the aggregation process of microemulsion from the perspective of phase behaviour and nanostructure19 was rarely reported.
In present work, the coarse-grained model of Brij97 in MesoDyn simulation was presented for the first time. The morphologies of Brij97/isopropanol/isoamyl acetate/H2O were predicted by using the Brij97 model. The effect of water content, emulsifier/isoamyl acetate mass ratio, Brij97/isopropanol mass ratio and alcohol structure on the morphology and size of microemulsion were further studied by a combination of MesoDyn prediction and experimental measurements.
2 Materials and methods
2.1 Materials
Polyoxyethylene-10-oleyl ether (Brij97, purity ≥ 99%) was purchased from Sigma Chemical Company. Isopropanol, ethanol, 1,2-propanediol and isoamyl acetate were provided by Sinopharm Chemical Reagent Co., LTD (Shanghai, China). Water was deionized and then doubly distilled. All chemicals were used without further purification.2.2 Simulation method and parameters
Before employing the MesoDyn simulation, the components of our researched system were represented by coarse-grained models. In the present MesoDyn simulation, the coarse-grained model of Brij97 as E3C2 was designed and proposed for the first time, where the E beads represented the hydrophilic EO chain and the C beads represented hydrophobic alkyl chain. The ratio of beads E to C was dependent on a simple relationship for atomistic and Gaussian chains12,20 with a few modifications. It is believed that this modifications at the mesoscale level does not result in a large deviation.21 The molecular structures and coarse-grained models of all components are shown in Fig. 1. As shown, the bead W represented H2O, the bead A represented alcohol, and the bead O represented isoamyl acetate in the MesoDyn simulation.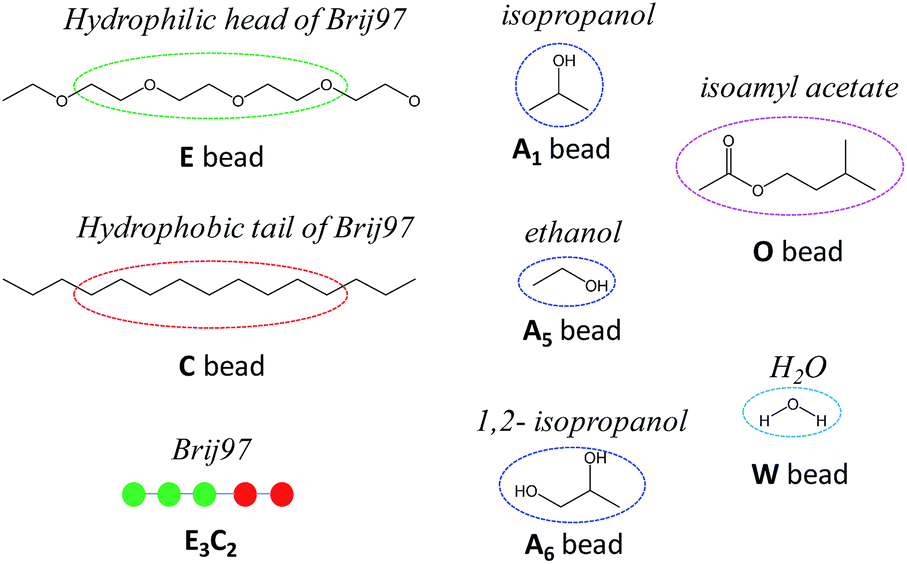 | ||
| Fig. 1 The coarse-grained models of Brij97, alcohols, isoamyl acetate and H2O in the MesoDyn simulation. The molecular structure of Brij97 is divided into two types of beads: C and E. | ||
The interaction among various beads were represented by interaction parameters. The solvent–polymer interaction energy λij are related to the Flory–Huggins interaction parameter χij through the following equation:22
| λij = χijRT | (1) |
The Flory–Huggins interaction parameter χij can be obtained by the expression:21
 | (2) |
The Flory–Huggins interaction parameter between the hydrophobic tail of Brij97 and isoamyl acetate χC–O was estimated to be 0.1 calculated from the eqn (2), consistent with similar dissolve mutually theory. However, the values of χE–W, χA–W and χE–A calculated from the eqn (2) were incorrect. The possible explanation to the trouble is that the hydrogen bonding between beads and solvent was neglected.23 Hence, the effective Flory–Huggins parameters were defined in Baulin and Halperin's work,24 ![[small chi, Greek, macron]](https://www.rsc.org/images/entities/i_char_e0d8.gif) = χeff + f(Φ). In general, the miscibility between polymer and solvent are dependent on the interaction parameter. Consequently, χE–W used in present study was defined as 0.3 on account of the hydrophilic properties of surfactant EO headgroup, and χC–W was estimated to be 5.0 due to the hydrophobic properties of surfactant alkyl chain tail. The effective Flory–Huggins interaction parameters between various beads used in this work were listed in Table 1.
= χeff + f(Φ). In general, the miscibility between polymer and solvent are dependent on the interaction parameter. Consequently, χE–W used in present study was defined as 0.3 on account of the hydrophilic properties of surfactant EO headgroup, and χC–W was estimated to be 5.0 due to the hydrophobic properties of surfactant alkyl chain tail. The effective Flory–Huggins interaction parameters between various beads used in this work were listed in Table 1.
| Bead | E | C | A | O | W |
|---|---|---|---|---|---|
| a E, C, A, O and W represent hydrophilic group of Brij97, hydrophobic group of Brij97, alcohol, isoamyl acetate, and H2O, respectively. | |||||
| E | 0 | 1.6 | 0.8 | 4.0 | 0.3 |
| C | 1.6 | 0 | 1.0 | 0.1 | 5.0 |
| A | 0.8 | 1.0 | 0 | 0.6 | 1.2 |
| O | 4.0 | 0.1 | 0.6 | 0 | 5.0 |
| W | 0.3 | 5.0 | 1.2 | 5.0 | 0 |
In MesoDyn simulation, the dimensionless parameters were chosen as follows: the size of cubic grid 32 × 32 × 32 nm, the bond length 1.1543, the bead diffusion coefficient 10−7 cm2 s−1, the noise parameter 100.0, the compressibility parameter 10 kT, the simulated temperature 298 K, the time step 0.5 ns. For each system, the total number steps of 20![[thin space (1/6-em)]](https://www.rsc.org/images/entities/char_2009.gif) 000 were carried out to reach a kinetic equilibrium. All simulations were carried out with MesoDyn module in a commercial software Materials Studio 4.4 from Accelrys, Inc,25 successful used to studied several surfactant22 or polymer26–28 solution systems.
000 were carried out to reach a kinetic equilibrium. All simulations were carried out with MesoDyn module in a commercial software Materials Studio 4.4 from Accelrys, Inc,25 successful used to studied several surfactant22 or polymer26–28 solution systems.
2.3 Construction of phase diagram
The pseudo-ternary phase diagram was constructed by the previous method described by Wang et al.4 Firstly, the surfactant (Brij97) and co-surfactant (isopropanol) were premixed at the weight ratio of 1:1 (Km) as the emulsifier (EM). Secondly, the mixtures of the EM and isoamyl acetate with the weight ratios (K) varying from 0:10 to 10:0 were stirred to be homogenized at about 50 °C. Finally, individual drops of water phase was added to each mixture under proper magnetic stirring at 25 °C. The microemulsion region was identified by a clear and transparent appearance of the solution on visual observation. Samples near the phase boundary line were equilibrated at 25 °C in a thermostatic water bath for 24 hours.
The microstructural transition from W/O, B.C. to O/W in the microemulsion region was characterized by electric conductivity measurement using a model DDSJ-308A digital conductivity meter equipped with a DJS-1C platinum bright electrode (Shanghai INESA Scientific Instrument Co., Ltd., Shanghai, China).
2.4 Diameter distributions of microemulsion formulations
The diameter distributions of different microemulsion formulations were determined using dynamic light scattering (DLS) with a Zetasizer Nano ZS90 particle size analyzer (Malvern Instruments Ltd., United Kingdom). The data of size distribution was collected at the 90° scattering angle and the temperature was kept at 25 ± 0.1 °C.3 Results and discussion
3.1 The morphologies of Brij97/isopropanol/isoamyl acetate/H2O
As we all know, the hydrophilic EO chain of Brij97 tends to contact with water, and the hydrophobic alkyl chain and oil phase should come to contact each other. Hence, the morphology of Brij97 self-assemblies could be simulated by the isosurface of E and C beads, consistent with mostly previous reports.13,21,29 Here for convenience, the content of each component in system was the weight percentage, consistent with the experiments. While the concentrations used in the MesoDyn simulation were transformed to the corresponding volume fraction.22Fig. 2(a) showed the dependence of simulated morphology of Brij97 assemblies on water content. The components of sample S1 and S2 were listed in Table 2. For S1 with 80 wt% H2O, the E beads isosurface formed several spherical droplets. In order to inspect the distribution of all compositions in the spherical droplets, a representative droplet marked by red cubic grid was segregated and analysed the radial density distribution. As shown in Fig. 2(b), the density distribution of O, C and W beads presented a single peak, broad peak and valley respectively, indicating the isoamyl acetate molecules and hydrophobic tails of Brij97 composed the core of spherical droplets without free water molecules. For hydrophilic beads E of Brij97, the density distribution presented two low peaks far from the centre of sphere, indicating a hydrophilic shell. This is a typical morphology of O/W microemulsion. While for S2 with 60 wt% H2O, the E beads isosurface formed several cylindrical channels. It is similar to a classical bicontinuous structure with water tank and oil pipe. The simulation results presented that the microemulsion underwent a transition from B.C. to O/W with water content increasing from 60 to 80 wt%. In order to further confirm the prediction obtained by MesoDyn simulation, the phase diagram of Brij97/isopropanol/isoamyl acetate/H2O (Km = 1:1) system at 25 °C was constructed.
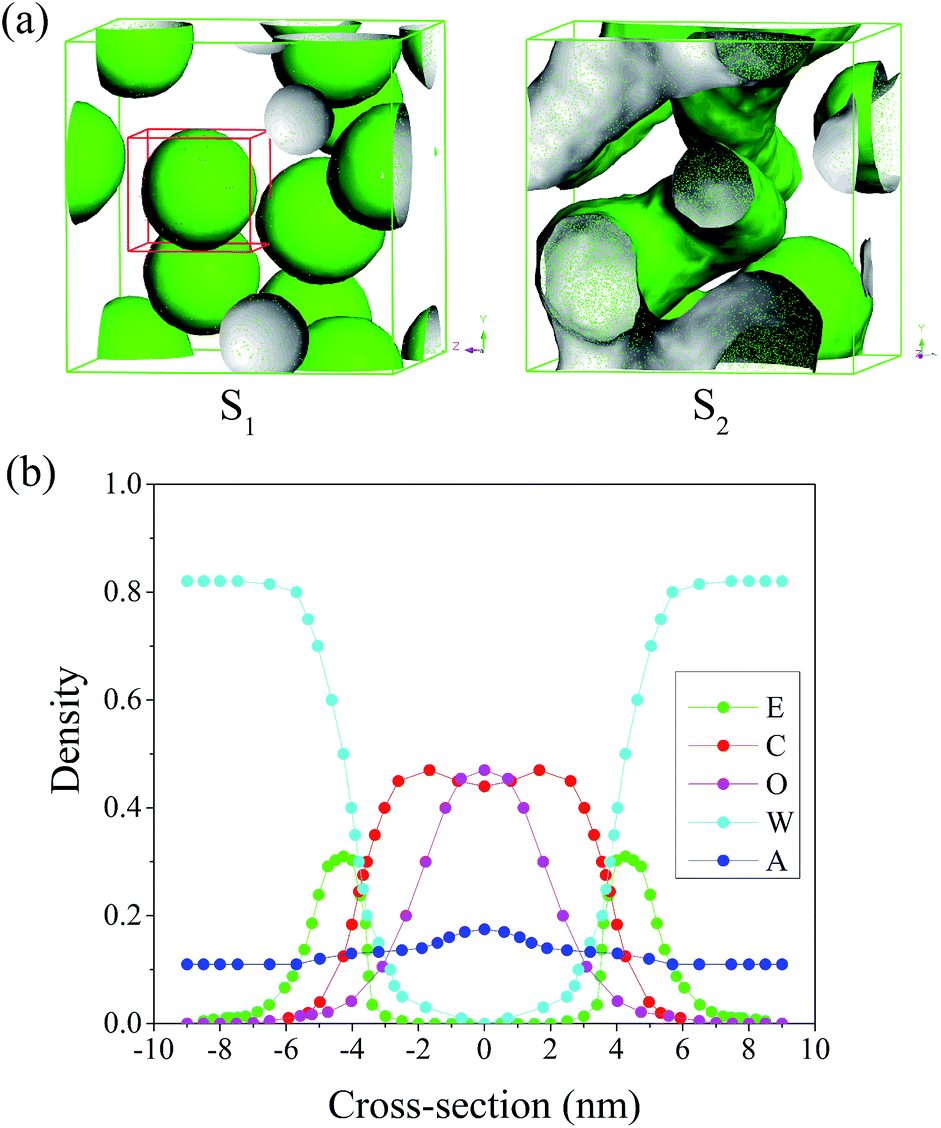 | ||
| Fig. 2 (a) The beads E isosurface representations for microemulsion formed by Brij97/isopropanol/isoamyl acetate/H2O system with different mass ratio of water: S1 (80%) and S2 (60%). (b) The radial density distributions of all compositions in the spherical droplet marked by a red cubic grid in S1. | ||
| Sample | K | Km | Alcohol | Water (%) | Size (nm) | PDI | Type |
|---|---|---|---|---|---|---|---|
| a K and Km represent the ratio of emulsifier/isoamyl acetate and Brij97/alcohol, respectively. The values of size and PDI were obtained by DLS measurement. | |||||||
| S1 | 9:1 |
1:1 |
Isopropanol | 80 | 14.81 | 0.150 | O/W |
| S2 | 9:1 |
1:1 |
Isopropanol | 60 | — | — | B.C. |
| S3 | 8:2 |
1:1 |
Isopropanol | 80 | 17.33 | 0.255 | O/W |
| S4 | 9:1 |
3:1 |
Isopropanol | 80 | 12.30 | 0.307 | O/W |
| S5 | 9:1 |
1:1 |
Ethanol | 80 | 15.52 | 0.189 | O/W |
| S6 | 9:1 |
1:1 |
1,2-Propanediol | 80 | 16.02 | 0.216 | O/W |
3.2 Phase behaviour of Brij97/isopropanol/isoamyl acetate/water system
The pseudo-ternary phase diagram of Brij97/isopropanol/isoamyl acetate/H2O (Km = 1:1) system at 25 °C was constructed and shown in Fig. 3. The phase boundary was easy to determine by visual observation. As shown, a transparent one-phase microemulsion region is marked “1Φ” in Fig. 3. The rest of the phase region marked “2Φ” is a turbid two-phase region which is a microemulsion in equilibrium with an excess water or oil phase. The similar phase behaviour was observed in Brij97/isopropanol/ethyl acetate/H2O (Km = 1:1) system at 25 °C, whereas the microemulsion area was enlarged by replacing isoamyl acetate with ethyl acetate.4 This indicated that the microemulsion area was closely related to the chain length of oil molecule, consistent with the previous result.30 It was obviously found that both the sample S1 and S2 locate in the microemulsion region marked “1Φ”.
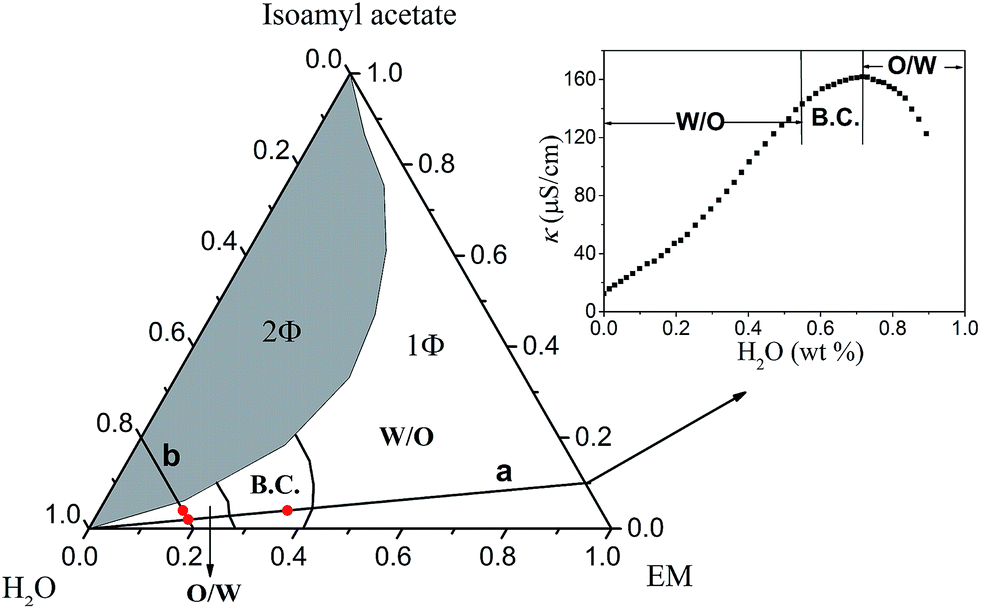 | ||
| Fig. 3 Pseudo-ternary phase diagram of EM/isoamyl acetate/H2O system at 25 °C. The insert is a representative curve of electrical conductivity (κ) vs. H2O (wt%) along dilution line a. | ||
In order to confirm the prediction of microstructural transition obtained from MesoDyn simulation, further experimental measurement was necessary. It is well known, by measuring the variations of electrical conductivity (κ) of microemulsion as a function of the water content, the microemulsion region was divided into three parts: W/O, B.C. and O/W (see in Fig. 3). A representative electric conductivity curve was shown in the insert of Fig. 3. It was obviously found that three different types of microstructure: W/O (below 54.9 wt%), bicontinuous (B.C., 54.9–71.7 wt%) and O/W (above 71.7 wt%) occurred in the present system along the water dilution line a (marked in Fig. 3). Comparing with the experimental phase diagram and electrical conductivity results, simulation results can reproduce corresponding microemulsion structure in certain water content, which indicates that the selection of coarse-grained models and interaction parameters is effective and reasonable.13
In order to further explore the aggregation behaviour of Brij97-based microemulsion, several samples were prepared and investigated by using a combination of MesoDyn prediction and experiment methods in the following research. The components and measurement results of all samples tested were listed in Table 2.
3.3 Effect of emulsifier/isoamyl acetate mass ratio (K)
To obtain a more clear understanding on the aggregation behaviour of Brij97-based microemulsion, sample S3 with a certain water content of 80 wt% was simulated by changing the mass ratio of emulsifier/isoamyl acetate (K) from 9:1 to 8:2. The MesoDyn simulation could provide the density distribution of different beads in microemulsion droplets, which help us to explore the aggregation behaviour. In the cubic grid, the density slices of beads E, C and O along the x–z plane were created and divided as depicted in Fig. 4. As shown, high density was represented by red colour, and the blue colour represents low density. As shown in the Fig. 4, the beads E was distributed in the outer layer of the droplets in contact with the water phase. While the beads C was distributed in the inner layer of the droplets in contact with the oil phase. These were typical O/W microemulsion structure. Comparing with the density slices of S1, it was easy to find that the density of beads O of S2 dispersed over a wider area. This induced beads E and C to disperse loosely.
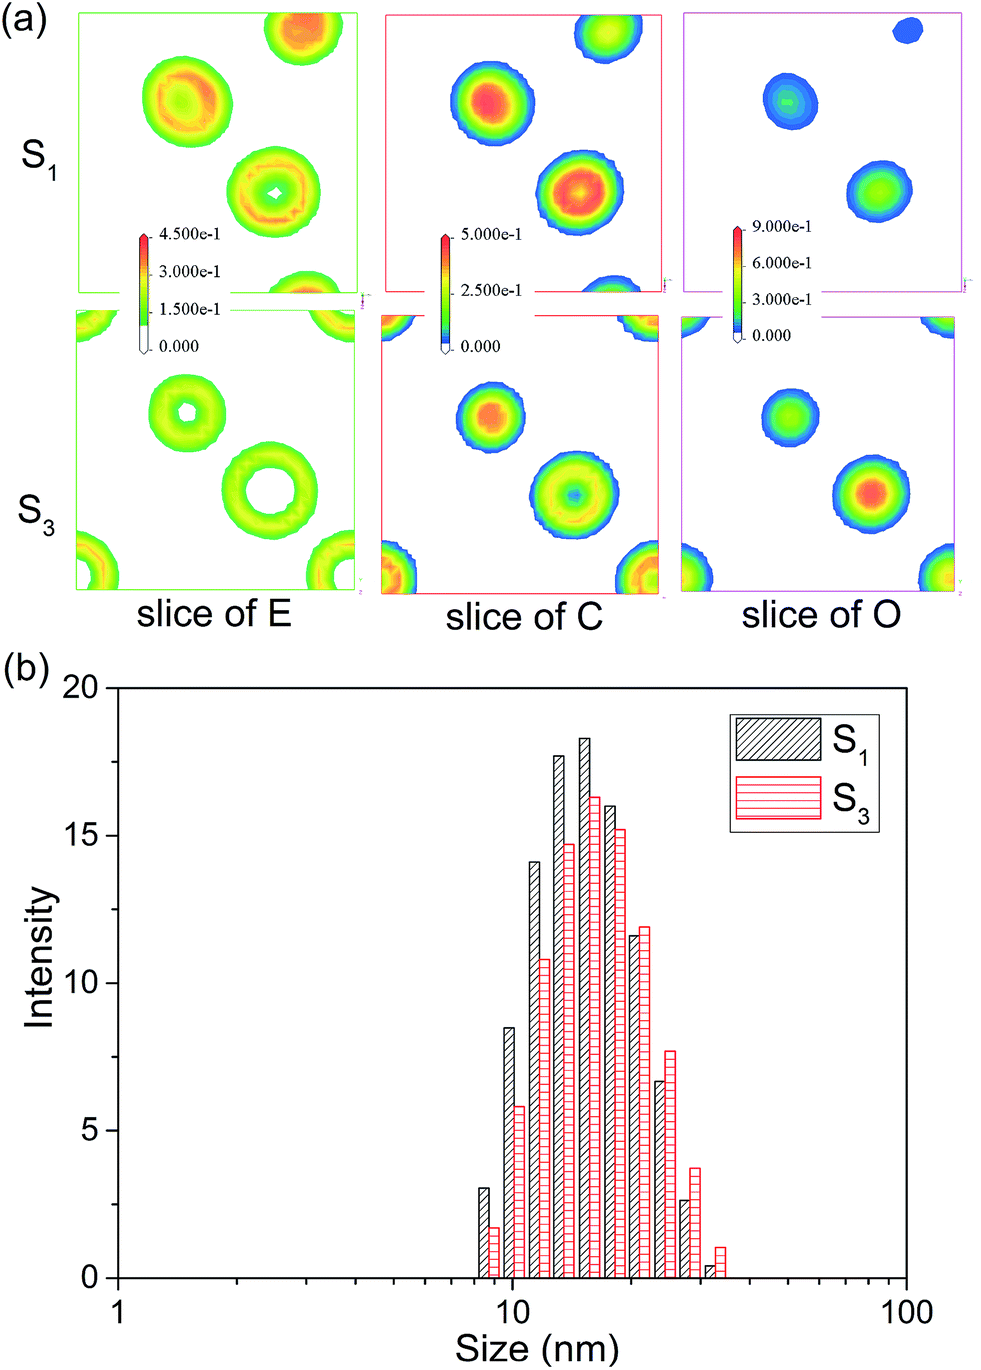 | ||
| Fig. 4 (a) The density slice of beads E, C and O for microemulsion S1 and S3. (b) The droplet size distribution of S1 and S3. | ||
To confirm the MesoDyn prediction, the droplet size distribution of microemulsion S1 and S2 were measured by dynamic light scattering. As shown in Fig. 4 and Table 2, the DLS results showed that the value of both average size and polydispersity index (PDI) increased with the K value decreased. This is consistent with the MesoDyn prediction that beads E, C and O dispersed over a wider area. Moreover, it was obviously found that the droplet size presented in simulated cubic grid (32 × 32 × 32 nm) was slightly smaller than the DLS result. The similar result was found that the size of microemulsion droplets in electron microscopy (TEM) images was also smaller than the DLS results.31 This was due to the size obtained by DLS was hydrodynamic diameter rather than real diameter.
Fig. 5(a) showed the variation of the order parameters of beads W and O as a function of time steps for microemulsion S1 and S3, respectively. As we all known, the formation process of microemulsion is a self-assembling evolution from disorder to order. Hence, the order parameter of beads in system increased along with the aggregation process of microemulsion. It was clear seen from Fig. 5(a), the formation process of the O/W microemulsion can be divided into three stages. In the first stage, all of the order parameter of beads are close to zero, indicating that each component in the system is highly dispersed. In the second stage, the order parameter of each component increased dramatically, which indicated that the ordered aggregates began to form. The third stage is the formation and stabilization of microemulsion. In this stage, the value of order parameter is not constant but waved up and down in a small range. It is not surprising because the microemulsion is a dynamic equilibrium system.
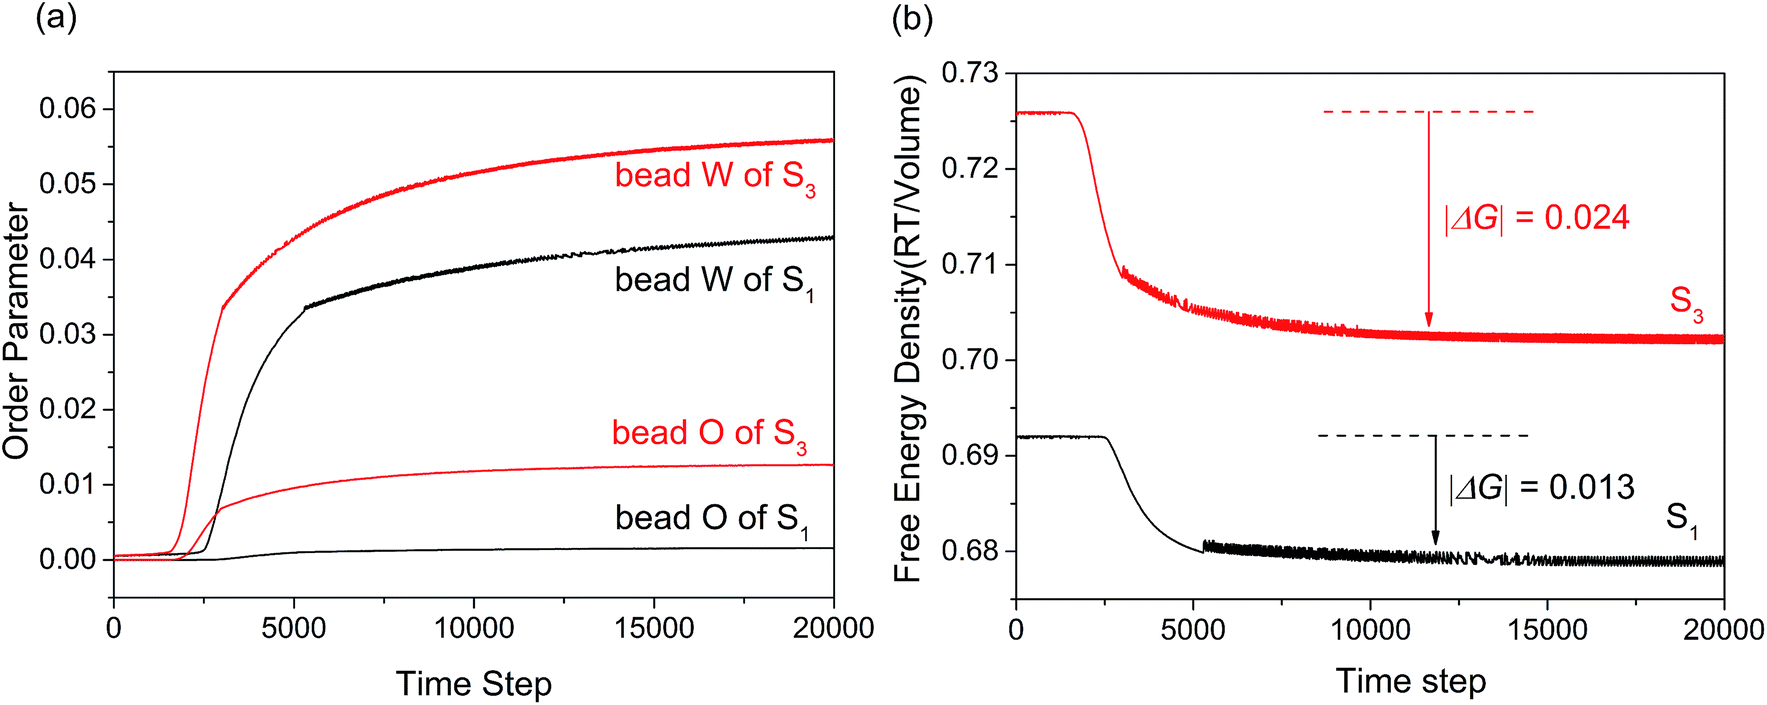 | ||
| Fig. 5 (a) Order parameter plot of beads W and O with increasing time steps for microemulsion S1 and S3. (b) Free energy density plot with time step for microemulsions S1 and S3. | ||
Comparing with the order parameters curves of bead E, C and A (not presented), the changes of beads W and O were obvious. As shown in Fig. 5(a), the time of first stage for sample S3 was shorter than that of sample S1. This indicated that the formation rate of microemulsion accelerated with the K value decreasing. The result may be due to the enhancement of hydrophobic interaction. Besides, the order parameter of isoamyl acetate and water increased significantly. The former may be result from the fact that more isoamyl acetate molecules embed into the hydrophobic chains of surfactant to arrange orderly. The latter may be due to the result that larger droplets permitted more water molecules to form hydrogen bond with EO chains of surfactant.
Apart from the size and formation rate of microemulsion, the practical application of microemulsion is also largely dependent on the thermodynamically stability. As we all know, the free energy change of system can reflect the stability. The MesoDyn simulation can provide the free energy change in the aggregation process of microemulsion, while it is hard to obtain from experiment. Fig. 5(b) showed the free energy density plots with time step for microemulsions S1 and S3. As shown, the free energy density decreased asymptotically to approach a stable value during the simulations when the system reaches dynamic equilibrium.32 This indicated that the aggregation process of microemulsion is spontaneous. It is worth mentioning that the comparison of the free energy density values between S1 and S3 is totally meaningless because it is not routinely calculated for real systems.33 While in this case, the value of free energy change (|ΔG|) before and after the aggregation could reflect the stability of microemulsion to some extent. As shown in Fig. 5(b), the |ΔG| value of S3 was higher than that of S1, indicating that the stability of microemulsion increased with the K value decreasing.
3.4 Effect of Brij97/isopropanol mass ratio (Km)
In general, the formation and stability of microemulsion are closely related to the ratio of surfactant to co-surfactant (Km).30 It will be meaningful to predict the effect of Km value on the morphology and aggregation behaviour of microemulsion by MesoDyn simulation. The beads E isosurface representations of sample S4 was shown in Fig. 6(a). Comparing with the morphology of microemulsion S1 shown in Fig. 2(a), it is clearly seen that the droplets size of S4 is smaller than that of S1. The DLS resulted showed that the hydrodynamic diameter was also decreased from 14.81 nm to 12.30 nm when the Km value increased from 1:1 to 3:1. It also can be seen from Fig. 6(a), several droplets contacted with each other in the simulated morphology of microemulsion S4, resulting in the nonuniformity of microemulsion. This is consistent with the experimental results that the PDI value of microemulsion S4 is higher than that of S1.
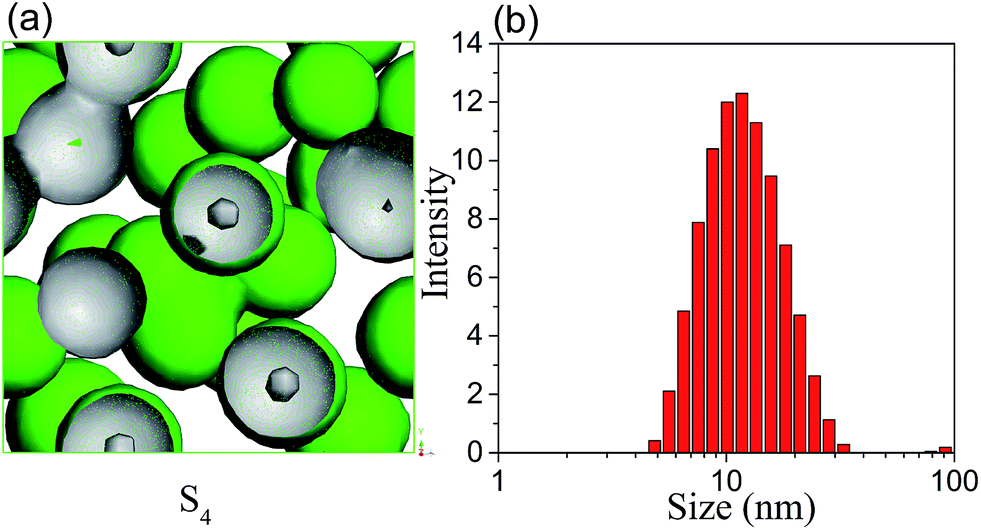 | ||
| Fig. 6 (a) The beads E isosurface representations for microemulsion S4; (b) droplet size distribution of microemulsion S4. | ||
Fig. 7(a) showed the variation of the order parameters of beads W, E and C as a function of time steps for microemulsion S1 and S4, respectively. From the figure we can see, the formation process of the microemulsion with different Km can also be divided into three stages. While for S4, the first stage of microemulsion formation was remarkably shortened. This is because that the hydrophobic interaction between various components increased with alcohol content decreasing. Besides, the order parameter of surfactant and water increased significantly. Comparing with the hydrophilic headgroup E, the order parameter of hydrophobic tail C increased more significantly. This indicated that isopropanol could weaken the hydrophobic interaction of surfactant by mainly inserting into the hydrophobic tails of surfactant. Fig. 7(b) showed the free energy density plots with time step for microemulsions S1 and S4. As shown, the |ΔG| value of S4 was higher than that of S1, indicating that the stability of microemulsion increased when the Km value increased from 1:1 to 3:1.
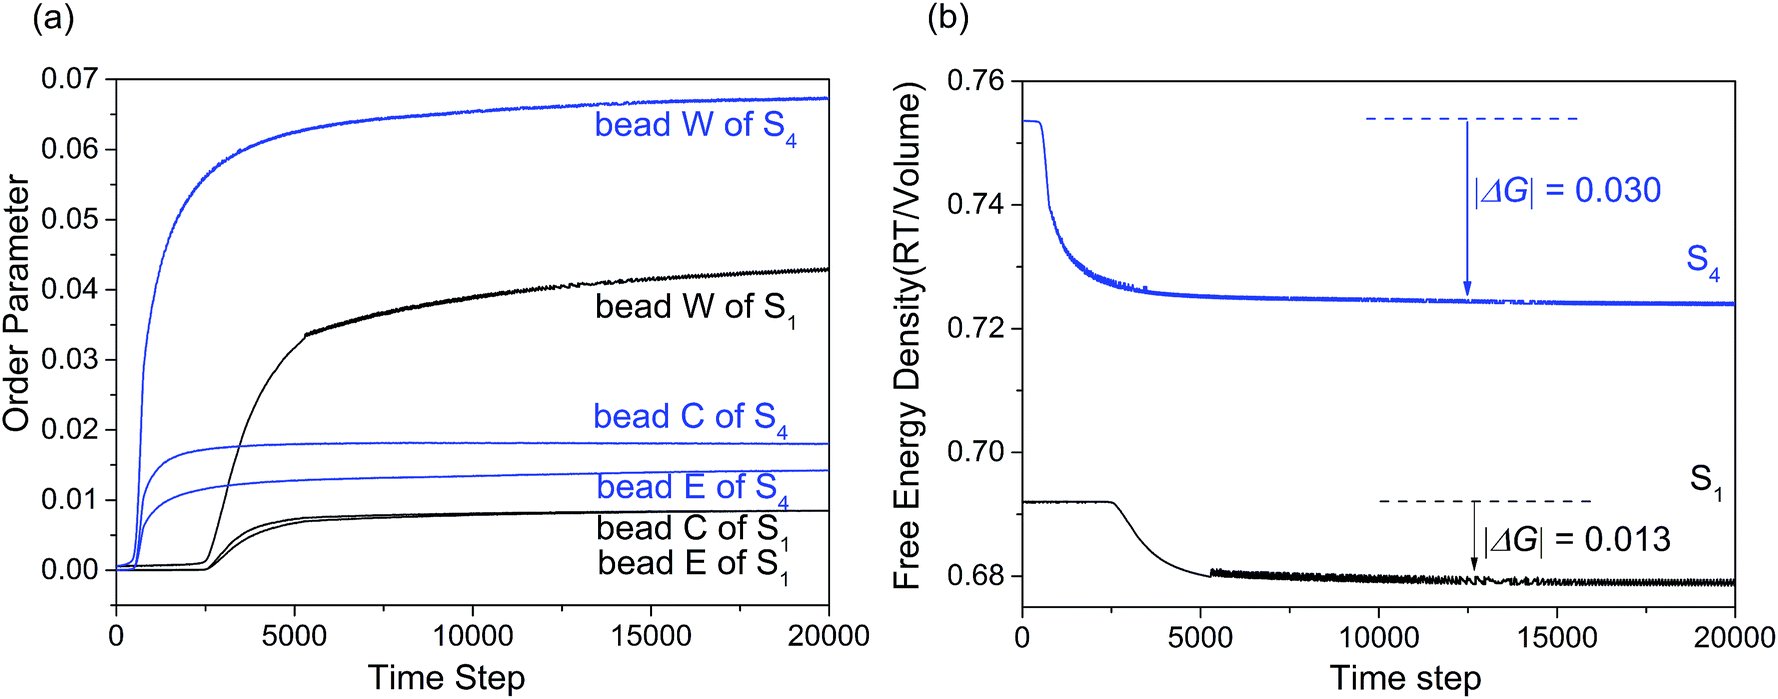 | ||
| Fig. 7 (a) Order parameter plot of beads W, C and E with increasing time steps for microemulsion S1 and S4. (b) Free energy density plot with time step for microemulsions S1 and S4. | ||
3.5 Effect of alcohol structure
Alcohol as a co-surfactant have been widely applied in microemulsion. Generally, alcohol can contribute to the formation of micelle by the means of changing the hydrophile–lipophile balance of surfactant and adjusting the polarity of water and oil phase. Usually, the chain length and polarity of alcohol are responsible for the hydrophile–lipophile ability and surface activity. Here, MesoDyn simulation was used to predict the morphologies and distribution of microemulsion formed by different alcohols.Fig. 8 S1, S5 and S6 showed the morphologies of microemulsion formed by isopropanol, ethanol and 1,2-propanediol, respectively. All microemulsion were typical O/W microstructure. It was obviously found that the droplets size increased by the order of S1, S5 and S6. The MesoDyn predictions were consistent with the DLS results listed in Table 2. This indicated that the droplets size were dependent on the polarity of co-surfactant alcohol. In order to understand clearly the mechanism of alcohol as a co-surfactant, the density slices of beads E and C of microemulsion with different alcohols were obtained. As we can see from A1, A5, and A6 in Fig. 8, the distribution of alcohol molecules in microemulsion were obviously different. For microemulsion S1, isopropanol mainly dispersed in oil to improve the polarity of oil. Ethanol mainly dispersed into surfactant molecules to adjust the hydrophile–lipophile balance for microemulsion S5. For microemulsion S6, 1,2-propanediol mainly dispersed in water phase to reduce the polarity. The different distribution of alcohol molecules may be the reason why the droplets size of microemulsion changes.
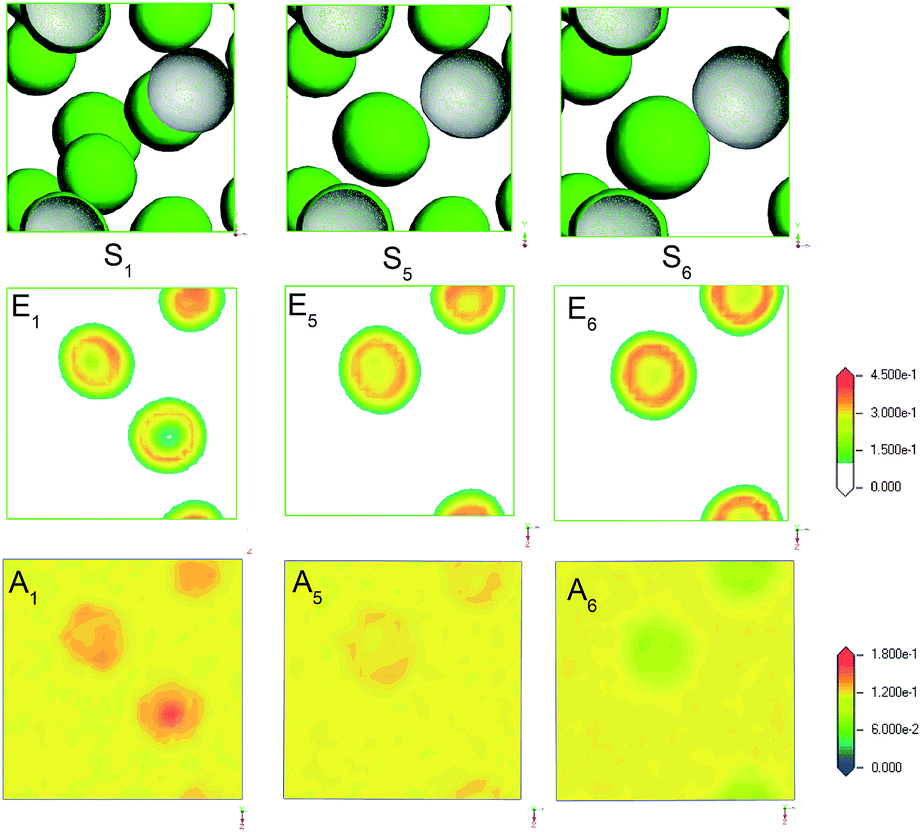 | ||
| Fig. 8 The E beads isosurface representations (S1, S5, S6), density slice of E (E1, E5, E6) and A (A1, A5, A6) for microemulsion with different alcohols: isopropanol, ethanol and 1,2-propanediol. | ||
4 Conclusions
In present work, the phase behaviour and mesoscopic structure of Brij97/isopropanol/isoamyl acetate/water were studied by using a combination of experiment and MesoDyn simulation methods. The structural transition from B.C. to O/W with water content increasing was confirmed by electric conductivity measurement and MesoDyn simulation. At a certain water content of 80 wt%, the size of microemulsion droplets increased with the value of K or Km decreasing. The MesoDyn simulation results showed that the swelling of microemulsion droplets was due to the broad dispersion of isoamyl acetate molecules in the hydrophobic chains of surfactant. Besides, the incensement of alcohol content could induce the formation of large droplets. The effect of co-surfactant on the formation and stability of microemulsion was depended on the hydrophile–lipophile ability of alcohol.Acknowledgements
Support of this work by the National Natural Science Foundation of China (31271933, 31071603) is gratefully acknowledged.References
- I. Martiel, N. Baumann, J. J. Vallooran, J. Bergfreund, L. Sagalowicz and R. Mezzenga, J. Controlled Release, 2015, 204, 78–84 CrossRef CAS PubMed.
- S.-C. Shin, C.-W. Cho and I.-J. Oh, Int. J. Pharm., 2001, 222, 199–203 CrossRef CAS PubMed.
- Z. Wang, T. Wu, W. Zhou, X. Wei and J. Zhao, J. Surfactants Deterg., 2010, 14, 391–400 CrossRef.
- Z. Wang, F. Guo, J. Lu, L. Wei and X. Liu, Adv. Mater. Res., 2014, 924, 10–17 CrossRef CAS.
- Z. Wang and W. Zhou, J. Solution Chem., 2009, 38, 659–668 CrossRef CAS.
- Z. Wang, F. Liu, Y. Gao, W. Zhuang, L. Xu, B. Han, G. Li and G. Zhang, Langmuir, 2005, 21, 4931–4937 CrossRef CAS PubMed.
- X. Liu, Z. Wang, L. Wei and X. Wei, J. Dispersion Sci. Technol., 2014, 35, 1699–1708 CrossRef CAS.
- J. Fan, F. Liu and Z. Wang, Int. J. Pharm., 2016, 497, 248–254 CrossRef CAS PubMed.
- L. Zhang, Z. Wang, J. Fan, X. Zhao and M. Wang, J. Drug Delivery Sci. Technol., 2016, 32, 49–55 CrossRef CAS.
- Y. Wang, D. D. Zhu, J. Zhou, Q. L. Wang, C. Y. Zhang, Y. J. Liu, Z. M. Wu and X. D. Guo, Colloids Surf., B, 2015, 136, 536–544 CrossRef CAS PubMed.
- B. Meng and H. S. Ashbaugh, Langmuir, 2015, 31, 3318–3325 CrossRef CAS PubMed.
- S.-L. Yuan, X.-Q. Zhang and K.-Y. Chan, Langmuir, 2009, 25, 2034–2045 CrossRef CAS PubMed.
- Y. Li, G. Xu, Y. Zhu, Y. Wang and H. Gong, Colloids Surf., A, 2009, 334, 124–130 CrossRef CAS.
- S. P. Moulik and B. K. Paul, Adv. Colloid Interface Sci., 1998, 78, 99–195 CrossRef CAS.
- Z. Lou, C. Guo, X. Feng, S. Zhang, Z. Xing, W. Shan and Y. Xiong, Hydrometallurgy, 2015, 157, 199–206 CrossRef CAS.
- I. Capek, Adv. Colloid Interface Sci., 1999, 80, 85–149 CrossRef CAS.
- S. N. Khadzhiev, K. M. Kadiev, G. P. Yampolskaya and M. K. Kadieva, Adv. Colloid Interface Sci., 2013, 197–198, 132–145 CrossRef CAS PubMed.
- A. W. Du and M. H. Stenzel, Biomacromolecules, 2014, 15, 1097–1114 CrossRef CAS PubMed.
- D. P. Acharya and P. G. Hartley, Curr. Opin. Colloid Interface Sci., 2012, 17, 274–280 CrossRef CAS.
- B. A. C. van Vlimmeren, N. M. Maurits, A. V. Zvelindovsky, G. J. A. Sevink and J. G. E. M. Fraaije, Macromolecules, 1999, 32, 646–656 CrossRef CAS.
- S. Yang, S. Yuan, X. Zhang and Y. Yan, Colloids Surf., A, 2008, 322, 87–96 CrossRef CAS.
- Y.-m. Li, G.-y. Xu, D. Wu and W.-p. Sui, Eur. Polym. J., 2007, 43, 2690–2698 CrossRef CAS.
- S. L. Guo, T. J. Hou and X. J. Xu, J. Phys. Chem. B, 2002, 106, 11397–11403 CrossRef CAS.
- V. A. Baulin and A. Halperin, Macromolecules, 2002, 35, 6432–6438 CrossRef CAS.
- Materials Studio Release Notes, Release 4.4, Accelrys Software Inc., San Diego, USA, 2008 Search PubMed.
- X. Guo, S. Yuan, S. Yang, K. Lv and S. Yuan, Colloids Surf., A, 2011, 384, 212–218 CrossRef CAS.
- C. Do, W.-R. Chen, K. Hong and G. S. Smith, Phys. B, 2013, 430, 87–94 CrossRef CAS.
- B. Zhang, R. Liu, J. Zhang, B. Liu and J. He, Comput. Theor. Chem., 2016, 1091, 8–17 CrossRef CAS.
- B. Zhang, R. Liu, J. Zhang, B. Liu and J. He, Comput. Theor. Chem., 2016, 1091, 8–17 CrossRef CAS.
- R. X. Guo, X. Fu, J. Chen, L. Zhou and G. Chen, J. Agric. Food Chem., 2016, 64, 6286–6294 CrossRef CAS PubMed.
- X. Zhao, Y. Yao, K. Tian, T. Zhou, X. Jia, J. Li and P. Liu, Eur. J. Pharm. Biopharm., 2016, 108, 91–99 CrossRef CAS PubMed.
- S. S. Jawalkar and T. M. Aminabhavi, Polymer, 2006, 47, 8061–8071 CrossRef CAS.
- Y. Fu, L. Liao, Y. Lan, L. Yang, L. Mei, Y. Liu and S. Hu, J. Mol. Struct., 2012, 1012, 113–118 CrossRef CAS.
| This journal is © The Royal Society of Chemistry 2017 |