 Open Access Article
Creative Commons Attribution 3.0 Unported Licence
The architecture of responsive polymeric ligands on protein binding and recovery†
Zizhao Liu a,
S. Ranil Wickramasinghea and
Xianghong Qian
 *b
*b
aDepartment of Chemical Engineering, University of Arkansas, Fayetteville, AR 72701, USA
bDepartment of Biomedical Engineering, University of Arkansas, Fayetteville, AR 72701, USA. E-mail: xqian@uark.edu; Tel: +1-479-575-8401
First published on 25th May 2017
Abstract
Ligand design and optimization are critical for protein purification during downstream processing. Here the effects of three dimensional architecture of salt- and thermo-responsive polymeric ligands on binding and recovery of bovine serum albumin (BSA) were investigated. The comb-like salt-responsive copolymers consisting of hydrophilic backbone (poly(hydroxylethyl methacrylate) (poly(HEMA))) and branched responsive (poly(N-vinylcaprolactam) (PVCL)) chains have been successfully grafted on membrane substrates as hydrophobic interaction ligands for protein capture and recovery. Protein binding capacity, binding kinetics and recovery were systematically investigated as a function of backbone chain density and chain length. Atom-transfer radical polymerization (ATRP) was used to control the polymer chain length and chain density of grafted brushes. Our results show that the architecture of these polymeric ligands has a significant impact on protein binding and recovery. The protein binding isotherm was found to follow the Freundlich model suggesting a multi-layer adsorption mechanism.
1. Introduction
Membrane adsorbers or adsorptive membranes are macroporous membranes functionalized with protein binding ligands. The open macroporous structure of membranes eliminates the slow pore diffusion during protein binding to the ligands leading to higher productivity and lower possibility of fouling and product degradation. However, the main drawback of membrane adsorbers is their relative low capacity compared to resin-based packed bed columns because of their lower surface to volume ratio.Hydrophobic interaction chromatography (HIC) has been used extensively in the polishing step of downstream chromatographic processes to remove aggregates and impurities in a flow-through mode since aggregates are typically more hydrophobic than monomeric antibodies. Recently there has been growing interest in developing HIC in a bind-and-elute mode for protein capture and fractionation based on their hydrophobicity. Protein binds to HIC ligands in a high salt concentration buffer and elutes in a low salt concentration buffer. Compared to protein A or ion-exchange chromatography, the capacity of HIC is generally 2–3 times lower.1 As a result, bind-and-elute HIC is only commercially viable when there is significant improvement in its protein binding capacity. Previous studies on HIC mainly focused on its performance under different conditions, including salt, pH and temperature.2–6 There are very few studies on HIC ligand effects, such as chain length and chain density since most HIC ligands are monomers or polymers grafted with uncontrollable free radical polymerizations. In addition, most HIC ligands investigated are hydrocarbon or aromatic ligands that can lead to substantial protein denaturation thus limited protein recovery.
Previously we have investigated salt- and temperature responsive poly(N-vinylcaprolactam) (PVCL) ligands for HIC applications.7 PVCL is a thermo-responsive polymer with its lower critical solution temperature (LCST) ranging from 30–50 °C depending on its molecular weight and concentration.8 Above the transition temperature, PVCL chains collapse and become hydrophobic whereas they are coil-like and hydrophilic below the transition temperature. LCST is also strongly dependent on salt ion type and salt ion concentration as was investigated before.9–12 LCST decreases as salt concentration increases. For protein purifications, instead of varying the temperature, it is generally more desirable to vary the salt concentration to elicit the LCST transition. Since the responsive ligands have facile transition between hydrophobic and hydrophilic states and more mild hydrophobicity, they are considered more gentle HIC ligands for protein purifications. As a result, higher recovery is expected compared to the conventional hydrophobic ligands.
Previous work7 investigated the use of PVCL as responsive HIC ligands and the effect of ligand density on the capacity and recovery of bovine serum albumin (BSA) protein. PVCL polymer chains were grafted directly on the regenerated cellulose membranes. Atom-transfer radical polymerization (ATRP) was used for the polymerization. Dynamic binding capacity and recovery of BSA showed their dependence on the chain density and chain length of monolayer grafted PVCL. However, the effects of ligand architecture on protein binding and recovery remain perplexing due to the complex interplay of kinetics and thermodynamics for protein binding and elution. The 3-D ligand architecture on the capacity and recovery of protein binding is the focus of this work.
ATRP is superior to other uncontrolled radical polymerization methods due to its better control over polymer chain length and chain density.13,14 ATRP has been widely investigated to graft ligands on membrane substrate to obtain membrane adsorbers with high capacity,15–17 high selectivity18 and high recovery.7 In addition, block polymers with various specific structures were synthesized via ATRP.13,19 Comb-like polymer architecture has been shown to increase the number of binding sites leading to an improved capacity for protein binding.20,21 Recently, dendritic butyl HIC ligands immobilized on resins were shown to improve grafting density and capacity.22 However, only two branching degrees of the dendritic ligands were investigated in their study. In order to improve protein binding capacity and recovery for HIC applications, comb-like PVCL ligands were grafted on a primary hydrophilic polymer backbone grafted on the regenerated cellulose membrane substrate using ATRP as shown schematically in Fig. 1. Significant improvement in dynamic binding capacity was obtained at near quantitative recovery. As far as we are aware, this is the first work on investigating three-dimensional architecture of responsive polymeric ligands on protein binding and recovery.
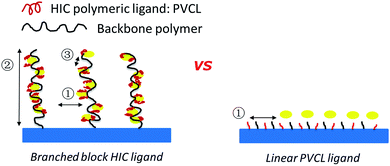 | ||
| Fig. 1 Schematics of comb-like PVCL ligands grown on primary polymer poly(HEMA) chains (left) and linear PVCL ligands grafted directly from the membrane substrate (right). | ||
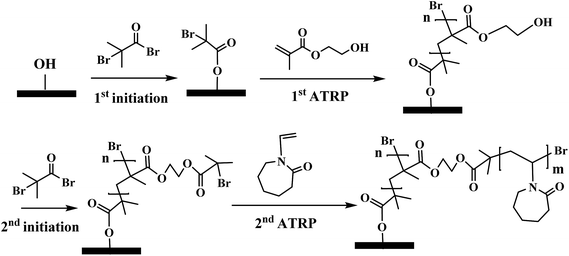
The major variables in synthesizing these comb-like brushes using ATRP include the concentrations of ATRP initiator 2-bromo-2-methylpropionyl bromide (BIB) (Fig. 2a), primary monomer 2-hydroxyethyl methacrylate (HEMA) (Fig. 2b) and secondary HIC monomer N-vinylcaprolactam (VCL) (Fig. 2c) as well as various reaction times. HEMA20,23,24 was used as a primary monomer here because it has a reactive hydroxyl group that can be used to initiate the grafting of the secondary polymers. Moreover, grafting poly(HEMA) on membrane substrate has been well studied with well-controlled grafting degrees.25–27 Fig. 3 represents the reaction scheme for grafting comb-like ligands from RC membrane surfaces. The primary backbone poly(HEMA) brush density and the secondary PVCL brush density were varied by initiation reaction condition. The impacts of the ligand architecture on protein binding, which includes primary chain density and chain length of poly(HEMA) as well as the secondary chain density of PVCL, were investigated systematically by dynamic protein binding studies. AFM and contact angle measurements of modified membranes were used to correlate surface properties with the binding results. Finally, BSA isotherms were investigated to provide insights on the binding mechanism(s).
 | ||
| Fig. 2 Structure of ATRP initiator, BIB (a), primary monomer, HEMA (b) and secondary HIC monomer, VCL (c). | ||
2. Materials
N-Vinylcaprolactam (98%), 2-hydroxyethyl methacrylate (98%), 2-bromo-2-methylpropionyl bromide (BIB, 98%), 4-(dimethylamino) pyridine (DMAP, ≥99%), copper(I) chloride (≥99.995%), copper(II) chloride (≥99.995%) and N,N,N′,N′′,N′′-pentamethyl diethylenetriamine (PMDETA, 99%) were purchased from Sigma Aldrich (St. Louis, MO). Triethylamine (TEA, ≥99%) was obtained from Alfa Aesar (Ward Hill, MA). Methanol (99.8%) and acetonitrile (99.8%) were obtained from EMD Chemicals (Billerica, MA). Boric anhydride was purchased from Avantor Performance Materials (Center Valley, PA). Anhydrous acetonitrile was obtained by distilling acetonitrile with boric anhydride. Ammonium sulfate (≥99.0%) was bought from Macron™ Fine Chemicals (Center Valley, PA). Regenerated cellulose membranes (0.45 μm and 1 μm pore size, RC55, 50 mm diameter) were purchased from GE Healthcare (Pittsburgh, PA). Bovine serum albumin (BSA) (>99%, pI 4.7, 66 kDa) was obtained from Avantor Performance Materials (Center Valley, PA).3. Experimental methods
3.1 Membrane surface modification
Membranes were modified through surface-initiated ATRP as previously reported by our earlier studies.7,18,25,28 RC membranes were first immobilized with ATRP initiator BIB in acetonitrile for 3 hours. The ATRP for the primary poly(HEMA) chains was conducted in the methanol/water solvent mixture with HEMA (monomer, 0.5 M), copper(I) chloride, copper(II) chloride, bipyridine (Bpy). The mole ratio among HEMA![[thin space (1/6-em)]](https://www.rsc.org/images/entities/char_2009.gif) :
:![[thin space (1/6-em)]](https://www.rsc.org/images/entities/char_2009.gif) CuCl
CuCl![[thin space (1/6-em)]](https://www.rsc.org/images/entities/char_2009.gif) :
:![[thin space (1/6-em)]](https://www.rsc.org/images/entities/char_2009.gif) CuCl2
CuCl2![[thin space (1/6-em)]](https://www.rsc.org/images/entities/char_2009.gif) :
:![[thin space (1/6-em)]](https://www.rsc.org/images/entities/char_2009.gif) Bpy is 200
Bpy is 200![[thin space (1/6-em)]](https://www.rsc.org/images/entities/char_2009.gif) :
:![[thin space (1/6-em)]](https://www.rsc.org/images/entities/char_2009.gif) 1
1![[thin space (1/6-em)]](https://www.rsc.org/images/entities/char_2009.gif) :
:![[thin space (1/6-em)]](https://www.rsc.org/images/entities/char_2009.gif) 0.4
0.4![[thin space (1/6-em)]](https://www.rsc.org/images/entities/char_2009.gif) :
:![[thin space (1/6-em)]](https://www.rsc.org/images/entities/char_2009.gif) 3.5. Methanol/water mixture (1
3.5. Methanol/water mixture (1![[thin space (1/6-em)]](https://www.rsc.org/images/entities/char_2009.gif) :
:![[thin space (1/6-em)]](https://www.rsc.org/images/entities/char_2009.gif) 1, v/v) was used as the polymerization solvent. ATRP solution was first degassed with argon for 15–20 min before CuCl and CuCl2 were added. Flasks attached in Schlenk line containing initiator immobilized membranes were de-oxygenated by vacuum and back-filled with argon three times. At last, the reaction mixture was transferred to the flasks by a syringe. After the predetermined polymerization time, membranes were first rinsed with methanol/water mixture (1
1, v/v) was used as the polymerization solvent. ATRP solution was first degassed with argon for 15–20 min before CuCl and CuCl2 were added. Flasks attached in Schlenk line containing initiator immobilized membranes were de-oxygenated by vacuum and back-filled with argon three times. At last, the reaction mixture was transferred to the flasks by a syringe. After the predetermined polymerization time, membranes were first rinsed with methanol/water mixture (1![[thin space (1/6-em)]](https://www.rsc.org/images/entities/char_2009.gif) :
:![[thin space (1/6-em)]](https://www.rsc.org/images/entities/char_2009.gif) 1, v/v) three times and then washed with DI water overnight. After membranes were dried in vacuum, the second initiation for grafting the secondary PVCL polymer was carried out with various concentrations of BIB. At last, ATRP of VCL monomer (1 M) solution was conducted for 4 h in methanol/water mixture (v/v 1
1, v/v) three times and then washed with DI water overnight. After membranes were dried in vacuum, the second initiation for grafting the secondary PVCL polymer was carried out with various concentrations of BIB. At last, ATRP of VCL monomer (1 M) solution was conducted for 4 h in methanol/water mixture (v/v 1![[thin space (1/6-em)]](https://www.rsc.org/images/entities/char_2009.gif) :
:![[thin space (1/6-em)]](https://www.rsc.org/images/entities/char_2009.gif) 1). ATRP solution was comprised of copper(I) chloride, copper(II) chloride, ligand N,N,N′,N′′,N′′-pentamethyldiethylenetriamine (PMDETA). The mole ratio among VCL
1). ATRP solution was comprised of copper(I) chloride, copper(II) chloride, ligand N,N,N′,N′′,N′′-pentamethyldiethylenetriamine (PMDETA). The mole ratio among VCL![[thin space (1/6-em)]](https://www.rsc.org/images/entities/char_2009.gif) :
:![[thin space (1/6-em)]](https://www.rsc.org/images/entities/char_2009.gif) CuCl
CuCl![[thin space (1/6-em)]](https://www.rsc.org/images/entities/char_2009.gif) :
:![[thin space (1/6-em)]](https://www.rsc.org/images/entities/char_2009.gif) CuCl2
CuCl2![[thin space (1/6-em)]](https://www.rsc.org/images/entities/char_2009.gif) :
:![[thin space (1/6-em)]](https://www.rsc.org/images/entities/char_2009.gif) PMDETA is 200
PMDETA is 200![[thin space (1/6-em)]](https://www.rsc.org/images/entities/char_2009.gif) :
:![[thin space (1/6-em)]](https://www.rsc.org/images/entities/char_2009.gif) 1
1![[thin space (1/6-em)]](https://www.rsc.org/images/entities/char_2009.gif) :
:![[thin space (1/6-em)]](https://www.rsc.org/images/entities/char_2009.gif) 0.2
0.2![[thin space (1/6-em)]](https://www.rsc.org/images/entities/char_2009.gif) :
:![[thin space (1/6-em)]](https://www.rsc.org/images/entities/char_2009.gif) 2. The schematic of the modification procedure is shown in Fig. 3.
2. The schematic of the modification procedure is shown in Fig. 3.
3.2 Membrane surface characterization
3.3 Protein binding studies
4. Results and discussion
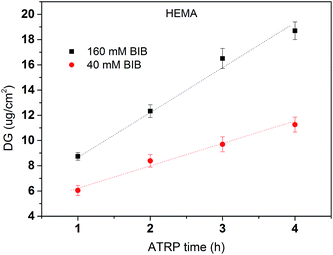
The primary polymer chain poly(HEMA) was first grafted on RC membranes by ATRP after initiator BIB immobilization on the membrane substrate. The initiator concentration and ATRP polymerization time were varied to control the initiator density and polymer chain length. The degree of grafting (DG, μg cm−2) was calculated based on the following equation:
 | (1) |
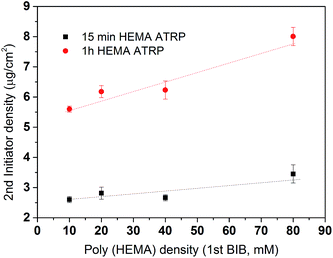
After the primary polymer chain poly(HEMA) was grafted on RC membranes, the 2nd initiation for ATRP was conducted using 160 mM BIB initiator concentration. Fig. 5 shows the grafting density of immobilized the 2nd initiator under different poly(HEMA) chain length and density measured by the increase in weight after and before 2nd initiator immobilization reaction. It can be seen that the 2nd initiator grafting density increases as the poly(HEMA) chain density increases even though the increase is somewhat small measured by the slope. This indicates that the 2nd initiators have successfully reacted with the hydroxyl groups on poly(HEMA). It also can be seen that membranes with longer poly(HEMA) chains (1 h ATRP) have a steeper increase of 2nd BIB grafting degree compared to the shorter poly(HEMA) chains (15 min ATRP). This is expected because longer poly(HEMA) chain has more hydroxyl groups to react. It is also interesting to note that with even higher poly(HEMA) density at 200 mM of the 1st initiator concentration (not shown), the 2nd BIB grafting density actually decreased to 2.3 and 5.6 μg cm−2 for 15 min and 1 h ATRP of HEMA respectively from the corresponding values at 3.5 and 8 μg cm−2 with 80 mM 1st BIB concentration. When poly(HEMA) chain density is too high, the stronger interaction and intertwining of the polymers make the initiator hard to reach due to steric hindrance and increased reaction barrier. The increase reaction barrier is caused by the formation of strong hydrogen bonds between the hydroxyl groups when the density of polymer chains becomes high.
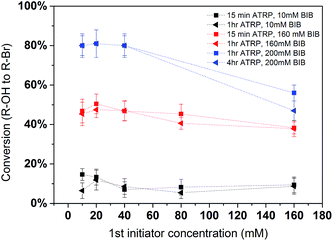
In order to further quantify the effectiveness of the modification process, conversion yields were determined. Conversion yields were calculated by the percentage of the number of second initiator immobilized with respect to the number of hydroxyl groups on the poly(HEMA) chain. It is plotted in Fig. 6. The results indicate that the yield is strongly dependent on the 2nd initiator concentration. The conversion of the reaction shows a slight decrease as the density of the primary polymer poly(HEMA) increases. This is more evident in the 200 mM BIB condition for the second initiation process. As was discussed earlier, higher poly(HEMA) density actually hinders the initiation reaction due to increased reaction barrier and steric hindrance. In addition, as the number of hydroxyl group increases, it is also likely the initiation reaction is limited by the availability of initiator. Overall, the yields of the 2nd initiation reaction are approximately 15%, 45% and 80% at 10 mM, 160 mM and 200 mM of second BIB initiator concentrations respectively. The second initiator BIB concentration of 200 mM was used for the subsequent studies since it gives the highest yield of conversion. Again, these results demonstrate the feasibility of controlling the primary poly(HEMA) chain and secondary PVCL chain densities by varying the BIB concentration used in the reaction.
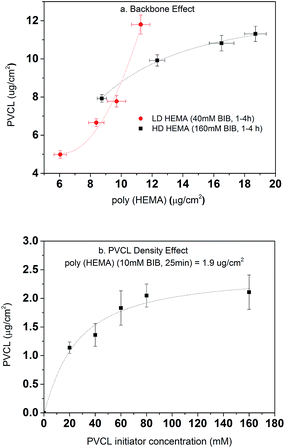
Once the second initiation was completed, ATRP was conducted for grafting PVCL on the primary poly(HEMA) ligands on the RC membranes. The ATRP time was kept at 4 h for all investigations here. As shown in Fig. 7a, the DG of PVCL grafted on RC membranes increases with the increase of the DG of poly(HEMA) indicating the successful grafting of secondary polymer PVCL from the primary poly(HEMA) backbone. It can be seen that the low density (LD, 40 mM BIB) poly(HEMA) modified membranes have a more rapid PVCL DG growth during 1–4 h of ATRP than that of the high density (HD, 160 mM BIB) ones during the same ATRP time. PVCL grafted on the LD primary poly(HEMA) polymer chains follows a second order polynomial growth mode with regard to the chain density of poly(HEMA) x (∼ax2 + bx + c, where x is the chain density, a, b, c are coefficients) indicating little or no inter-chain termination reaction. On the other hand, PVCL chains grown on HD poly(HEMA) follow a more complex growth mode with regard to the density of primary poly(HEMA) (∼a′x + b′/x, where a′ and b′ are coefficients) indicating the possibility for inter-chain termination. One of the possible explanations for the polymer growth behavior is that chain termination reaction for PVCL is more likely to happen when the primary poly(HEMA) chain density is higher. As discussed earlier, high primary chain density can lead to steric hindrance for initiator immobilization and an increased reaction barrier for the initiation reaction as the strong hydrogen bonding interaction between the –OH groups could occur. These results suggest that the density of primary poly(HEMA) chains can have a significant impact on the polymerization of the secondary PVCL chains.
The effects of BIB concentration for the second initiation reaction on PVCL polymerization were also investigated on a chosen grafted primary poly(HEMA) chains as shown in Fig. 7b. ATRP time for all the initiator concentrations was kept constant at 4 h. The results show the DG of PVCL increases with initiator concentration until it reaches a plateau corresponding to possibly a maximum density of PVCL on the chosen primary polymer chains. The results indicate again that a higher chain density, the possibility for chain termination leads to a slow-down in the polymerization reaction. Again, the results indicate the grafting density can be effectively controlled by varying the concentration of BIB initiator.
Fig. 8 shows ATR-FTIR of unmodified, poly(HEMA) modified and comb-like PVCL modified membranes. Compared to unmodified membrane, the poly(HEMA) modified membrane exhibits a peak at around 1724 cm−1, which is from the C![[double bond, length as m-dash]](https://www.rsc.org/images/entities/char_e001.gif) O stretch of the ester bond from the grafted poly(HEMA). The presence of this ester peak indicates the successful modification of the primary poly(HEMA) polymer on membrane substrate. For comb-like PVCL modified membrane, the presence of the amide C
O stretch of the ester bond from the grafted poly(HEMA). The presence of this ester peak indicates the successful modification of the primary poly(HEMA) polymer on membrane substrate. For comb-like PVCL modified membrane, the presence of the amide C![[double bond, length as m-dash]](https://www.rsc.org/images/entities/char_e001.gif) O stretch peak at 1630 cm−1 indicates the successful grafting of the secondary PVCL polymer on the primary chains. In addition, the disappearance of the hydroxyl group at 3000 cm−1 also confirms the grafting of PVCL. Overall, our ATR-FTIR spectra further demonstrate our two-step comb-like modification is successful.
O stretch peak at 1630 cm−1 indicates the successful grafting of the secondary PVCL polymer on the primary chains. In addition, the disappearance of the hydroxyl group at 3000 cm−1 also confirms the grafting of PVCL. Overall, our ATR-FTIR spectra further demonstrate our two-step comb-like modification is successful.
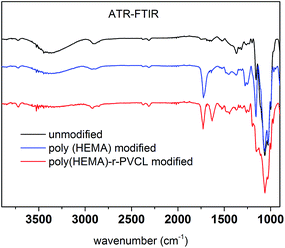 | ||
| Fig. 8 ATR-FTIR spectra of unmodified RC membrane, poly(HEMA) and poly(HEMA)-r-PVCL modified membranes. | ||
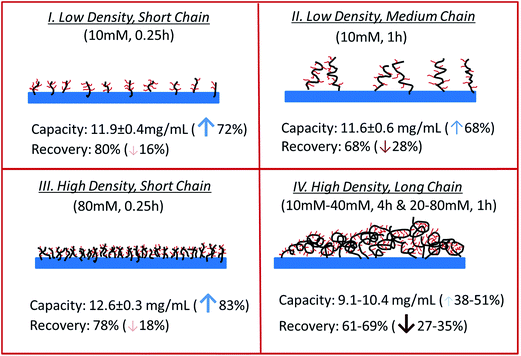
Table 1 summarizes the dynamic binding capacity and recovery under different primary poly(HEMA) modification conditions. Chromatograms are shown in Fig. S1 of the ESI.† For all the studies shown in the table, PVCL polymerization time is kept at 4 h with the same initiator immobilization condition (200 mM 2nd BIB). Binding capacity and recovery are plotted in Fig. 9 as a function of PVCL chain grafting density. It can be seen that DG has been improved 10–50 times compared to the DG value when PVCL chains are directly grafted on membrane substrate. However, the improvement for dynamic binding capacity is generally less than 2 times. Instead, a slight decrease in DBC has been observed with the increase of DG for membranes grafted with comb-like polymer architecture. The results show that unlike polymeric ion-exchange ligand,29 the relationship between DG of PVCL chains and DBC is not simply linear. Moreover, as it can be seen from Fig. 9b that recovery has clearly shown a decrease when DG increases. As schematically shown in Fig. 10, four different scenarios were proposed to illustrate the effects of grafted polymer architecture on DBC. Short poly(HEMA) chains (case I, III) give better improvement of capacity at around 12 mg mL−1 while maintaining the recovery close to 80%. On the other hand, long and high density poly(HEMA) chains (case IV) have a lower capacity of about 9 mg mL−1 while protein recovery is only at 60–70%. The capacity for low density and long chains (case II) remains at 11–12 mg mL−1 whereas recovery reduces to about 70%. Our previous results show that grafting degree of PVCL is generally less than 1% when grafted directly on RC membrane substrate. Moreover, our earlier data indicate that higher grafting degree results in higher dynamic binding capacities. The best performance for DBC is around 7 mg mL−1 and for recovery is over 96% when PVCL DG is about 0.2 μg cm−2. In the case of grating these comb-like block copolymers on RC membrane substrates, it is possible to increase the PVCL grafting degree to over 10%. BSA binding capacity reaches 12 mg mL−1 when the grafting degree is around 2 μg cm−2 with a reduced recovery of about 80%. Further increase in DG results in a significant reduction in capacity and further reduction in recovery. These results suggest that significant steric hindrance could occur for long primary poly(HEMA) polymer chains. Steric hindrance not only affects binding capacity, but also recovery particularly during dynamic binding test when kinetics plays a critical role. In conclusion our results suggest that short and relatively dense primary polymer chains give the best capacity and recovery for dynamic binding test of BSA for these comb-like PVCL ligands.
| Case ascribed | HEMA initiator (mM) | HEMA polymerization time (h) | PVCL (μg cm−2) | DBC (mg mL−1) | Recovery (%) |
|---|---|---|---|---|---|
| I | 10 | 0.25 | 1.8 | 11.9 ± 0.4 | 80 ± 3 |
| II | 10 | 1 | 5.1 | 11.6 ± 0.6 | 68 ± 4 |
| IV | 10 | 4 | 8.7 | 9.1 ± 0.9 | 63 ± 4 |
| IV | 20 | 1 | 6.7 | 10.1 ± 0.7 | 69 ± 4 |
| IV | 20 | 4 | 9.8 | 10.2 ± 0.5 | 64 ± 4 |
| IV | 40 | 1 | 7.0 | 10.4 ± 0.6 | 66 ± 3 |
| III | 80 | 0.25 | 2.1 | 12.6 ± 0.3 | 78 ± 3 |
| IV | 80 | 1 | 7.9 | 9.5 ± 0.4 | 61 ± 3 |
| Direct grafting of PVCL | 0.2 | 6.9 ± 0.3 | 96 ± 3 | ||
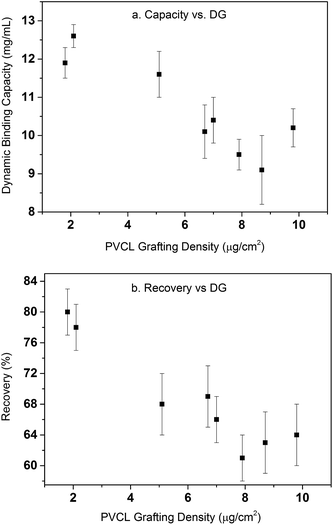 | ||
| Fig. 9 Dynamic binding capacity (a) and recovery (b) as a function of PVCL grafting density. Error bars are from the standard deviations of triplicate dynamic binding tests. | ||
The primary poly(HEMA) modified membrane surfaces were characterized in water with AFM at room temperature as shown in Fig. 11. Compared to the unmodified regenerated cellulose membrane, high density (160 mM BIB) or long chain (4 h ATRP) modified membranes show much less pore structure. The membrane pores are likely to be covered with grafted polymers as shown in Fig. 11a–d. The roughness for the membrane surfaces (10 μm × 10 μm) also shows an evident change of the surface morphology after modification (Fig. 12). The longer the ATRP time of poly(HEMA), the higher the roughness values are. The decrease of roughness for 4 h ATRP at high density is probably due to the full coverage of membrane's surface by the grafted polymer layer. Moreover, the stronger inter- and intra polymer-chain interactions could result in a smoother surface layer. The blockage of the pore structure can lead to reduced protein binding as well as decreased recovery because of the difficulty for protein to reach the bind sites and to elute out once they are bound.
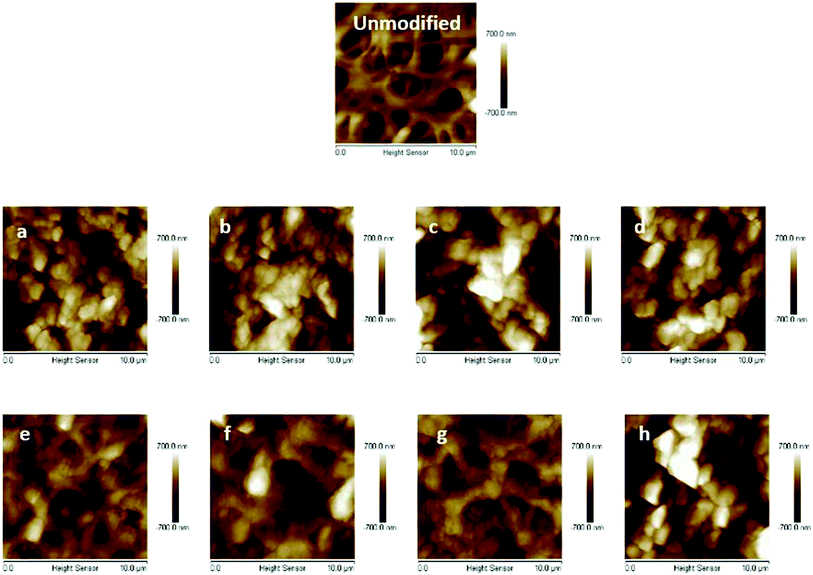 | ||
| Fig. 11 AFM results of unmodified membrane and comb-like PVCL modified membranes ((a–d), 160 mM BIB and 1, 2, 3 and 4 h ATRP of HEMA; (e–h), 40 mM BIB and 1–4 h ATRP of HEMA). | ||
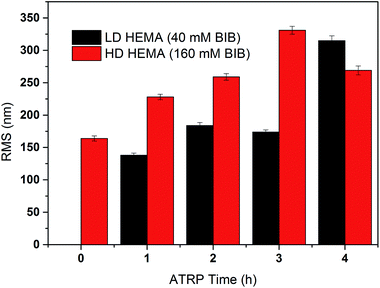 | ||
| Fig. 12 Measured roughness (Rq) of the comb-like modified membranes at high and low densities with different chain lengths (ATRP 1–4 h). | ||
Besides investigating the effects of the chain density and chain length of grafted primary poly(HEMA) chains, the effects of membrane pore size on protein binding and recovery were also studies. RC membranes with 1 μm and 0.45 μm pore sizes were modified with 15 min ATRP time of HEMA in order to prevent any possible blockage of pores after modification. Overall, the DG of poly(HEMA) and PVCL for 1 μm pore size membrane is about half of the DG for 0.45 μm pore size at the same initiator immobilization and polymerization conditions as shown in Table 2. This is probably due to the fact that the total surface area of 1 μm membrane is less than 0.45 μm membrane. Chromatograms of the dynamic binding tests are shown in ESI Fig. S2.† To our surprise, the recovery for 1 μm pore size RC membrane is even lower than that for the 0.45 μm pore size membrane. The contact angle of water for these two membranes further confirmed that 1 μm pore size membrane is more hydrophobic, which explains the low recovery results. The responsiveness of 1 μm pore size membrane to the presence of salt ions, measured by the contact angle differences between DI water and 1.8 M (NH4)2SO4 salt solution, is found to be less (<2°) than that (∼6°) of the 0.45 μm pore size membrane at the same conditions. Moreover, the contact angles in both DI water and salt solution for the 1 μm modified RC membrane are much higher than the corresponding ones for the 0.45 μm modified RC membrane. As is known, that the LCST of PVCL is strongly dependent on the molecular weight of the polymer chains.8 Higher molecular weight chains tend to have a reduced LCST. Since it is easier for molecules to diffuse through larger pores and that there is less crowding effect in larger pores, it is likely that the molecular weight of the PVCL chains grafted on 1 μm RC membrane is higher than the corresponding 0.45 μm one even though the grafting degree is lower. As a result, the PVCL chains are more hydrophobic when grafted on the 1 μm pore size membrane.
| Pore size | HEMA ATRP | [HEMA BIB] | DG HEMAa (%) | DG BIB (%) | DG PVCL (%) | DBC (mg mL−1) | Recovery (%) | Contact angle | |
|---|---|---|---|---|---|---|---|---|---|
| Water | 1.8 M (NH4)2SO4 | ||||||||
| a DG% = gram of grafted species × 100/gram of membrane. | |||||||||
| 1 μm | 15 min | 10 mM | 6.6 | 6.6 | 10.8 | 7.4 | 27 | 109.0° | 110.4° |
| 80 mM | 7.5 | 8.1 | 13.6 | 7.5 | 13 | 114.3° | 116.2° | ||
| 0.45 μm | 15 min | 10 mM | 11.3 | 11.6 | 19.6 | 11.9 | 80 | 98.2° | 104.6° |
| 80 mM | 13.2 | 13.5 | 23.7 | 12.6 | 78 | 96.2° | 102.2° | ||
In addition, the effects of grafted secondary PVCL chain density on protein binding and recovery were also investigated. As shown in Table 3, the 2nd initiator concentration for grafting PVCL varies from 10 mM to 160 mM while the primary polymer chain grafting conditions (10 mM BIB and 0.25 h ATRP for grafting poly(HEMA)) were kept the same. The corresponding DG value of grafted PVCL increases from 1.14 to 2.21 μm cm−2. Dynamic binding capacity also increases as the DG of PVCL increases, while the recovery shows a slight decline from 96% to 80%. From the contact angle measurement results under 1.8 M (NH4)2SO4 solution, it shows that the higher the density of PVCL, the higher the contact angle indicating the surface is more hydrophobic at higher density leading to a higher binding capacity. This study shows that there is likely a trade-off between the dynamic capacity and recovery. Similar results have also been observed in our previous work for linear PVCL grafted RC membranes.7 It is likely that when PVCL density is high, steric hindrance limits the mobility of the proteins leading to a lower recovery during dynamic binding tests. Based on our results, the initiator concentration for grafting PVCL needs to be kept below 80 mM if the required recovery is above 90%.
| VCL initiator (mM) | DG PVCL (μg cm−2) | DBC (mg mL−1) | Recovery (%) | Contact angle (1.8 M (NH4)2SO4) |
|---|---|---|---|---|
| 10 | 1.14 | 8.4 | 96 | 101.6 ± 1.0 |
| 20 | 1.37 | 8.8 | 96 | 104.0 ± 0.6 |
| 40 | 1.83 | 9.0 | 93 | 104.4 ± 1.7 |
| 80 | 2.05 | 9.1 | 84 | 105.5 ± 0.8 |
| 160 | 2.11 | 11.7 | 80 | 108.0 ± 0.3 |
In order to further explore the binding mechanism of our comb-like responsive PVCL ligands, the BSA binding isotherms were determined based on static protein adsorption studies. The results were fitted with the Freundlich adsorption model (eqn (2)), where qe is the binding capacity at the protein equilibrium concentration Ce. KF and 1/n are fitting parameters for a given adsorbant.
log![[thin space (1/6-em)]](https://www.rsc.org/images/entities/char_2009.gif) qe = log qe = log![[thin space (1/6-em)]](https://www.rsc.org/images/entities/char_2009.gif) KF + 1/n KF + 1/n![[thin space (1/6-em)]](https://www.rsc.org/images/entities/char_2009.gif) log log![[thin space (1/6-em)]](https://www.rsc.org/images/entities/char_2009.gif) Ce Ce
| (2) |
Unlike the linear PVCL which fits well with the Langmuir model, Freundlich model fits much better here for the comb-like PVCL ligands binding isotherm. Freundlich model has been widely applied to the highly interactive species adsorbed on the activated carbon or molecular sieves.30–32 It is also known as an empirical model applied to the multi-layer adsorption with a heterogeneous surface,30 whereas Langmuir model assumes monolayer adsorption. Therefore, the multi-layer adsorption is very likely to happen for our comb-like ligands, although not all the sites are available for BSA binding. As shown in Table 4, the slope of the fitting line (1/n) indicates the heterogeneity of the binding sites probably due to the steric hindrance effect. The PVCL ligands located on the out-layer of the poly(HEMA) chains are more accessible to protein. The denser the backbone is, the harder it becomes for protein to reach to the inner binding sites. As the results shown in Fig. 13, the slope is lower in a high-density poly(HEMA) condition, which means the binding sites are more heterogeneous when backbone chains become denser.
| Fitting equation | 1/n | KF | |
|---|---|---|---|
| HD poly(HEMA) backbone | y = 0.85x + 2.95 | 0.85 | 891.25 |
| LD poly(HEMA) backbone | y = 1.36x + 3.08 | 1.36 | 1202.26 |
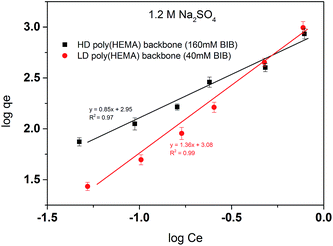 | ||
| Fig. 13 Freundlich linear fitting of BSA isotherm for comb-like HIC membranes. Two backbone densities were tested here with 40 mM and 160 mM BIB used in the first initiation step. | ||
5. Conclusions
We have successfully increased the grafting degree of PVCL on RC membranes by 10–40 times by introducing a primary poly(HEMA) brushes as backbones to grow the secondary PVCL brushes forming comb-like ligands. The effects of both primary and secondary polymer chain length and chain density on protein binding and recovery were systematically studied by varying the ATRP initiation and polymerization conditions. Based on the results of BSA capacity and recovery, the optimal DG of PVCL has been found to be 1–2 μg cm−2, where the capacity has improved from 7 to 12 mg mL−1, for the linear PVCL homopolymer brushes grafted directly on the membrane substrate while the recovery is maintained above 80%. Our results show that introducing long primary poly(HEMA) chains decreases the protein recovery dramatically with a limited improvement in binding capacity. Further increase in primary poly(HEMA) chain length decreases the BSA binding capacity. AFM measurements show that the pore could be blocked at high DG of PVCL. This can partly explain the low recovery results at long primary polymer chains. The self-interaction of collapsed brushes, which buried most of the binding ligands and made proteins difficult to approach to the ligands, is likely the reason for the limited improvement in binding capacity. Larger 1 μm pore size RC membranes showed a worse binding capacity and recovery than the 0.45 μm pore size membranes. The effects of PVCL chain density on protein binding and recovery demonstrate a trade-off between the two. The higher the PVCL DG value, the higher the contact angle of the membrane surface, and the higher the binding capacity. In contrast, the recovery decreases at higher PVCL DG value. Finally, BSA isotherm shows that it is likely to be a multi-layer adsorption model for the comb-like ligands grafted rather than the mono-layer adsorption model for the linear PVCL ligands. Based on the parameters obtained from Freundlich model, it was found that the heterogeneity of the binding sites increases as the primary poly(HEMA) chain density increases.Acknowledgements
Partial financial support from Arkansas Bioscience Institute is gratefully acknowledged.References
- S. Ghose, Y. Tao, L. Conley and D. Cecchini, mAbs, 2013, 5, 795–800 CrossRef PubMed.
- B. C. S. To and A. M. Lenhoff, J. Chromatogr. A, 2007, 1141, 191–205 CrossRef CAS PubMed.
- B. C. S. To and A. M. Lenhoff, J. Chromatogr. A, 2008, 1205, 46–59 CrossRef CAS PubMed.
- B. C. S. To and A. M. Lenhoff, J. Chromatogr. A, 2007, 1141, 235–243 CrossRef CAS PubMed.
- E. Haimer, A. Tscheliessnig, R. Hahn and A. Jungbauer, J. Chromatogr. A, 2007, 1139, 84–94 CrossRef CAS PubMed.
- S. M. Cramer and M. A. Holstein, Curr. Opin. Chem. Eng., 2011, 1, 27–37 CrossRef CAS.
- H. H. Himstedt, X. Qian, J. R. Weaver and S. R. Wickramasinghe, J. Membr. Sci., 2013, 447, 335–344 CrossRef CAS.
- F. Meeussen, E. Nies, H. Berghmans, S. Verbrugghe, E. Goethals and F. Du Prez, Polymer, 2000, 41, 8597–8602 CrossRef CAS.
- Y. Maeda, T. Nakamura and I. Ikeda, Macromolecules, 2001, 35, 217–222 CrossRef.
- H. Du, R. Wickramasinghe and X. Qian, J. Phys. Chem. B, 2010, 114, 16594–16604 CrossRef CAS PubMed.
- H. Fu, X. Hong, A. Wan, J. D. Batteas and D. E. Bergbreiter, ACS Appl. Mater. Interfaces, 2010, 2, 452–458 CAS.
- H. Du, S. R. Wickramasinghe and X. Qian, J. Phys. Chem. B, 2013, 117, 5090–5101 CrossRef CAS PubMed.
- K. Matyjaszewski, Macromolecules, 2012, 45, 4015–4039 CrossRef CAS.
- K. Matyjaszewski and J. Xia, Chem. Rev., 2001, 101, 2921–2990 CrossRef CAS PubMed.
- J. Wang, E. W. Jenkins, J. R. Robinson, A. Wilson and S. M. Husson, J. Membr. Sci., 2015, 492, 137–146 CrossRef CAS.
- H. C. S. Chenette, J. R. Robinson, E. Hobley and S. M. Husson, J. Membr. Sci., 2012, 423–424, 43–52 CrossRef CAS PubMed.
- N. Singh, J. Wang, M. Ulbricht, S. R. Wickramasinghe and S. M. Husson, J. Membr. Sci., 2008, 309, 64–72 CrossRef CAS.
- Z. Liu, H. Du, S. R. Wickramasinghe and X. Qian, Langmuir, 2014, 30, 10651–10660 CrossRef CAS PubMed.
- P. Król and P. Chmielarz, Prog. Org. Coat., 2014, 77, 913–948 CrossRef.
- Q. Yang and M. Ulbricht, Macromolecules, 2011, 44, 1303–1310 CrossRef CAS.
- Y. Ma, J. Dong, S. Bhattacharjee, S. Wijeratne, M. L. Bruening and G. L. Baker, Langmuir, 2013, 29, 2946–2954 CrossRef CAS PubMed.
- M. A. Mata-Gómez, S. Yaman, J. A. Valencia-Gallegos, C. Tari, M. Rito-Palomares and J. González-Valdez, J. Chromatogr. A, 2016, 1443, 191–200 CrossRef PubMed.
- Q. Yang, J. Tian, M.-X. Hu and Z.-K. Xu, Langmuir, 2007, 23, 6684–6690 CrossRef CAS PubMed.
- L.-S. Wan, Y.-F. Yang, J. Tian, M.-X. Hu and Z.-K. Xu, J. Membr. Sci., 2009, 327, 174–181 CrossRef CAS.
- H. H. Himstedt, Q. Yang, L. P. Dasi, X. Qian, S. R. Wickramasinghe and M. Ulbricht, Langmuir, 2011, 27, 5574–5581 CrossRef CAS PubMed.
- Q. Yang, H. H. Himstedt, M. Ulbricht, X. Qian and S. Ranil Wickramasinghe, J. Membr. Sci., 2013, 430, 70–78 CrossRef CAS.
- H. H. Himstedt, Q. Yang, X. Qian, S. Ranil Wickramasinghe and M. Ulbricht, J. Membr. Sci., 2012, 423–424, 257–266 CrossRef CAS.
- X. Qian, J. Lei and S. R. Wickramasinghe, RSC Adv., 2013, 3, 24280–24287 RSC.
- B. V. Bhut, K. A. Conrad and S. M. Husson, J. Membr. Sci., 2012, 390–391, 43–47 CrossRef CAS.
- K. Y. Foo and B. H. Hameed, Chem. Eng. J., 2010, 156, 2–10 CrossRef CAS.
- F. Haghseresht and G. Q. Lu, Energy Fuels, 1998, 12, 1100–1107 CrossRef CAS.
- M. Ahmaruzzaman, Adv. Colloid Interface Sci., 2008, 143, 48–67 CrossRef CAS PubMed.
Footnote |
| † Electronic supplementary information (ESI) available. See DOI: 10.1039/c7ra01499f |
| This journal is © The Royal Society of Chemistry 2017 |

