 Open Access Article
Characterization of humic acids extracted from a lignite and interpretation for the mass spectra†
Chu-Fan Wanga,
Xing Fan *a,
Fan Zhanga,
Shou-Ze Wanga,
Yun-Peng Zhaoa,
Xiao-Yan Zhaoa,
Wei Zhaoa,
Teng-Gao Zhub,
Jin-Li Luc and
Xian-Yong Wei*a
aKey Laboratory of Coal Processing and Efficient Utilization (Ministry of Education), School of Chemical Engineering and Technology, China University of Mining & Technology, Xuzhou, Jiangsu 221116, China. E-mail: fanxing@cumt.edu.cn; wei_xianyong@163.com; Tel: +86-13337938221 Tel: +86-516-83885951
bJiangxi Key Laboratory for Mass Spectrometry and Instrumentation, East China Institute of Technology, Nanchang, Jiangxi 330013, China
cNews Center of CUMT, China University of Mining & Technology, Jiangsu 221116, China
First published on 10th April 2017
Abstract
Humic acids obtained from a Chinese lignite via alkali treatment were analyzed using Fourier transform infrared spectroscopy and Orbitrap mass spectrometry coupled with an electrospray ion source (ESI-Orbitrap-MS). Raw coal and the corresponding residue were characterized via scanning electron microscopy and energy dispersive spectrometry. Over 4700 heteroatom-containing compounds with wide distributions of molecular mass and unsaturation degree were detected via the ESI-Orbitrap-MS, and around 60 percent of the detected species were found to be oxygen-containing compounds. In addition, van Krevelen diagram and double-bond equivalent (DBE) plot were introduced to provide more structural details of the compounds. For the species only containing C, H, and O (HACHO), condensed aromatic compounds with a DBE value over 20 only contained 1 or 2 oxygen atoms. Carboxyl- and hydroxyl-containing aliphatic compounds (CHCACs) were predominant in HACHO with 5 or 6 oxygen atoms. Both the CHCACs and aromatic carboxylic acids or phenols were grouped into clusters in the van Krevelen diagram to be recognized. The introduction of a nitrogen atom to the HACHO species was based on the structures of the HACHO species, which is also indicated by the van Krevelen diagram.
1 Introduction
Lignite, which accounts for around 40% of the global coal reserves, has an extremely complex structure and composition.1 It is regarded as an inferior fuel due to its low calorific value, high ash yield, and high contents of both moisture and organic oxygen.2,3 Moreover, carbon emission and acid rain mostly induced by coal burning led us to reconsider the utilization of coal in clean and highly efficient ways.4,5 Lignite is unsuitable for direct burning, but suitable for developing as a feedstock for value-added chemicals due to the high content of organic oxygen.6–8 It is reasonable to utilize lignite for non-fuel purposes and important to understand the molecular composition of the organic species present in lignite.Among all the non-fuel utilization methods for lignite, the method acquiring humic acids plays an important role because of the high demand for humic acids. Humic acids, consisting of different humic substances derived from the degradation of organic matter in flora and fauna, exist not only in soils, natural waters, sea sediment plants, and peat, but also in lignite and oxidized bituminous coal.9,10 It is a complex mixture of various acids containing substituted aromatic rings connected by various bridges, and the main oxygen-containing groups include carboxyl, alcoholic hydroxyl, and phenolic hydroxyl groups.11,12 Generally, humic acids were produced from lignite through sequential treatments with strong alkali and acid, which account for 10–80% of the organic matter in lignite.13 Peuravuori et al. obtained humic acids from Lakhra lignite via alkali separation with 2000 mL of alkaline mixture (0.5 M NaOH + 0.1 M Na4P2O7, 1![[thin space (1/6-em)]](https://www.rsc.org/images/entities/char_2009.gif) :
:![[thin space (1/6-em)]](https://www.rsc.org/images/entities/char_2009.gif) 1 in volume), followed by treatment with concentrated HCl solution.14
1 in volume), followed by treatment with concentrated HCl solution.14
Understanding the characteristics of humic acids acquired from lignite at the molecular level is important for effective, clean, and value-added utilization of coal.15,16 Modern instrumental analyses such as Fourier transform infrared spectroscopy (FTIR),17 scanning electron microscopy (SEM),18 and gas chromatography/mass spectrometry (GC/MS)19 have been applied in the characterization of the compositions of complex biomass/coal. Olivella and co-workers used analytical pyrolysis coupled with GC/MS to obtain the detailed molecular structure information of humic acids from Spanish leonardite coal.20 Sulfonate and sulfate were proven to be the most occurring states of sulfur in the coal. Shi et al. studied Geting bituminous coal using SEM and FTIR to learn the surface morphology of raw coal/extraction residue and structural details such as chemical functional groups, respectively.18 The extracts obtained from Geting bituminous coal through sequential solvent extraction contained more aliphatic components and less aromatic compounds compared with raw coal and its extraction residue. The combination of different analytical methods can promote in-depth investigation on the composition of humic acids that originate from lignite at the molecular level.
In this study, the process of acquiring humic acids from Shengli lignite was optimized by orthogonal experiments to achieve the highest yield. Both the raw coal and reaction residue were characterized using SEM and energy dispersive spectrometry (EDS). Humic acids were analyzed by FTIR and high-resolution MS. Statistical analysis of the mass spectra revealed the composition of humic acids at the molecular level.
2 Experimental
2.1 Samples and reagents
Shengli lignite was obtained from Xilinhaote located in Inner Mongolia, China, and pulverized to pass through a 150-mesh sieve followed by drying at 85 °C for 8 h in vacuum. Table 1 shows the proximate and ultimate analyses of the dried coal sample.| Proximate analysis | Ultimate analysis (daf) | ||||||
|---|---|---|---|---|---|---|---|
| Mad | Ad | Vdaf | C | H | N | S | Odiff |
| a Mad = moisture (air-dried base); Ad = ash (dry base, i.e., moisture-free base); Vdaf = volatile matter (dry and ash-free base); daf = dry and ash-free base; diff: by difference. | |||||||
| 12.52 | 16.69 | 43.44 | 74.28 | 4.27 | 1.08 | 1.13 | 19.24 |
Aqueous sodium hydroxide (0.21 mol L−1) and concentrated hydrochloric acid (37% in weight) were used in the reaction process. The analytical grade acetone was sequentially purified by distillation using a rotary evaporator (R-134, Büchi Labortechnik AG, Flawil, Switzerland) prior to use.
2.2 Orthogonal experiment
Single-factor experiments were conducted to reveal the relationship between the yield of humic acids and a single factor while keeping the other three factors constant. The influence of each factor was obtained and is shown in Fig. S1.† Then, orthogonal experiments were designed to optimize the experimental conditions and obtain the highest yield of humic acids. This indicated that the factors affect the yield of humic acids in the following order (from high to low): dosage of sodium hydroxide, dosage of water, reaction time, and reaction temperature (shown in the ESI†).2.3 Procedure for humic acid separation
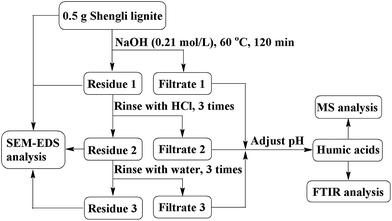
According to the optimized experimental conditions shown in Fig. 1, 5.0 g of dried coal sample and sodium hydroxide solution (300 mL, 0.21 mol L−1) were mixed in a round-bottom flask (500 mL). The flask was heated in a thermostat water bath at 60 °C for 120 min. Solid residue (residue 1) and soluble reaction mixture (filtrate 1) were separated through filtration using a membrane filter with an average pore size of 0.45 μm. Residue 1 was sequentially rinsed by hydrochloric acid and deionized water to obtain the filtrates 2 and 3. The mixture of filtrates 1 to 3 was acidified with concentrated hydrochloric acid solution (0.21 mol L−1) to adjust the pH value between 1 and 2, which was maintained for 12 h. Then, the mixture was centrifuged to separate the humic acid (precipitate) fraction. The yield of humic acid was 23.1%, according to eqn (1) shown in the ESI.† Table S3† shows the ultimate analysis of humic acids.2.4 Instrumentation
SEM and EDS (Quanta 250, FEI, Hillsboro, USA) were used to characterize the morphology of the raw coal and residue treated by alkali, acid, and water, as well as the corresponding element distribution on the surface. SEM was operated in high vacuum mode with 20 kV acceleration voltage and 3.0 nm resolution. A 20 nm gold layer was coated on the surface of the coal sample for EDS analysis with 20 kV operating voltage and 10 nm operating distance.Humic acids dissolved in acetone were analyzed using a high-resolution MS, ESI-Orbitrap-MS (LTQ Orbitrap XL, Thermo-Fisher Scientific, Waltham, USA). The MS was operated in a negative ion mode with 35 psi nebulizer pressure and 4 kV source voltage. Thermo Xcalibur Roadmap software Data Analysis 2.2 was used for peak selection and molecular formula assignment. The signal-to-noise ratio for peak detection was set to 3, and molecular formulas were assigned with a mass tolerance less than 3 ppm. The molecular formulas were limited to a maximum of 50 C, 100 H, 5 N, 10 O, and 2 S atoms.
Humic acids were also analyzed using FTIR spectroscopy (IR-560, Nicolet Co. Madison, USA). The spectra were obtained from 4000 to 400 cm−1 with 4 cm−1 resolution.
3 Results and discussion
3.1 FTIR analysis of humic acids
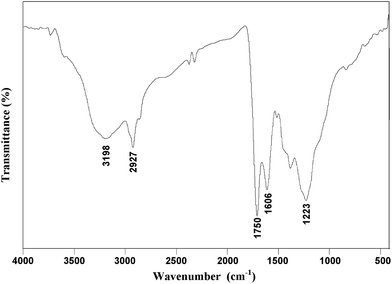
The FTIR spectrum of coal and its derivatives can be divided into four regions: 900–700 cm−1 (aromatic substitution), 1800–1000 cm−1 (O-containing groups), 3000–2800 cm−1 (aliphatic structure), and 3700–3000 cm−1 (hydrogen bond regions).21,22 As shown in Fig. 2, the absorbance peak at 3198 cm−1 is attributed to the stretch of hydroxyl groups in the humic acids obtained from Shengli lignite. CH2- and CH3-containing structures with an absorbance band around 2927 cm−1 correspond to aliphatic species. The strong absorption peak at 1606 cm−1 is attributed to the skeletal vibration of the aromatic rings. The results indicate that humic acids have an aromatic structure and contain aliphatic side chains. The strong peak at 1750 cm−1 indicates the existence of keto C![[double bond, length as m-dash]](https://www.rsc.org/images/entities/char_e001.gif) O or carboxyl C
O or carboxyl C![[double bond, length as m-dash]](https://www.rsc.org/images/entities/char_e001.gif) O groups, and the broad absorbance band around 1223 cm−1 is attributed to the C–O stretching vibration in phenol, ether or alcohol functional groups.
O groups, and the broad absorbance band around 1223 cm−1 is attributed to the C–O stretching vibration in phenol, ether or alcohol functional groups.
Compared with humins obtained from biomass sources such as chitin, there are more aromatic rings but few N-containing compounds in the humic acids obtained from lignite according to the corresponding FTIR spectra. Chitin is rich in C–N and N–H bonds,23 whereas there are many aromatic rings in lignite.24 The distribution of chemical groups in humins was determined by the origin of the feedstock. However, humins obtained from both chitin and lignite have absorption peaks attributed to the vibrations of –OH, –CH2, –CH3, C–O, and C![[double bond, length as m-dash]](https://www.rsc.org/images/entities/char_e001.gif) O groups, suggesting widespread existence of –OH and –COOH, as well as aliphatic structures in humins.
O groups, suggesting widespread existence of –OH and –COOH, as well as aliphatic structures in humins.
3.2 SEM and EDS analyses of the raw coal/residues
Fig. 3 shows the morphology of the raw coal and residues after treatments with alkali, acid, and water, which were characterized by SEM. The corresponding elemental distributions on the sample surface were obtained via EDS and are shown in Fig. 4. From Fig. 4(a), it was observed that the major elemental compositions on the surface of raw coal were C and O, with minor Al and Ca attributed to clay minerals such as kaolinite, illite, and smectite, or carbonates such as calcite and siderite.25,26 After the treatment of the alkali, parts of humic acids near the surface were removed, leaving a coarse surface (Fig. 3(b)). As shown in Fig. 4(b), Na was concentrated on the surface, which might exist in the form of –ONa and –COONa crystalline structures originating from the reactions between –OH/–COOH of coal molecules and introduced Na+. Moreover, some protuberant needle-like crystalline material on the surface, as shown in Fig. 3(b), might be the –ONa and –COONa substances. Sulfur was detected on the residue surface by EDS after treatment with alkali. There was no introduction of sulfur during the treatment. The possible reason was that alkali treatment induced removal of humic acids close to the surface and exposed the interior parts containing sulfur. Alkali treatment is conducive to a coal desulfurization reaction.27–29 The surface of the residue became smooth (Fig. 3(c)), and the content of Na was obviously reduced after treatment with acid. After rinsing with an aqueous acid, ions such as Al3+ and Ca2+ were dislodged and Cl was introduced (Fig. 4(c)). Fig. 4(d) shows that the major elements left on the surface of the residue were C and O after the sequential treatments with alkali, acid, and water, indicating that inorganic components in the raw coal were removed and organic components were left on the surface. The results acquired from SEM and EDS are consistent with the theory of supramolecular structures of humic substances proposed by Piccolo and co-workers.30 Alkali destroyed the hydrogen bond, van der Waals force, and π–π interaction not only within humic acids but also between humic acids and the rest of the raw coal, which provided the separation of humic acids from the raw coal.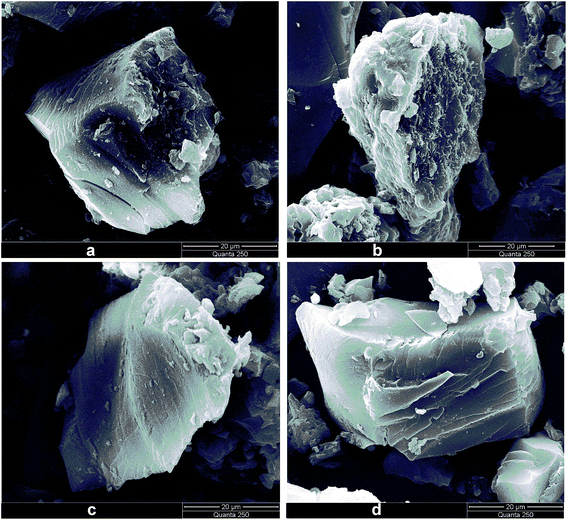 | ||
| Fig. 3 SEM images of (a) raw coal, (b) alkali extraction residue, (c) acid washed residue, and (d) water washed residue. | ||
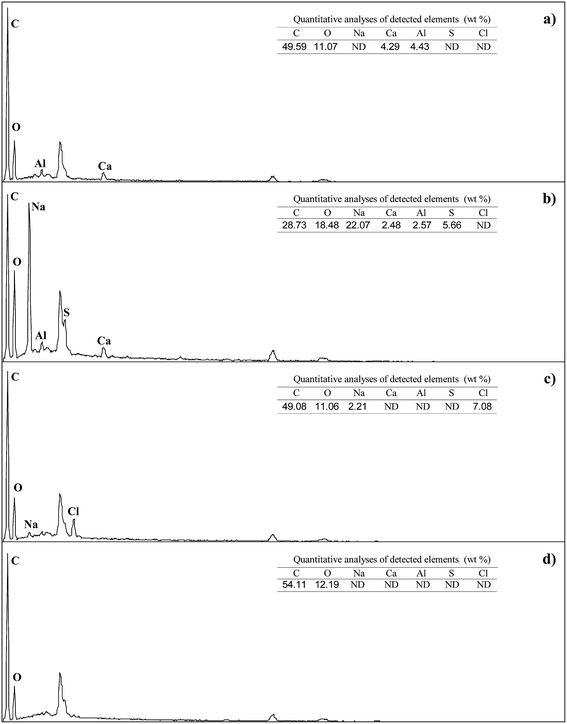 | ||
| Fig. 4 EDS spectra of (a) raw coal, (b) alkali extraction residue, (c) acid washed residue, and (d) water washed residue; ND = not detected. | ||
3.3 MS analysis for humic acids
ESI-Orbitrap-MS resolved more than 4800 organic species in the humic acid extract, and heteroatom-containing compounds account for over 99% of the identified components. Polar organic species can be efficiently ionized under an ESI mode.24,31 Thus, non- and low-polar compounds, such as hydrocarbons, were not readily accessible. Another reason is that hydrocarbons cannot react well with sodium hydroxide solution to generate water-soluble organic salts,32 which hampers their presence in the following humic acid extract.Around 60% of the detected species in the humic acids were oxygen-containing compounds (OCCs) with hydroxyl, carboxyl, and other functional groups. The OCCs are divided into six groups according to the number of oxygen atoms in a molecule: OCCs1, OCCs2, OCCs3, OCCs4, OCCs5, and OCCs6. The number of OCCs in each group is 668, 511, 535, 413, 323, and 331, respectively. The distribution of the relative content of OCCs is shown in Fig. 5. The content of OCCs1 is the highest, which accounts for 68.2% of the total content of OCCs. Hydroxyl and carboxyl groups are the main oxygen-containing groups in humic acids, which induce hydrogen bonding inside the raw coal.33,34 With the increase of oxygen atoms in OCCs, the number of oxygen-containing groups increases that strengthen the non-covalent interactions, inducing the enhancement of difficulty in separating OCCs from the raw coal.
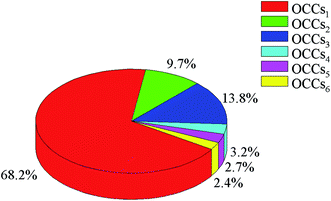 | ||
| Fig. 5 Relative content distribution of OCCs1, OCCs2, OCCs3, OCCs4, OCCs5, and OCCs6 detected in humic acids via ESI-Orbitrap-MS. | ||
Heteroatom-containing compounds can be classified at the molecular level according to the chemical formula. There are various classes of heteroatom-containing compounds such as Oo, OoNn, and OoSs in humic acids. The van Krevelen diagram was proposed to plot molar H/C versus O/C.35 The plot can provide the atomic ratio of the compounds and display the compounds with different composition by distinct points. In recent years, the van Krevelen plot has been introduced to analyze the complex data obtained from mass spectrometry with ultrahigh resolving power.36,37 Double bond equivalent (DBE) is widely used to estimate the unsaturation degree of organic compounds according to the chemical formula, which can be further used to provide the proposed structural information.38
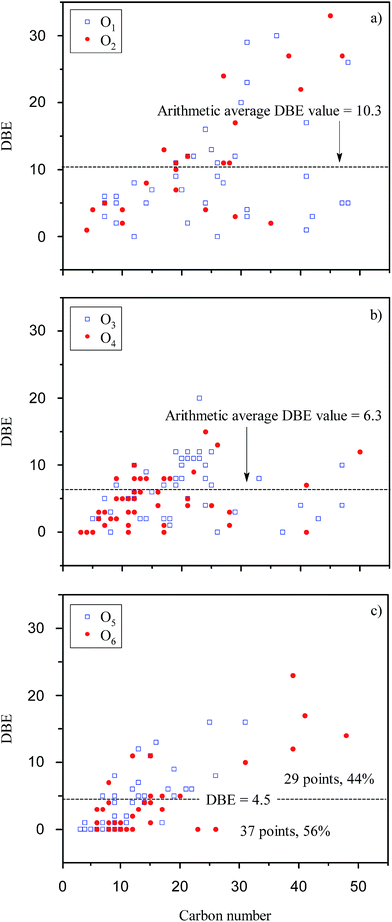
The van Krevelen diagram and DBE plot for O1 to O6 classes are shown in Fig. 6 and 7, respectively. In the van Krevelen diagram, homologous lines such as lines A, B, and C, as shown in Fig. 6(c), consist of compounds (points in the diagram) from the same alkylation series. Compound CcHhOo (c, h, and o represent the number of atoms C, H, and O, respectively) and its homologous species Cc+nHh+2nOo (n = ±1, ±2, ±3…) are on the homologous line of Y = ((h − 2c)/o)X + 2, which intersects with the Y axis at (0, 2). When the oxygen number is constant, a higher slope of the homologous line means a higher saturation degree for the compounds on the line. Slopes of line A and line B are greater than 0; thus, the points on the line A or B represent a series of saturated chain organic species containing hydroxyl groups and/or ether bonds. Classes O1 and O2 have lower O/C ratios compared to O3 to O6 classes due to the lower number of oxygen. Acid groups such as –COOH and –OH are detected in the negative ion mode; thus, classes O1 and O2 are more likely attributed to the compounds with –OH and –COOH/double –OH, respectively. In Fig. 7, there are 15% of compounds with a DBE value over 20 in O1 and O2 classes, whereas almost no such compounds were identified in other Oo classes. These high DBE compounds are mainly attributed to polycyclic aromatics with acid groups or O-containing heterocycles such as furan. The van Krevelen diagram can also graphically distinguish the compounds into different clusters. The distance between the two points in the van Krevelen diagram represents the difference in the chemical structure between the two corresponding compounds,39 such that the compounds in one cluster should have a similar structure. DiDonato et al. found that compounds of humic substances derived from soil can be classified into different types of molecules with similar aromaticity or unsaturation degree by a van Krevelen diagram according to the MS data.40 In classes O5 and O6 (Fig. 6(c)), 40% of the unsaturated species are concentrated in the region that spans between H/C from 1.5 to 2.0 and O/C from 0.2 to 0.5. The point corresponding to the compound with the highest unsaturation degree locates in the lower left corner of this region. In Fig. 6(c), point D (C19H32O5) has the highest DBE value of 4 among all the compounds in the blue region. Considering the existence of –COOH, there are few aromatic ring structures for compounds because the minimum DBE number is five for the compounds containing an aromatic ring plus a –COOH group. Thus, O5 and O6 species in the blue region are mainly attributed to carboxyl- and hydroxyl-containing aliphatic compounds (CHCACs). CHCACs account for 60% of O5 and O6 species, and the similar result was also found, as shown in Fig. 7(c). For O3 and O4 classes, as shown in Fig. 6(b), there is a new region that spans between H/C from 1.0 to 1.5 and O/C from 0.1 to 0.4. Compounds in this region have DBE values from 4 to 10 that are attributed to aromatic carboxylic acids or phenols (ACAPs) with 1–2 rings.
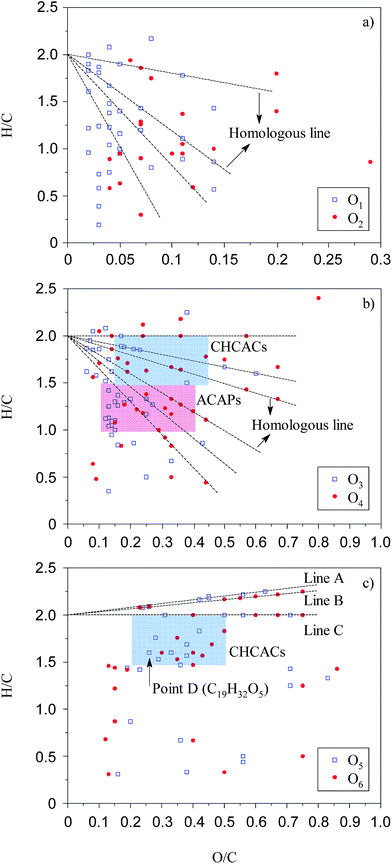 | ||
| Fig. 6 van Krevelen diagram for O1 to O6 species. Blue and red regions are defined as CHCACs and ACAPs regions, respectively. | ||
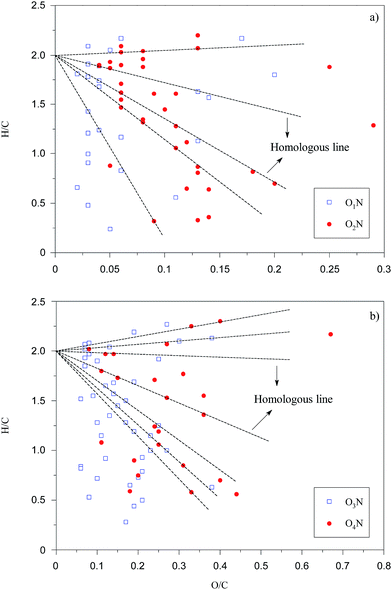
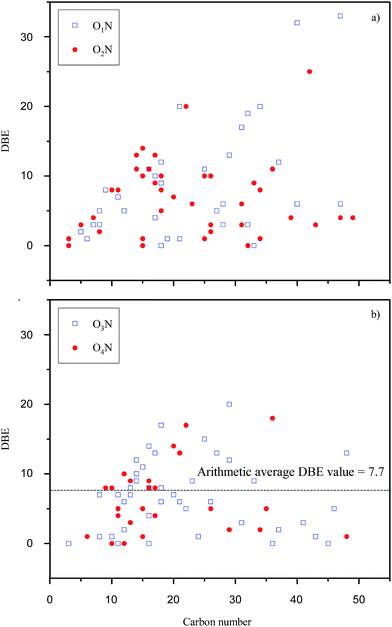
Organic compounds containing S and N in humic acids can develop high affinity for metal cations in soil and water, which has great significance to environmental chemistry in heavy metals.41 Thus, O1N to O4N were also studied through van Krevelen diagrams (Fig. 8) and DBE plots (Fig. 9). In Fig. 8, the points of O1N to O4N species are concentrated in clusters with a position similar to that of O1 to O4 species, as shown in Fig. 6, indicating that the introduction of a nitrogen atom into O1N to O4N species is based on the structures of the O1 to O4 species. Compared with O3 and O4 species, as shown in Fig. 7(b), the DBE distributions for O3N and O4N species are more scattered. Moreover, an increment of 1.4 in the arithmetic average DBE for O3N and O4N species compared with that for O1 to O4 species is probably attributed to the introduction of a N-containing ring. Compared with pyridine groups, pyrrole groups are easier to be ionized via deprotonation in the negative ion mode.42 The introduction of pyrrole groups also leads to a decrement of 0.03 in the average O/C ratio for O3N and O4N species compared to the species shown in Fig. 6(b).
S-containing molecules are typically less polar than N-containing compounds and not easily ionized by ESI.43,44 There is no Ss species detected under the negative ion mode because Ss species such as thioethers and thiophenes are not efficiently ionized. However, for OoS species, the existence of acid groups enhances the molecular polarity and further increases the ionization efficiency. As shown in Fig. S3,† the OoS species have a wide distribution of DBE from 0 to 32. The arithmetic average DBE value of OoS species is lower than that of the corresponding Oo species, which is probably due to few OoS species with DBE over 20. Therefore, there are few condensed aromatic compounds with over 6 rings in the OoS species.
4 Conclusions
From the SEM images and EDS spectra of the raw coal and residues after alkali treatment, it can be inferred that alkali treatment is conducive to a coal desulfurization reaction. Humic acids from Shengli lignite are rich in hydroxyl and carboxyl groups, as determined from FTIR analysis. Over 4700 heteroatom-containing compounds (oxygen, nitrogen, and sulfur) with wide distributions of molecular mass and unsaturation degrees were detected because of the selectivity of ESI and the high resolving power of MS. OCCs accounts for 60% of the detected species. Based on the van Krevelen diagrams, more structural information was proposed. Condensed aromatic compounds with over 6 rings were only detected in the O1 and O2 classes. CHCACs are predominant species in the O5 and O6 classes, whereas there are both CHCACs and ACAPs with 1–2 rings in the O3 and O4 classes. For the OoN species, one pyrrole group was introduced based on the structures of the corresponding Oo species.Acknowledgements
This work was supported by the National Natural Science Foundation of China (Grant 21676293), the Fundamental Research Funds for the Central Universities (China University of Mining & Technology, Grant 2015QNA23), the Fund from Jiangxi Key Laboratory for Mass Spectrometry and Instrumentation (East China Institute of Technology; Grant JXMS201504), and a Project Funded by the Priority Academic Program Development of Jiangsu Higher Education Institutions.References
- V. Taseska-Gjorgievskaa, A. Dedinec, N. Markovska, J. Pop-Jordanov, G. Kanevce, G. Goldstein and S. Pye, Therm. Sci., 2014, 18, 721–730 CrossRef.
- P. Nolan, A. Shipman and H. Rui, Eur. Manag. J., 2004, 22, 150–164 CrossRef.
- K. Ouchi, K. Shiraishi, H. Itoh and M. Makabe, Fuel, 1981, 60, 471–473 CrossRef CAS.
- X. S. Cong, Z. M. Zong, Z. H. Wei, Y. Li, X. Fan, Y. Zhou, M. Li, Y. P. Zhao and X. Y. Wei, Energy Fuels, 2014, 28, 6745–6748 CrossRef CAS.
- X. Fan, Y. R. Yu, J. L. Xia, Y. P. Zhao, J. P. Cao, Y. Lu, X. M. Yue, T. G. Zhu, X. Y. Wei and J. L. Lu, Rapid Commun. Mass Spectrom., 2017, 31, 503–508 CrossRef CAS PubMed.
- K. Mae, H. Shindo and K. Miura, Energy Fuels, 2001, 15, 611–617 CrossRef CAS.
- D. L. Shi, X. Y. Wei, B. Chen, Y. Lu, L. Li, Y. G. Wang, P. Li, L. Zhao, Z. M. Zong, W. Zhao, X. Fan and Y. P. Zhao, Energy Sources, Part A, 2013, 35, 2166–2172 CrossRef CAS.
- X. Fan, M. Wang, L. Chen, S. Z. Wang, T. G. Zhu, X. Y. Wei, J. P. Cao, Y. P. Zhao, W. Zhao and R. Y. Wang, Anal. Lett., 2016, 49, 2907–2916 CrossRef CAS.
- M. Kurková, Z. Klika, C. Kliková and J. Havel, Chemosphere, 2004, 54, 1237–1245 CrossRef PubMed.
- H. A. Al-Abadleh, RSC Adv., 2015, 5, 45785–45811 RSC.
- K. Wang and B. Xing, J. Environ. Qual., 2005, 34, 342–349 CrossRef CAS PubMed.
- R. L. Malcolm and P. MacCarthy, Environ. Sci. Technol., 1986, 20, 904–911 CrossRef CAS PubMed.
- S. Nasir, T. B. Sarfaraz, T. V. Verheyen and A. Chaffee, Fuel Process. Technol., 2011, 92, 983–991 CrossRef CAS.
- J. Peuravuori, P. Žbánková and K. Pihlaja, Fuel Process. Technol., 2006, 87, 829–839 CrossRef CAS.
- A. L. Zheng, X. Fan, F. J. Liu, X. Y. Wei, S. Z. Wang, Y. P. Zhao, Z. M. Zong and W. Zhao, Fuel Process. Technol., 2014, 117, 60–65 CrossRef CAS.
- B. Chen, X. Y. Wei, Z. M. Zong, Z. S. Yang, Y. Qing and C. Liu, Appl. Energy, 2011, 88, 4570–4576 CrossRef CAS.
- Y. P. Zhao, W. W. Zhu, X. Y. Wei, X. Fan, J. P. Cao, Y. Q. Dou, Z. M. Zong and W. Zhao, Bioresour. Technol., 2013, 142, 504–509 CrossRef CAS PubMed.
- D. L. Shi, X. Y. Wei, X. Fan, Z. M. Zong, B. Chen, Y. P. Zhao, Y. G. Wang and J. P. Cao, Energy Fuels, 2013, 27, 3709–3717 CrossRef CAS.
- Y. Lu, X. Y. Wei, Z. Wen, H. B. Chen, Y. C. Lu, Z. M. Zong, J. P. Cao, S. C. Qi, S. Z. Wang and L. C. Yu, Fuel Process. Technol., 2014, 117, 8–16 CrossRef CAS.
- M. A. Olivella, J. Del Río, J. Palacios, M. A. Vairavamurthy and F. de las Heras, J. Anal. Appl. Pyrolysis, 2002, 63, 59–68 CrossRef CAS.
- N. E. Cooke, O. M. Fuller and R. P. Gaikwad, Fuel, 1986, 65, 1254–1260 CrossRef CAS.
- Z. H. Qin, H. Chen, Y. J. Yan, C. S. Li, L. M. Rong and X. Q. Yang, Fuel Process. Technol., 2015, 133, 14–19 CrossRef CAS.
- X. Chen, S. L. Chew, F. M. Kerton and N. Yan, Green Chem., 2014, 16, 2204–2212 RSC.
- X. Fan, C. F. Wang, C. Y. You, X. Y. Wei, L. Chen, J. P. Cao, Y. P. Zhao, W. Zhao, Y. G. Wang and J. L. Lu, RSC Adv., 2016, 6, 105780–105785 RSC.
- S. V. Vassilev and J. M. D. Tascon, Energy Fuels, 2003, 17, 271–281 CrossRef CAS.
- C. R. Ward, Int. J. Coal Geol., 2002, 50, 135–168 CrossRef CAS.
- S. Cheah, D. L. Carpenter and K. A. Magrini-Bair, Energy Fuels, 2009, 23, 5291–5307 CrossRef CAS.
- B. Baruah and P. Khare, Energy Fuels, 2007, 21, 2156–2164 CrossRef CAS.
- Y. F. Shen, X. Y. Liu, T. H. Sun and J. P. Jia, RSC Adv., 2012, 2, 8867–8882 RSC.
- A. Piccolo, Soil Sci., 2001, 166, 810–832 CrossRef CAS.
- J. L. Xia, X. Fan, C. Y. You, X. Y. Wei, Y. P. Zhao and J. P. Cao, J. Sep. Sci., 2016, 39, 2491–2498 CrossRef CAS PubMed.
- F. A. Carey and R. A. Sundberg, Advanced Organic Chemistry, Springer, New York, 2007 Search PubMed.
- R. Sutton and G. Sposito, Environ. Sci. Technol., 2005, 39, 9009–9015 CrossRef CAS PubMed.
- A. Piccolo, Adv. Agron., 2002, 75, 57–134 CAS.
- D. Van Krevelen, Fuel, 1950, 29, 269–284 CAS.
- T. Ohno, Z. Q. He, R. L. Sleighter, C. W. Honeycutt and P. G. Hatcher, Environ. Sci. Technol., 2010, 44, 8594–8600 CrossRef CAS PubMed.
- N. Hertkorn, R. Benner, M. Frommberger, P. Schmitt-Kopplin, M. Witt, K. Kaiser, A. Kettrup and J. I. Hedges, Geochim. Cosmochim. Acta, 2006, 70, 2990–3010 CrossRef CAS.
- X. Fan, J. Jiang, L. Chen, C. C. Zhou, J. L. Zhu, T. G. Zhu and X. Y. Wei, Fuel Process. Technol., 2016, 142, 54–58 CrossRef CAS.
- S. Kim, R. W. Kramer and P. G. Hatcher, Anal. Chem., 2003, 75, 5336–5344 CrossRef CAS PubMed.
- N. DiDonato, H. Chen, D. Waggoner and P. G. Hatcher, Geochim. Cosmochim. Acta, 2016, 178, 210–222 CrossRef CAS.
- D. Hesterberg, J. W. Chou, K. J. Hutchison and D. E. Sayers, Environ. Sci. Technol., 2001, 35, 2741–2745 CrossRef CAS PubMed.
- M. Wang, X. Fan, X. Y. Wei, J. P. Cao, Y. P. Zhao, S. Z. Wang, C. F. Wang and R. Y. Wang, Fuel, 2016, 183, 115–122 CrossRef CAS.
- Z. G. Wu, R. P. Rodgers and A. G. Marshall, Fuel, 2005, 84, 1790–1797 CrossRef CAS.
- X. Fan, J. L. Zhu, A. L. Zheng, X. Y. Wei, Y. P. Zhao, J. P. Cao, W. Zhao, Y. Lu, L. Chen and C. Y. You, J. Anal. Appl. Pyrolysis, 2015, 115, 16–23 CrossRef CAS.
Footnote |
| † Electronic supplementary information (ESI) available. See DOI: 10.1039/c7ra01497j |
| This journal is © The Royal Society of Chemistry 2017 |

