
 Open Access Article
 This Open Access Article is licensed under a
 Creative Commons Attribution 3.0 Unported Licence
Selective turn-on near-infrared fluorescence probe for hypoxic tumor cell imaging†
Chen Jina,
Qiumeng Zhanga and
Wei Lu *ab
*ab
aSchool of Chemistry and Molecular Engineering, East China Normal University, 3663 North Zhongshan Road, Shanghai 200062, P. R. China. E-mail: wlu@chem.ecnu.edu.cn; Tel: +86-21-62238771
bState Key Laboratory of Fine Chemicals, Dalian University of Technology, Dalian 116024, P. R. China
First published on 27th March 2017
Abstract
Hypoxia is a typical feature of solid tumors. To detect hypoxic tumor cells, we designed new selective turn-on probes by conjugating (1-methyl-2-nitro-1H-imidazol-5-yl)methanol to the near-infrared fluorescence probe DCPO through an ether linkage and bis-carbamate linkage specifically. The proposed activation mechanism was demonstrated through the nitroreductase and cytochrome P450 assays in vitro. However, two probes revealed different hypoxia selectivities when evaluated on H460, HeLa and A549 cell lines. The hypoxia selectivity of IOD was higher than that of IND. The probe IOD (containing the ether linkage) was considered to be a promising hypoxia-selective fluorescent probe.
Introduction
Hypoxia is a typical feature influencing many aspects of the biology of solid tumors. Most solid tumors have chronic hypoxic conditions within highly disorganized vascular networks since the intercapillary distances are often greater than the diffusion range of oxygen.1 As the distance from the vessel changes, the oxygen tension, nutrients, cellular metabolites, cell proliferation, and extracellular pH gradients vary as well. Hypoxia affects many aspects of tumor biology including selection of genotypes favoring survival under a hypoxic microenvironment, pro-survival changes in gene expression that suppress apoptosis and support autophagy, and the anabolic switch in central metabolism.2–6 These genetic alterations allow tumor cells to survive and even grow in such a harsh environment. Hypoxia is also an important contributor to tumor angiogenesis, vasculogenesis, invasiveness, metastasis, chemoresistance, and radioresistance.7–9 Furthermore, owing to its unique features (which are rarely seen in normal tissue) hypoxia has been considered a primary target in cancer therapy.10 Therefore, developing efficient methods for hypoxia detection is of great importance.In solid tumors, the over-expressed reductive enzyme level corresponds with the hypoxic status. 2-Nitroimidazole has been demonstrated to be converted to 2-aminoimidazole via a series of bioreductions in hypoxic microenvironments.11–16 2-Nitroimidazole-based derivatives including pimonidazole,17 EF5,18 18F-FMISO, and 18F-FAZA19 (Fig. 1) have been used to selectively label the hypoxic area of tumors via PET (positron emission tomography). However, the disadvantage that a radioactive tracer must be injected into patients is the main problem with PET.
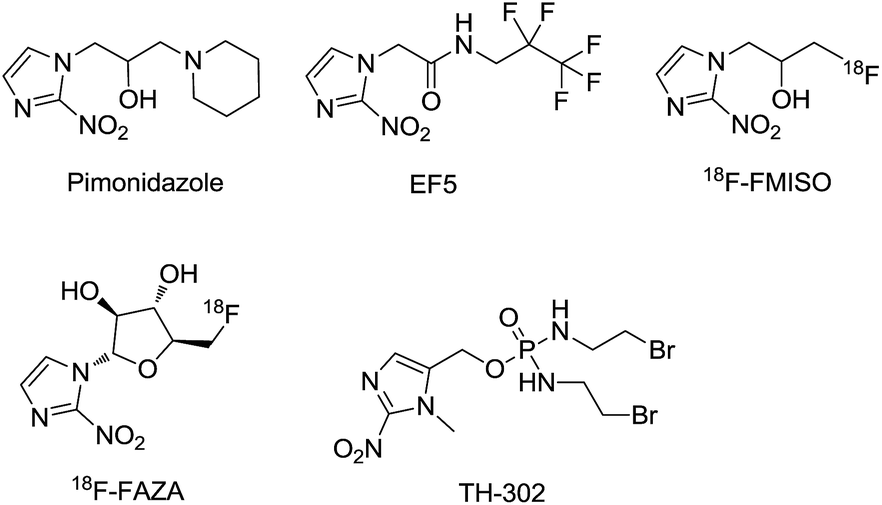 | ||
| Fig. 1 Chemical structures of pimonidazole, EF5, 18F-FMISO, 18F-FAZA and evofosfamide (TH-302). | ||
Near-infrared (NIR) fluorescent dyes have been widely used for monitoring biological processes in cells and organisms.20–28 In general, NIR fluorophores emit fluorescence in the range of 650–900 nm. Compared with PET, NIR probes possess the advantages of minimal photo-damage to biological samples, deep tissue penetration, and low background auto-fluorescence. (E)-2-(2-(4-Hydroxystyryl)-4H-chromen-4-ylidene)malononitrile (DCPO) and its derivatives are photostable and widely used in the detection of cathepsin B, hydrogen peroxide, and GLUT-1.29–34
Several works have reported the targeting of hypoxic tumors with turn-on fluorescent probes containing a bioreductive nitro group or azo group.35–42 However, (1-methyl-2-nitro-1H-imidazol-5-yl)methanol, which was applied in the clinical hypoxia-activated prodrug evofosfamide (TH-302)43 and considered an effective bioreductive molecule, has been sparingly used in the development of hypoxia imaging. Recently, Grimm reported a dual-input fluorogenic probe using (1-methyl-2-nitro-1H-imidazol-5-yl)methanol.44 Though the probe was demonstrated to be effective via the bioreduction of nitroreductase, it did not investigate the selectivity between hypoxic and normoxic cell imaging.
In this paper, we proposed new hypoxic fluorescent probes based on (1-methyl-2-nitro-1H-imidazol-5-yl)methanol. The near-infrared fluorescence OFF–ON switch could be triggered by nitroimidazole via the transformation of a masked phenol unit to a phenolic hydroxyl group. In normal tissues, no fluorescence was observed via the Förster resonance energy transfer (FRET) mechanism caused by the electron acceptor nitro group. Conversely, in hypoxic solid tumors, the hypoxia-specific nitro-to-amino reduction activated the nitroimidazole trigger and generated red-fluorescence (Fig. 2). The ether linkage and bis-carbamate linkage were specifically used to connect (1-methyl-2-nitro-1H-imidazol-5-yl)methanol and DCPO. The most important of this study was that, two fluorescent probes revealed different properties upon biological evaluation. Probe IOD containing ether linkage was evaluated to be better than probe IND containing bis-carbamate linkage.
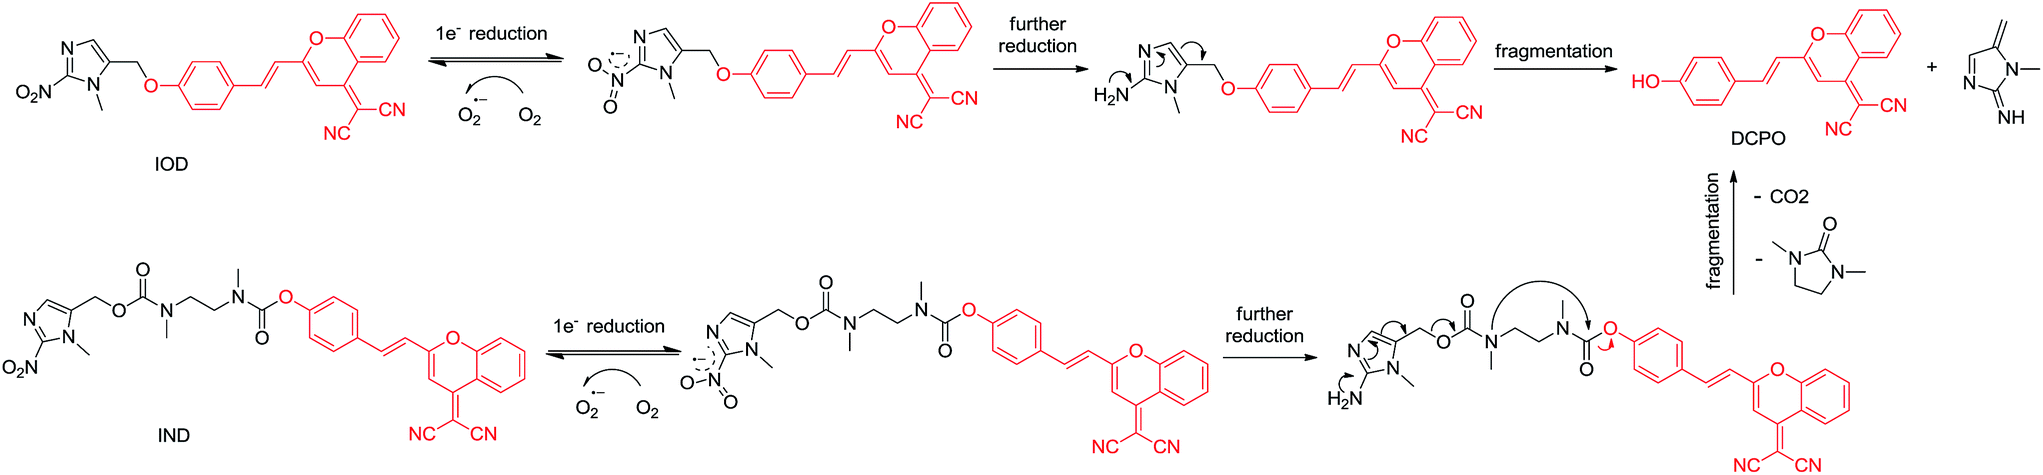 | ||
| Fig. 2 Proposed mechanism of probes activated via enzymatic metabolism under hypoxic condition. | ||
Experimental
Material and methods
1H and 13C nuclear magnetic resonance (NMR) spectra were recorded on a Bruker DRX-400 MHz spectrometer (400 and 101 MHz, respectively) using CDCl3, or DMSO-d6 as solvents with TMS as an internal standard. Chemical shifts were reported as d (ppm) and spin–spin coupling constants as J (Hz) values. The mass spectra (MS) were recorded on a Finnigan MAT-95 mass spectrometer. Melting points were taken on a SGW X-4 melting point apparatus, uncorrected and reported in degrees centigrade. Column chromatography was performed with silica gel (200–300 mesh). UV-vis absorption spectra were recorded on a Varian Cary 100 spectrophotometer. Fluorescence spectra were measured with a Hitachi F-4500 Fluorescence spectrophotometer. Cells were taken photos on an inverted fluorescence microscope (Olympus DP80). The average fluorescence intensity was given by the flow cytometry assay on a Guava easyCyte HT system.Nitroreductase from Escherichia coli and NADPH were purchased from Sigma-Aldrich. Mouse liver microsomes (20 mg mL−1) were purchased from Corning. Human lung cancer cell line H460, human cervical cancer cell line HeLa and human lung adenocarcinoma cell line A549 were purchased from the Shanghai Institute of Biochemistry and Cell Biology (Shanghai, China). The cell culture fluid and FBS were purchased from Thermo Fisher Scientific. All of the starting materials are commercially available and were used without further purification.
Ethical statement
We state that all experiments with live subjects were performed in compliance with the Laboratory Animal Management Regulations of the People's Republic of China and the Three Rs (Replacement, Reduction, and Refinement) strategy of William Russell and Rex Burch, and the Animal Ethical and Welfare Committee of East China Normal University has approved the experiments.Synthetic procedures
![[thin space (1/6-em)]](https://www.rsc.org/images/entities/char_2009.gif) :EtOAc = 10:1) to afford compound 2 (50 mg, 95%) as yellow solid. Mp 96–98 °C. 1H NMR (400 MHz, CDCl3) δ 7.19 (s, 1H), 4.62 (s, 2H), 4.07 (s, 3H). MS (ESI): m/z calcd for C5H7ClN3O2 [M + H]+: 175.01, found: 175.87.:EtOAc = 1:1) to afford compound 3 (65 mg, 86%) as yellow solid. Mp 181–183 °C. 1H NMR (400 MHz, CDCl3) δ 9.92 (s, 1H), 7.88 (d, J = 8.4 Hz, 2H), 7.25 (s, 1H), 7.08 (d, J = 8.4 Hz, 2H), 5.14 (s, 2H), 4.07 (s, 3H). 13C NMR (101 MHz, CDCl3) δ 190.7, 162.6, 162.2, 132.2, 131.8, 131.1, 129.3, 115.0, 59.7, 36.6, 34.6, 31.5. MS (ESI): m/z calcd for C12H12N3O4 [M + H]+: 261.08, found: 261.86.:MeOH = 50:1) to afford compound 5 (22 mg, 44%) as red solid. Mp > 300 °C. 1H NMR (400 MHz, DMSO) δ 8.73 (d, J = 8.2 Hz, 1H), 7.97–7.88 (m, 1H), 7.84–7.69 (m, 4H), 7.65–7.58 (m, 1H), 7.45–7.35 (m, 2H), 7.19 (d, J = 8.6 Hz, 2H), 7.00 (s, 1H), 5.34 (s, 2H), 3.96 (s, 3H). 13C NMR (101 MHz, DMSO) δ 159.4, 158.5, 152.9, 152.0, 146.3, 138.4, 135.4, 133.2, 130.0, 128.6, 128.5, 126.1, 124.6, 119.0, 117.6, 117.3, 117.1, 115.9, 115.6, 106.2, 59.7, 59.3, 34.4. HRMS (ESI): m/z calcd for C25H17N5O4Na [M + Na]+: 474.1178, found: 474.1177.:EtOAc = 2:1) to afford compound 6 (88 mg, 91%) as yellow solid. Mp 100–102 °C. 1H NMR (400 MHz, CDCl3) δ 7.50–7.37 (m, 6H), 7.26–7.19 (m, 6H), 7.18–7.11 (m, 3H), 7.08 (s, 1H), 5.19–5.01 (m, 2H), 4.05–3.62 (m, 3H), 3.56–3.37 (m, 2H), 3.13–2.89 (m, 3H), 2.38–2.18 (m, 2H), 2.18–2.05 (m, 3H). MS (ESI): m/z calcd for C29H32N5O4 [M + H]+: 514.24, found: 514.37.:MeOH = 30:1) to afford compound 10 (24 mg, 39%) as red solid. Mp > 300 °C. 1H NMR (400 MHz, CDCl3) δ 1H NMR (400 MHz, CDCl3) δ 8.92 (d, J = 8.3 Hz, 1H), 7.79–7.71 (m, 1H), 7.66–7.51 (m, 4H), 7.50–7.41 (m, 1H), 7.24–6.99 (m, 3H), 6.88 (s, 1H), 6.82–6.73 (m, 1H), 5.23–5.08 (m, 2H), 4.10–3.90 (m, 3H), 3.70–3.42 (m, 4H), 3.20–2.87 (m, 6H). 13C NMR (101 MHz, CDCl3) δ 157.4, 155.6, 154.6, 154.1, 152.9, 152.4, 146.2, 137.9, 134.8, 123.0, 129.7, 129.5, 129.1, 129.04, 126.1, 125.9, 122.3, 118.8, 117.9, 116.9, 115.7, 107.0, 62.9, 56.0, 47.5, 34.4, 29.8. HRMS (ESI): m/z calcd for C31H27N7O7Na [M + Na]+: 632.1870, found: 632.1899.
:EtOAc = 10:1) to afford compound 2 (50 mg, 95%) as yellow solid. Mp 96–98 °C. 1H NMR (400 MHz, CDCl3) δ 7.19 (s, 1H), 4.62 (s, 2H), 4.07 (s, 3H). MS (ESI): m/z calcd for C5H7ClN3O2 [M + H]+: 175.01, found: 175.87.:EtOAc = 1:1) to afford compound 3 (65 mg, 86%) as yellow solid. Mp 181–183 °C. 1H NMR (400 MHz, CDCl3) δ 9.92 (s, 1H), 7.88 (d, J = 8.4 Hz, 2H), 7.25 (s, 1H), 7.08 (d, J = 8.4 Hz, 2H), 5.14 (s, 2H), 4.07 (s, 3H). 13C NMR (101 MHz, CDCl3) δ 190.7, 162.6, 162.2, 132.2, 131.8, 131.1, 129.3, 115.0, 59.7, 36.6, 34.6, 31.5. MS (ESI): m/z calcd for C12H12N3O4 [M + H]+: 261.08, found: 261.86.:MeOH = 50:1) to afford compound 5 (22 mg, 44%) as red solid. Mp > 300 °C. 1H NMR (400 MHz, DMSO) δ 8.73 (d, J = 8.2 Hz, 1H), 7.97–7.88 (m, 1H), 7.84–7.69 (m, 4H), 7.65–7.58 (m, 1H), 7.45–7.35 (m, 2H), 7.19 (d, J = 8.6 Hz, 2H), 7.00 (s, 1H), 5.34 (s, 2H), 3.96 (s, 3H). 13C NMR (101 MHz, DMSO) δ 159.4, 158.5, 152.9, 152.0, 146.3, 138.4, 135.4, 133.2, 130.0, 128.6, 128.5, 126.1, 124.6, 119.0, 117.6, 117.3, 117.1, 115.9, 115.6, 106.2, 59.7, 59.3, 34.4. HRMS (ESI): m/z calcd for C25H17N5O4Na [M + Na]+: 474.1178, found: 474.1177.:EtOAc = 2:1) to afford compound 6 (88 mg, 91%) as yellow solid. Mp 100–102 °C. 1H NMR (400 MHz, CDCl3) δ 7.50–7.37 (m, 6H), 7.26–7.19 (m, 6H), 7.18–7.11 (m, 3H), 7.08 (s, 1H), 5.19–5.01 (m, 2H), 4.05–3.62 (m, 3H), 3.56–3.37 (m, 2H), 3.13–2.89 (m, 3H), 2.38–2.18 (m, 2H), 2.18–2.05 (m, 3H). MS (ESI): m/z calcd for C29H32N5O4 [M + H]+: 514.24, found: 514.37.:MeOH = 30:1) to afford compound 10 (24 mg, 39%) as red solid. Mp > 300 °C. 1H NMR (400 MHz, CDCl3) δ 1H NMR (400 MHz, CDCl3) δ 8.92 (d, J = 8.3 Hz, 1H), 7.79–7.71 (m, 1H), 7.66–7.51 (m, 4H), 7.50–7.41 (m, 1H), 7.24–6.99 (m, 3H), 6.88 (s, 1H), 6.82–6.73 (m, 1H), 5.23–5.08 (m, 2H), 4.10–3.90 (m, 3H), 3.70–3.42 (m, 4H), 3.20–2.87 (m, 6H). 13C NMR (101 MHz, CDCl3) δ 157.4, 155.6, 154.6, 154.1, 152.9, 152.4, 146.2, 137.9, 134.8, 123.0, 129.7, 129.5, 129.1, 129.04, 126.1, 125.9, 122.3, 118.8, 117.9, 116.9, 115.7, 107.0, 62.9, 56.0, 47.5, 34.4, 29.8. HRMS (ESI): m/z calcd for C31H27N7O7Na [M + Na]+: 632.1870, found: 632.1899.General HPLC method
HPLC analysis was performed at room temperature using a Diamonsil C18 (250 mm × 4.6 mm) and a mobile phase gradient from 5% CH3CN/buffer (0.1% TFA/H2O) to 70% CH3CN/buffer (0.1% TFA/H2O) for 5 min, 70% CH3CN/buffer (0.1% TFA/H2O) to 95% CH3CN/buffer (0.1% TFA/H2O) for 10 min, 95% CH3CN/buffer (0.1% TFA/H2O) for 5 min, a flow rate of 1.0 mL min−1, and plotted at 440 nm. This method was used to determine the purity for the tested compounds, and also used in stability studies.General method for nitroreductase assay and cytochrome P450 metabolism assay
The probe measurements were made in 10 mM PBS (pH 7.4, 1% DMSO). The incubation mixtures of test probes with nitroreductase contained the following at the indicated final concentrations: 10 μM test compound, nitroreductase (50 μg mL−1) and 1 mM NADPH. The incubation mixtures of test probes with mouse liver microsomes contained the following at the indicated final concentrations: 25 μM test compound, 5 mM MgCl2, mouse liver microsomes (50 μg mL−1) and 1 mM NADPH. The mixtures were incubated at 37 °C. At different time, 100 μL reaction mixture was quenched by 100 μL cold methanol. The samples were centrifuged at 4 °C for 5 min at 12000 rpm. The supernatant was transferred to a vial for analysis using HPLC.
Cell culture and imaging
H460, HeLa, A549 were cultured in RPMI 1640 medium, DMEM medium, F12 medium, supplemented with 10% fetal bovine serum and 1% penicillin streptomycin in a 5% CO2 humidified environment at 37 °C. Cells were seeded in 96-well plates and incubated for 24 h. The next day, test probes in DMSO were diluted in medium with final concentration of 10 μM (1% DMSO). The cells in the hypoxia treatment group were incubated for 24 h in the anaerobic chamber flushed with a certified anaerobic gas mixture (94% N2/5% CO2/1% O2; Thermo). The cells in the air treatment group were incubated for 24 h in standard cell-culture incubator. After appropriate time of treatment with test compounds, the cells were washed with 200 μL PBS three times and fixed with 4% paraformaldehyde. Finally, 100 μL of PBS was added and the cells were visualized on an inverted fluorescence microscope (Olympus DP80) with green exciting light. The fluorescence images were taken under a 20× objective. The average fluorescence intensity was detected at 661 nm and excited at 640 nm by the flow cytometry assay on a Guava easyCyte HT system.Results and discussion
Chemistry
Compound 1 was reacted with TsCl in the presence of DMAP to prepare compound 2. Then, 4-hydroxybenzaldehyde was reacted with compound 2 in K2CO3/DMF to afford compound 3. Compounds 3 and 4 were refluxed in acetonitrile with HOAc and piperidine to produce compound 5 (IOD) with 36% overall yield. On the other hand, compound 1 was treated with bis(4-nitrophenyl)carbonate followed by the addition of N-trityl-N,N′-dimethylethylenediamine to produce compound 6. The trityl protecting group was removed in 10% TFA/DCM to afford compound 7. DCPO was reacted with triphosgene/DIPEA, followed by the addition of the solution of compound 7 to synthesize compound 10 (IND) with 35% overall yield (Scheme 1). | ||
| Scheme 1 Reagents and conditions: (a) TsCl, DMAP, DCM; (b) K2CO3, DMF; (c) HOAc, piperidine, acetonitrile; (d) bis(4-nitrophenyl)carbonate, N,N′-dimethyl-N-tritylethane-1,2-diamine, DIPEA, DCM; (e) 10% TFA/DCM; (f) triphosgene, DIPEA, DCM; (g) DIPEA, DCM. | ||
Optical properties of probes
We tested the optical properties of the probe (IOD/IND) in PBS buffer (10 mM, pH 7.4, 50% DMSO). The main absorption peak of DCPO appeared at 560 nm while low absorption peaks of IOD/IND were observed at 560 nm (Fig. 3). As expected, the fluorescence of the probe was eliminated when the phenol moiety was masked with nitroimidazole. | ||
| Fig. 3 Absorption spectra of DCPO, IOD and IND, 25 μM in PBS buffer (10 mM, pH 7.4, 50% DMSO). | ||
In vitro nitroreductase assay
We proposed that both IOD and IND could be reduced to the original fluorescent probe DCPO. To testify whether the probes could be activated and fragmented, nitroreductase (NTR) from Escherichia coli was used. The probes dissolved in PBS (5 μM, PBS buffer with 1% DMSO) were incubated with nitroreductase (50 μg mL−1) and NADPH (1 μmol mL−1) at 37 °C. The reduction processes of IOD and IND were monitored through HPLC (Fig. 4). However, the two probes revealed different properties. The results indicated that IND was completely reduced and almost converted to DCPO at 15 min. On the other hand, 42% of IOD was still remaining at 15 min. We supposed that both probes underwent the bioreductive processes, as we proposed. Due to the reversible reaction in the first step under the normoxic condition, it was more reasonable to have 42% of IOD remaining.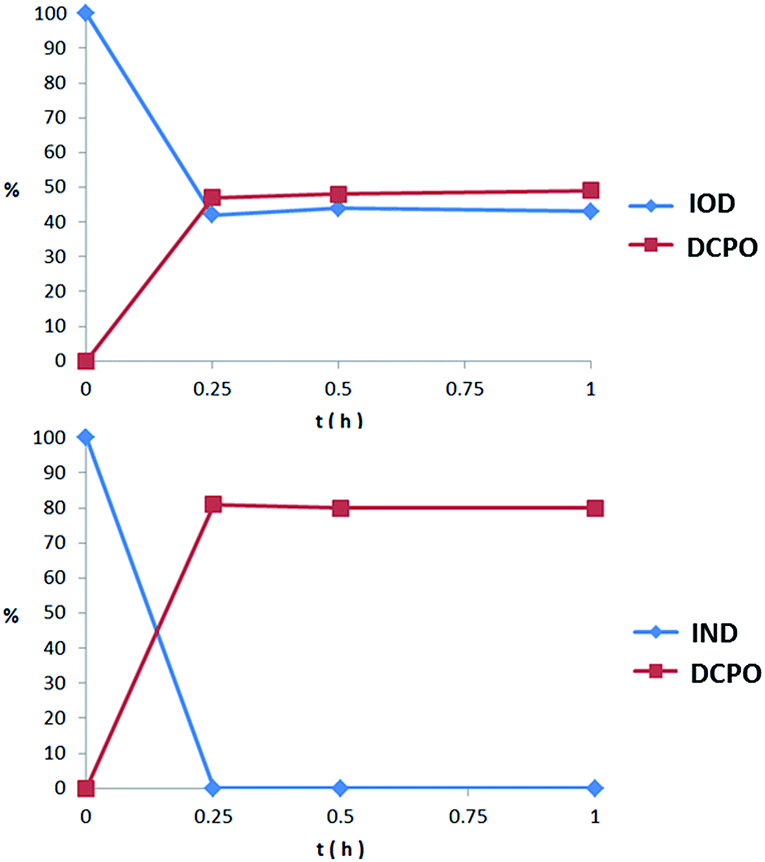 | ||
| Fig. 4 Percent of probe remaining and DCPO releasing in 1 h incubation with nitroreductase (50 μg mL−1) and NADPH (1 μmol mL−1) at 37 °C. | ||
In vitro cytochrome P450 metabolism assay
Though the probes could be reduced by bioreductase, it was necessary to testify whether the probes could be stable in the presence of other enzymes. As we know, many prodrugs and probes undergo oxidation and reduction metabolism by cytochrome P450. Cytochrome P450, which is the main component of animals' liver microsomal enzyme, was used to test the metabolism of the probes. Mouse liver microsomes (50 μg mL−1) and NADPH (1 μmol mL−1) were added to the IOD/IND solution (25 μM, PBS buffer with 1% DMSO) and incubated at 37 °C for 24 h. The results were detected using HPLC (Table 1). The quantity of IOD remaining and DCPO released in the mouse liver microsome assay was similar to that in the nitroreductase assay. However, IND showed a distinct difference in DCPO release. The HPLC results indicated that IND was converted to other DCPO derivatives and the quantity of DCPO released was much lower. The fluorescence emissions of the probes after incubation with mouse liver microsomes for 24 h are shown in Fig. 5, which also indicates that IOD had a stronger emission than IND. We hypothesized that IOD underwent bioreductive metabolism, as we proposed previously. However, IND underwent a more complicated metabolic process, maybe because the bis-carbamate linkage could be a substrate for other enzymes besides the reductase in cytochrome P450.| NTRa | MLMb | |||
|---|---|---|---|---|
| Compound remaining | DCPO release | Compound remaining | DCPO release | |
| a Percent of probe remaining and DCPO releasing in 1 h of incubation with nitroreductase (50 μg mL−1) and NADPH (1 μmol mL−1) at 37 °C.b Percent of probe remaining and DCPO releasing in 24 h of incubation with mouse liver microsomes (50 μg mL−1) and NADPH (1 μmol mL−1) at 37 °C. | ||||
| IOD | 42 | 47 | 48 | 43 |
| IND | 0 | 81 | 2 | 30 |
 | ||
| Fig. 5 Emission spectra of probes (25 μM) excited at 560 nm after 24 h incubation with mouse liver microsomes (50 μg mL−1) and NADPH (1 μmol mL−1) at 37 °C. | ||
Fluorescence imaging in H460, HeLa, A549 cell lines
The probes were evaluated under normoxic and hypoxic (94% N2/5% CO2/1% O2) conditions using H460, HeLa and A549 cell lines. The probes IOD and IND (10 μM, 1% DMSO) were co-cultivated with cells at 37 °C under hypoxic and normoxic conditions for different lengths of time.As shown in Fig. 6, time-dependent fluorescence enhancement was observed under hypoxic conditions, while fluorescence changes under normoxic conditions were not as obvious as hypoxic conditions. In each cell line, probe IOD was observed to have greater difference between hypoxic and normoxic cells. The average fluorescence intensity after 24 h incubation was given by the flow cytometry assay on a Guava easyCyte HT system (Fig. 7). The quantified results indicated that, probe IOD had a higher hypoxia selectivity ratio than IND in each cell line.
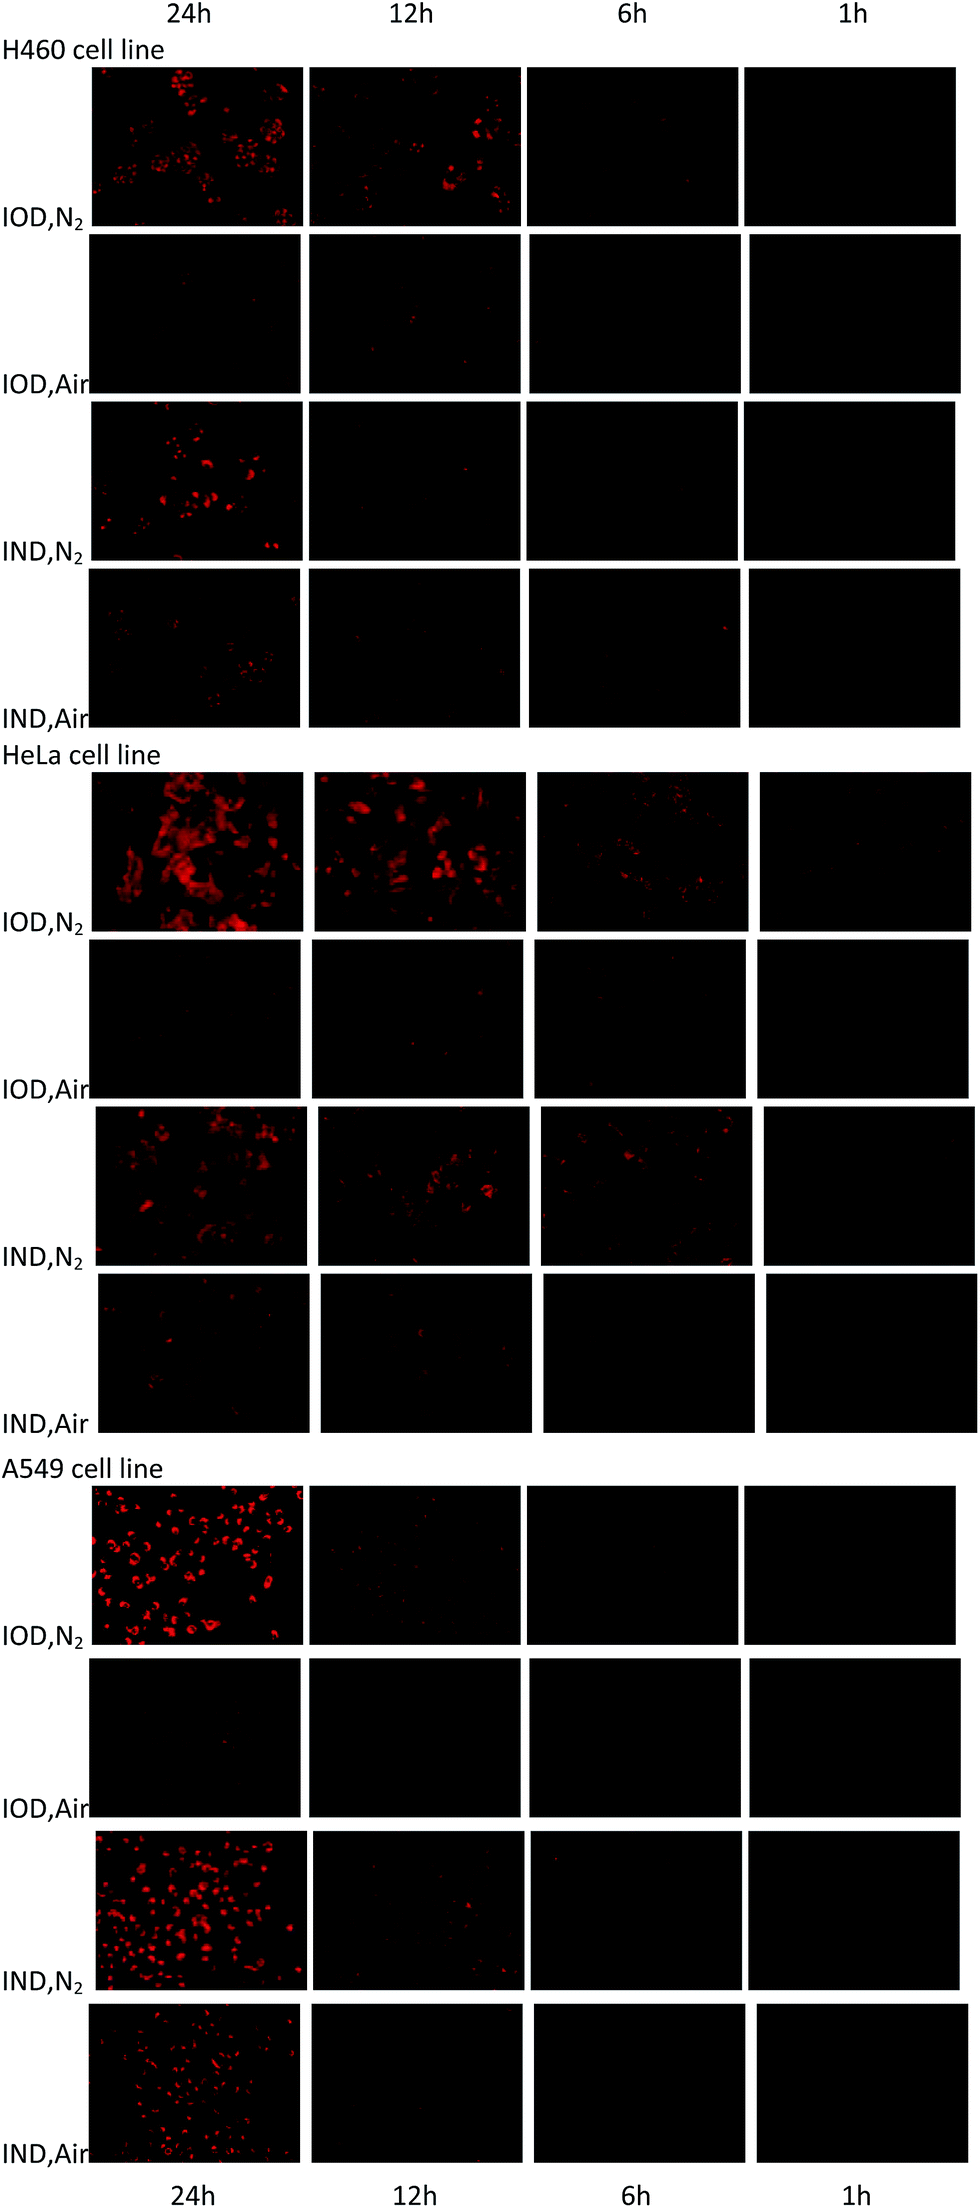 | ||
| Fig. 6 Fluorescence field microphotographs of H460, HeLa and H460 cells incubated with 10 μM probe under normoxic and hypoxic condition (94% N2/5% CO2/1% O2) for different time. | ||
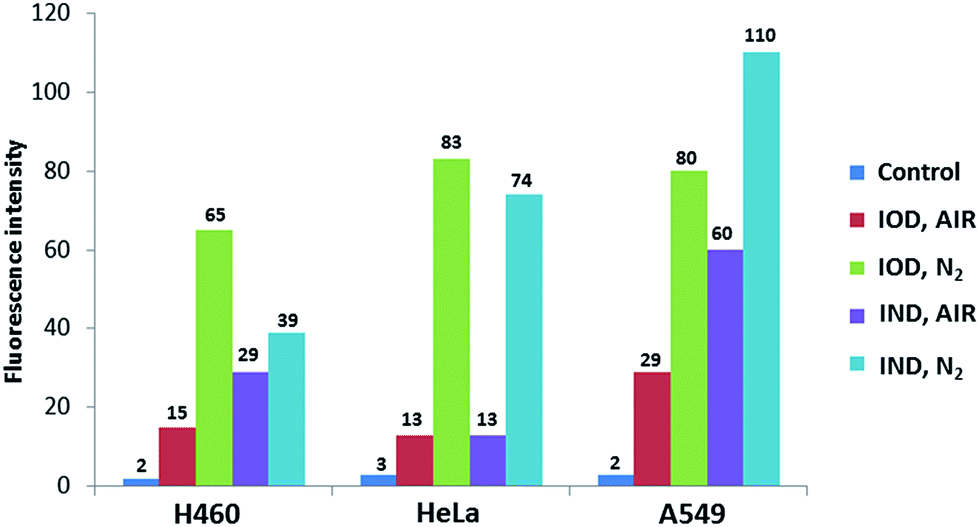 | ||
| Fig. 7 The average fluorescence intensity of H460, HeLa, A549 cells detected at 661 nm and excited at 640 nm. | ||
The cytotoxicity of probes was investigated on three cell lines. The results indicated that, the probes had no obvious inhibition towards three cell lines in both hypoxic and normoxic condition (Fig. S2†).
Conclusions
In this study, we synthesized two probes based on (1-methyl-2-nitro-1H-imidazol-5-yl)methanol and DCPO. Biological evaluation indicated that different linkages revealed distinctly different results. Probe IOD with an ether linkage was demonstrated to be able to release DCPO via metabolism by nitroreductase and cytochrome P450. However, probe IND with a bis-carbamate linkage may be a substrate to enzymes beyond the reductase in cytochrome P450. The hypoxia selectivity ratio of IOD was evaluated to be higher than that of IND on H460, HeLa and A549 cell lines. In conclusion, the probe IOD was considered to be a promising hypoxia-selective fluorescent probe.Acknowledgements
The authors are grateful for the financial support from the State Key Laboratory of Fine Chemicals, Dalian University of Technology (KF1517).Notes and references
- J. M. Brown, Cancer Biol. Ther., 2002, 1, 453–458 CrossRef PubMed.
- W. R. Wilson and M. P. Hay, Nat. Rev. Cancer, 2011, 11, 393–410 CrossRef CAS PubMed.
- R. A. Cairns, I. S. Harris and T. W. Mak, Nat. Rev. Cancer, 2011, 11, 85–95 CrossRef CAS PubMed.
- T. G. Graeber, C. Osmanian, T. Jacks, D. E. Housman, C. J. Koch, S. W. Lowe and A. J. Giaccia, Nature, 1996, 379, 88–91 CrossRef CAS PubMed.
- J. T. Erler, C. J. Cawthorne, K. J. Williams, M. Koritzinsky, B. G. Wouters, C. Wilson, C. Miller, C. Demonacos, I. J. Stratford and C. Dive, Mol. Cell. Biol., 2004, 24, 2875–2889 CrossRef CAS PubMed.
- K. M. Rouschop, B. T. Van, L. Dubois, H. Niessen, J. Bussink, K. Savelkouls, T. Keulers, H. Mujcic, W. Landuyt, J. W. Voncken, P. Lambin, A. J. Kogel, M. Koritzinsky and B. G. Wouters, J. Clin. Invest., 2010, 120, 127–141 CAS.
- Y. Wang and M. Ohh, J. Cell. Mol. Med., 2010, 14, 496–503 CAS.
- R. D. Guzy, B. Hoyos, E. Robin, H. Chen, L. P. Liu, K. D. Mansfield, M. C. Simon, U. Hammerling and P. T. Schumacker, Cell Metab., 2005, 1, 401–408 CrossRef CAS PubMed.
- J. M. Brown and W. R. Wilson, Nat. Rev. Cancer, 2004, 4, 437–447 CrossRef CAS PubMed.
- G. O. Ahn and M. Brown, Front. Biosci., 2007, 12, 3483–3501 CrossRef CAS.
- R. M. Phillips, Cancer Chemother. Pharmacol., 2016, 77, 441–457 CrossRef CAS PubMed.
- T. Thambi, J. H. Park and D. S. Lee, Chem. Commun., 2016, 52, 8492–8500 RSC.
- A. J. Lin, L. A. Cosby, C. W. Shansky and A. C. Sartorelli, J. Med. Chem., 1973, 15, 1247–1252 CrossRef.
- S. R. McKeown, R. L. Cowen and K. J. Williams, Clin. Oncol., 2007, 19, 427–442 CrossRef CAS PubMed.
- R. P. Mason and J. L. Holtzman, Biochem. Biophys. Res. Commun., 1975, 67, 1267–1274 CrossRef CAS PubMed.
- E. Nieto, M. Delgado, M. Sobrado, M. L. Ceballos, R. Alajarín, L. G. García, J. Kelly, I. Lizasoain and M. A. Pozo, Eur. J. Med. Chem., 2015, 101, 604–615 CrossRef CAS PubMed.
- K. L. Bennewith, J. A. Raleigh and R. E. Durand, Cancer Res., 2002, 62, 6827–6830 CAS.
- S. M. Evans, K. D. Judy, I. Dunphy, W. T. Jenkins, P. T. Nelson, R. Collins, E. P. Wileyto, K. Jenkins, S. M. Hahn, C. W. Stevens, A. R. Judkins, P. Phillips, B. Geoerger and C. J. Koch, Cancer Res., 2004, 64, 1886–1892 CrossRef CAS PubMed.
- J. G. Rajendran and D. A. Mankoff, J. Nucl. Med., 2007, 48, 855–856 CrossRef PubMed.
- Z. Guo, S. Park, J. Yoon and I. Shin, Chem. Soc. Rev., 2014, 43, 16–29 RSC.
- A. R. Lippert, G. C. Van de Bittner and C. J. Chang, Acc. Chem. Res., 2011, 44, 793–804 CrossRef CAS PubMed.
- Y. Yang, Q. Zhao, W. Feng and F. Li, Chem. Rev., 2012, 113, 192–270 CrossRef PubMed.
- S. A. Hilderbrand and R. Weissleder, Curr. Opin. Chem. Biol., 2010, 14, 71–79 CrossRef CAS PubMed.
- G. Bazar, V. Eles, Z. Kovacs, R. Romvari and A. Szabo, Talanta, 2016, 155, 202–211 CrossRef CAS PubMed.
- R. Risoluti, S. Materazzi, A. Gregori and L. Ripani, Talanta, 2016, 153, 407–413 CrossRef CAS PubMed.
- L. He, B. Dong, Y. Liu and W. Lin, Chem. Soc. Rev., 2016, 45, 6449–6461 RSC.
- X. Chen, Y. Zhou, X. Peng and J. Yoon, Chem. Soc. Rev., 2010, 39, 2120–2135 RSC.
- J. Du, M. Hu, J. Fan and X. Peng, Chem. Soc. Rev., 2012, 41, 4511–4535 RSC.
- X. Zhang, L. Zhang, Y. Liu, B. Bao, Y. Zang, J. Li and W. Lu, Tetrahedron, 2015, 71, 4842–4845 CrossRef CAS.
- B. Bao, Y. Liu, L. Wang and W. Lu, RSC Adv., 2016, 6, 69540–69545 RSC.
- S. Chen, Y. Fang, Q. Zhu, W. Zhang, X. Zhang and W. Lu, RSC Adv., 2016, 6, 81894–81901 RSC.
- Z. Lu, J. Wu, W. Liu, G. Zhang and P. Wang, RSC Adv., 2016, 6, 32046–32051 RSC.
- P. Wang, K. Wang, D. Chen, Y. Mao and Y. Gu, RSC Adv., 2015, 5, 85957–85963 RSC.
- J. Cao, C. Zhao and W. Zhu, Tetrahedron Lett., 2012, 53, 2107–2110 CrossRef CAS.
- T. Guo, L. Cui, J. Shen, W. Zhu, Y. Xu and X. Qian, Chem. Commun., 2013, 49, 10820–10822 RSC.
- J. Zhou, W. Shi, L. Li, Q. Gong, X. Wu, X. Li and H. Ma, Chem.–Asian J., 2016, 11, 2719–2724 CrossRef CAS PubMed.
- Q. Cai, T. Yu, W. Zhu, Y. Xu and X. Qian, Chem. Commun., 2015, 51, 14739–14741 RSC.
- J. Rao and A. Khan, J. Am. Chem. Soc., 2013, 135, 14056–14059 CrossRef CAS PubMed.
- J. Rao, C. Hottinger and A. Khan, J. Am. Chem. Soc., 2014, 136, 5872–5875 CrossRef CAS PubMed.
- K. Okuda, Y. Okabe, T. Kadonosono, T. Ueno, B. G. M. Youssif, S. K. Kondoh and H. Nagasawa, Bioconjugate Chem., 2012, 23, 324–329 CrossRef CAS PubMed.
- Q. Lin, C. Bao, Y. Yang, Q. Liang, D. Zhang, S. Cheng and L. Zhu, Adv. Mater., 2013, 25, 1981–1986 CrossRef CAS PubMed.
- K. Xu, F. Wang, X. Pan, R. Liu, J. Ma, F. Kong and B. Tang, Chem. Commun., 2013, 49, 2554–2556 RSC.
- J. X. Duan, H. Jiao, J. Kaizerman, T. Stanton, J. W. Evans, L. Lan, G. Lorente, M. Banica, D. Jung, J. Wang, H. Ma, X. Li, Z. Yang, R. M. Hoffman, W. S. Ammons, C. P. Hart and M. Matteucci, J. Med. Chem., 2008, 51, 2412–2420 CrossRef CAS PubMed.
- J. B. Grimm, T. D. Gruber, G. Ortiz, T. A. Brown and L. D. Lavis, Bioconjugate Chem., 2016, 27, 474–480 CrossRef CAS PubMed.
Footnote |
| † Electronic supplementary information (ESI) available. See DOI: 10.1039/c7ra01466j |
| This journal is © The Royal Society of Chemistry 2017 |