
 Open Access Article
 This Open Access Article is licensed under a
 Creative Commons Attribution 3.0 Unported Licence
Morphology control and large piezoresponse of hydrothermally synthesized lead-free piezoelectric (Bi0.5Na0.5)TiO3 nanofibres
Mohammad Bagher Ghasemiana,
Qianru Lina,
Esmaeil Adabifiroozjaeia,
Feifei Wangb,
Dewei Chua and
Danyang Wang *a
*a
aSchool of Materials Science and Engineering, The University of New South Wales, Sydney, NSW 2052, Australia. E-mail: dy.wang@unsw.edu.au
bKey Laboratory of Optoelectronic Material and Device, Department of Physics, Shanghai Normal University, Shanghai, 200234, China
First published on 6th March 2017
Abstract
Lead-free piezoelectric bismuth sodium titanate (BNT) nanostructures were synthesised using a low-temperature hydrothermal technique. It is found that the phase and morphology of the products are strongly dependent on the composition and concentration of the precursors, as well as the processing conditions. Through optimising the synthesis parameters, well-crystallized BNT nanofibers with 150–200 nm diameters and ∼5 μm length were obtained. The BNT fibres show a pure perovskite phase with (011) orientation along the length direction. A piezoelectric constant of d33 = ∼15 pm V−1 in the diameter direction was observed for these BNT nanofibers.
Introduction
(Bi1/2Na1/2)TiO3 (BNT), one of the most promising lead-free piezoelectric materials was discovered in 1960 by Smolensky et al.1 A-Site complex perovskite BNT has been recognised as a leading lead-free candidate owing to its marked remanent polarization and piezoelectric coefficients, and highlighted by several research reviews.2–6 BNT-based materials have exhibited great potential for application in piezoelectric and pyroelectric devices.7 On the other hand, strong dependence of ferroelectric properties on size, structure and morphology has attracted much focus for controllable preparation of BNT nanostructures such as nanospheres, nanocubes and nanofibers.8 It has been reported that different precursors and morphologies have a significant effect on energy transition and mass of piezoelectric material after the sintering process which consequently affects the electrical properties and density of sintered piezoelectric materials.9,10 For example, sintered BNT nanofibers have higher piezoelectric constant (d33), planar electromechanical coupling factor (kp) and remnant polarization (Pr) than sintered BNT nanocubes. In contrast, sintered BNT nanocubes have higher mechanical quality factor (Qm) than that of nanofiber counterparts.9 It is also reported that crystal morphology of the BNT nanostructures, as a template, controls the grain growth and density of ceramics. Ceramics sintered from BNT nanofibers have a large grain size which facilitates domain switching and subsequently results in a significant improvement of piezoelectric and ferroelectric properties.9The nanostructured materials present fascinating and applicable properties because of quantum size and specific shape effects. Particularly, one-dimensional (1D) lead-free ferroelectric materials including nanofibers, nanotubes and nanoribbons are greatly desirable owing to their high surface to volume ratio, exceptional properties in energy harvesting, photocatalysis, electromechanical device and ferroelectric memories.11 The hydrothermal synthesis is a technique presenting remarkable advantages for fabrication of one-dimensional nanostructures. It offers controllable synthesis conditions and a cost-effective and low-temperature (∼200 °C) route without the need of substrate that promotes easy fabrication.12 The hydrothermal synthesis provides many unique advantages which are not met by other synthetic techniques, such as direct precipitation of crystalline materials from solutions, high purity, controllable rate and homogeneity of nucleation, aging and growth, controllable size and morphology of crystals. In particular, low processing temperature can prevent undesirable changes in stoichiometry when compounds contain volatile elements such as Bi and alkali elements in many lead-free piezoelectrics. Recently, hydrothermal method was used in making BNT nanostructures with different size and shape.13–19 Lencka et al.13 was the first to synthesise BNT nanospheres and their diameters can be effectively tuned through controlling the pH values of precursor solutions.15 The monosized BNT nanospheres can be converted into uniform cubes when using higher mineralizer concentration.14,18 By increasing the treatment temperature or NaOH concentration, nanowhiskers of BNT were resulted.17 It is also suggested that growth of BNT nanowires can be promoted by increasing the ratio of titanium to bismuth (Ti/Bi = 2).20 Also, other similar 1D perovskite materials such as acicular BaTiO3 nanostructures have been developed by controlling morphology through changing the growth period and phase transition of the coprecipitated amorphous phase.21
In this work, BNT nanofibers were synthesised using a facile hydrothermal technique. The effects of hydrothermal treatment time, temperature and chemicals' concentration on the morphology of BNT nanostructures were investigated. Structural and piezoelectric properties of the as-grown nanofibers were also characterised.
Experimental
The hydrothermal synthesis of BNT nanostructures started with analytical grade chemicals. Different Bi and Ti precursors were tested in order to find out the optimal combination for fabricating pure BNT phase. NaOH was used as both sodium source and mineralizer to control the size and morphology of the BNT nanostructures. Table 1 shows different conditions in hydrothermal synthesis of BNT with various combinations of precursors. Firstly, different combinations of Bi and Ti precursors (molar ratio of 1![[thin space (1/6-em)]](https://www.rsc.org/images/entities/char_2009.gif) :2) were mixed in distilled water. Various amounts of NaOH were then introduced into the solution, which was stirred for one hour before transferring to a 50 ml autoclave. The autoclave was held in an oven at different temperatures and for different periods for hydrothermal treatment. It was naturally cooled down to room temperature after the completion of hydrothermal synthesis. As-grown products were filtered and washed to natural pH with distilled water before drying at 110 °C.
:2) were mixed in distilled water. Various amounts of NaOH were then introduced into the solution, which was stirred for one hour before transferring to a 50 ml autoclave. The autoclave was held in an oven at different temperatures and for different periods for hydrothermal treatment. It was naturally cooled down to room temperature after the completion of hydrothermal synthesis. As-grown products were filtered and washed to natural pH with distilled water before drying at 110 °C.
| Bi precursors | Ti precursors | NaOH (M) | Time (h) | Temperature (°C) | |
|---|---|---|---|---|---|
| 1 | Bi2O3 | TiO2 | 4, 8, 12, 16 | 10, 20, 40, 80 | 160, 180, 200 |
| 2 | BiCl3 | Ti(OC4H9)4 | |||
| 3 | Bi(NO3)3·5H2O | (C6H20N2O6)2Ti(OH)2 |
The phase structure of obtained materials was investigated by X-ray diffraction (XRD Philips X'Pert pro MPD, Cu-Kα radiation, λ = 1.54 Å). The morphology of the synthesised BNT nanostructures was imaged by a scanning electron microscopy (SEM, Nova NanoSEM230/450). High resolution transmission electron microscopy (HRTEM, CM200, FEI) images and selected area electron diffraction (SAED) patterns were used to study the crystal size, shape and lattice structure of products. A Raman spectrometer (Reinshaw inVia) with an Ar-ion laser excitation source (514 nm; continuous mode) was used to further confirm the structures of BNT nanoparticles at room temperature in 180° backscattering geometry. Piezoelectric responses were examined by piezoelectric force microscope (PFM, Asylum Research).
Results and discussion
Several different precursors were used as bismuth and titanium sources to find the optimal combination for synthesising the pure BNT phase. All products were synthesised at 200 °C with 16 M NaOH and Bi:Ti molar ratio of 1:2 for 20 h. Fig. 1 shows XRD patterns for the obtained BNT nanostructures from different starting chemicals. It is found a combination of Bi(NO3)3·5H2O and Ti(OC4H9)4 or BiCl3 and TiO2 result in the pure perovskite phase under the aforementioned hydrothermal conditions.
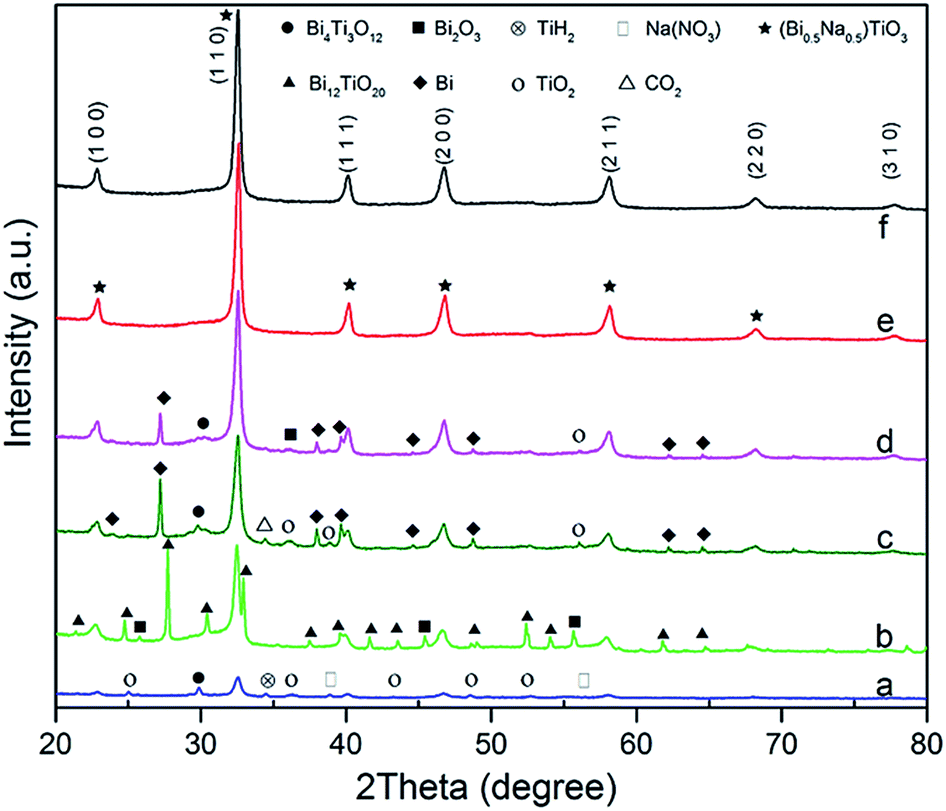 | ||
| Fig. 1 XRD patterns of BNT nanostructures produced under the hydrothermal conditions of; 200 °C, 20 h, NaOH = 16 M by different Bi and Ti precursors: (a) Bi(NO3)3·5H2O + TiO2; (b) Bi2O3 + TiO2; (c) BiCl3 + (C6H20N2O6)2Ti(OH)2; (d) BiCl3 + Ti(OC4H9)4; (e) Bi(NO3)3·5H2O + Ti(OC4H9)4; (f) BiCl3 + TiO2. | ||
NaOH plays important roles in adjusting pH values of the solution and providing A-site cations for the perovskite structure in the reaction process.13 The mineralizer effect of NaOH on the structure and morphology of BNT nanostructures was also studied through using different concentrations of NaOH (4, 8, 12 and 16 M). Fig. 2a demonstrates XRD patterns for hydrothermally produced BNT (by BiCl3 and TiO2 as precursors) under the conditions of 200 °C after 80 h. At low NaOH concentration (e.g. 4 M), diffraction peaks of secondary phases (Bi4Ti3O12 and TiO2) are superimposed on the typical perovskite pattern. The secondary phases diminish with the increase of NaOH concentrations i.e. 8 and 12 M, leading to a pure BNT phase with perovskite structure as evidenced by the XRD pattern in Fig. 2a. These sharp and strong peaks in XRD pattern of nanostructures produced with high NaOH concentrations imply a high crystallinity of BNT perovskite phase. Moreover, NaOH concentration has a significant impact on the morphology of BNT nanostructures.22 When concentration of NaOH is 12 M, the resultant morphology is predominantly nanofibers with ∼200 nm diameter and ∼5 μm length, as shown in Fig. 2b. When the concentration of NaOH increases to 16 M, nanocubes become the dominant morphology and their size is around 400 nm (Fig. 2c). Fig. 2d compares a typical BNT nanofiber and cube produced at a NaOH concentration of 12 M, illustrating the importance of NaOH concentration on the size of nanofibers and nanocubes.
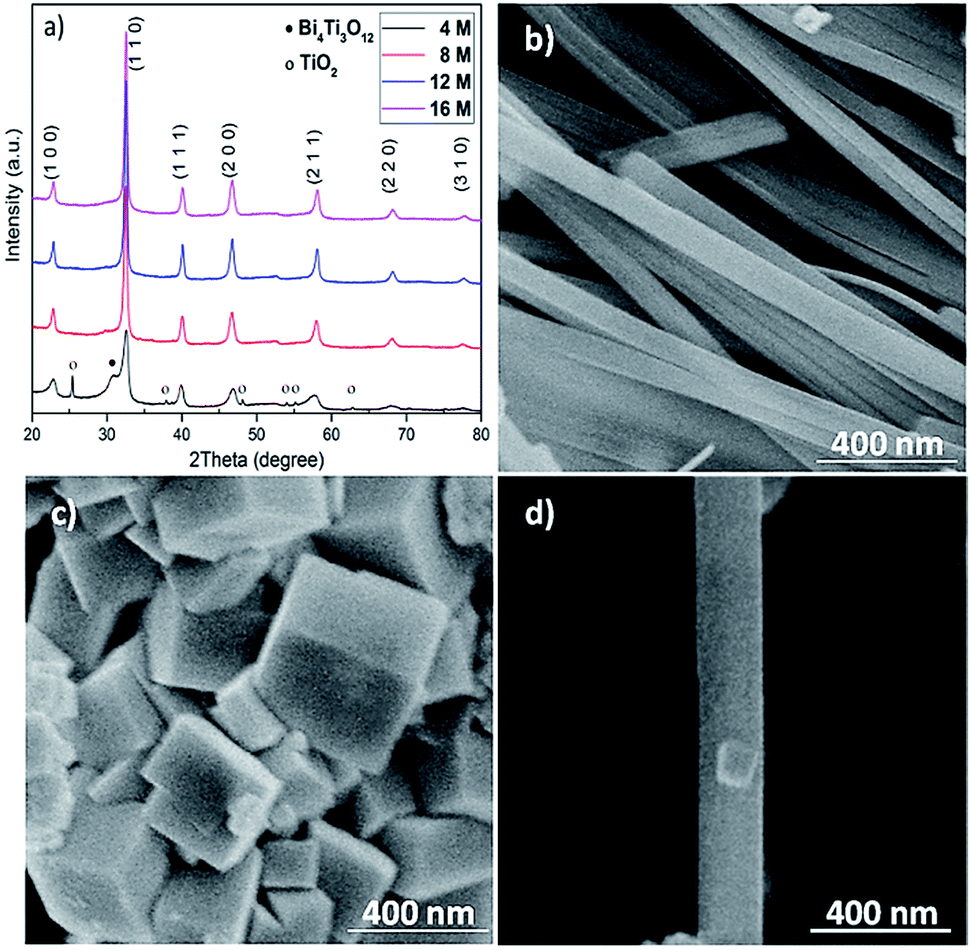 | ||
| Fig. 2 XRD patterns and SEM images of hydrothermally synthesised BNT nanostructures at 200 °C for 80 h with different concentrations of NaOH. (a) XRD patterns, (b) NaOH = 12 M and (c) NaOH = 16 M, (d) a typical nanocube on a nanofiber produced with NaOH = 12 M. | ||
The BNT particles are created after the initial growth and ripening process. Throughout the hydrothermal reaction, precursors hydrolyse and initial crystals accumulate into bigger particles to reduce surface free energy. The chemical reactions occurred in the process of hydrothermal production of BNT can be expressed as:14,23
| 12Bi3+ + Ti4+ + 40OH− → Bi12TiO20 + 20H2O | (1) |
| Bi12TiO20 + 12Na+23Ti4+ + 104OH− → 24Bi0.5Na0.5TiO3 + 52H2O | (2) |
It is shown that the increase of hydroxyl (OH−) concentration may lead to a higher growth rate. Various mechanisms for the evolution of nanocubes and nanofibers have been proposed, including dissolution–recrystallization and oriented growth.9 In the case of low NaOH concentration, the growth rate is different in different directions producing plates and agglomerations. The increase of mineralizer concentration might hasten the kinetics of dissolution–recrystallization process.22 In supersaturated solutions, crystallization and nucleation happen on the surface of aggregated particles, resulting in nanocubes, as shown in Fig. 2c. In supersaturated solutions with concentration of NaOH higher than 12 M, hydrothermal process is controlled by dissolution–crystallization mechanism and BNT particles are produced by a short and fast nucleation cycle according to Ostwald ripening phenomenon.24 Therefore, reasonably high mineralizer concentration is desirable for synthesising of uniform BNT nanocubes. On the other hand, kinetically, crystal growth also strongly depends on degree of oversaturation.25 The solution with low concentration of mineralizer is prone to the assembly of nanofibers. Due to the reduction of surface free energy, nanocubes attach one another orientally creating nanofibers.
The effect of hydrothermal treatment temperature on the structure and morphology of the produced BNT nanostructures was also studied. Fig. 3a shows XRD patterns of BNT nanostructures fabricated at 160, 180 and 200 °C after 20 h hydrothermal treatment with NaOH = 12 M. In the case of low temperature (160 °C) synthesized BNT, characteristic peaks of BNT are clearly seen in the XRD spectrum. The broadness of the peaks suggests a rather poor crystalline quality of the BNT. Nevertheless, the appearance of a shoulder at around 2θ = 32° implies the presence of Bi4Ti3O12 secondary phase. With the increase of hydrothermal temperature to 180 and 200 °C, BNT peaks become sharper and stronger, indicating a higher degree of crystallization. Particularly, almost no secondary phase is visible in the XRD pattern of BNT produced at 200 °C.
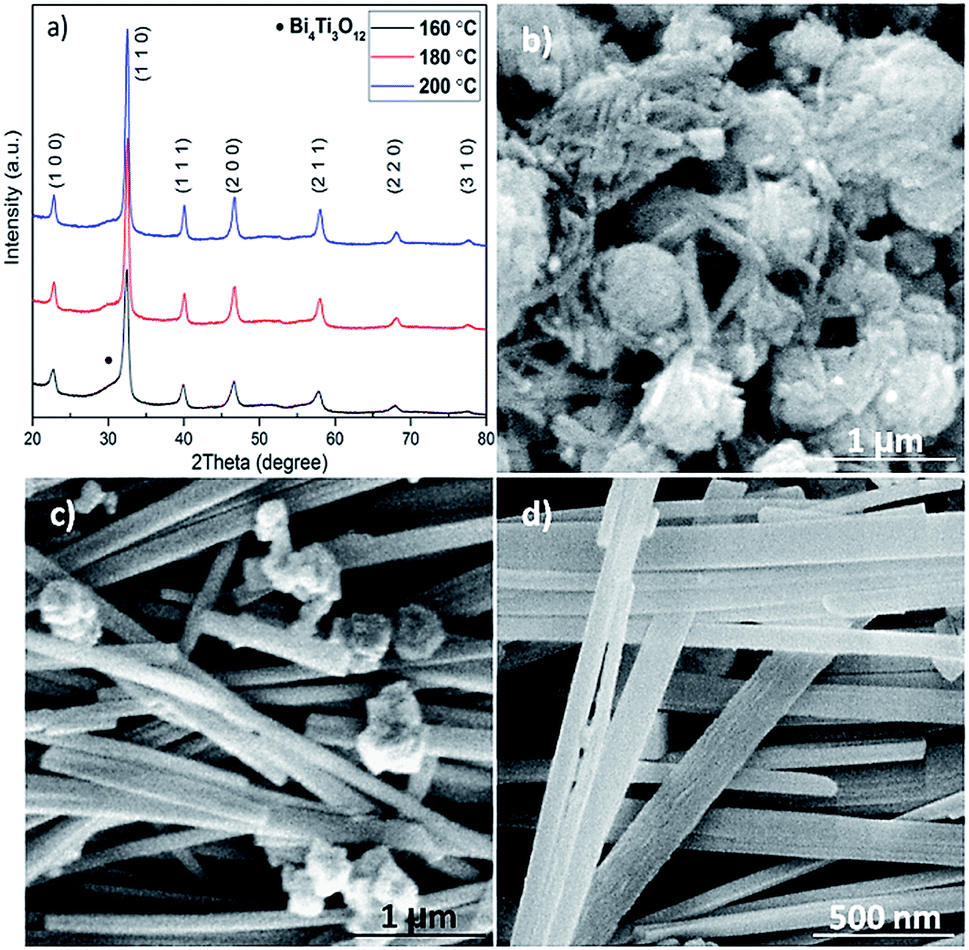 | ||
| Fig. 3 XRD patterns and SEM images of hydrothermally synthesised BNT nanostructures at different temperatures with 20 h treatment time and NaOH = 12 M. (a) XRD patterns, (b) 160 °C, (c) 180 °C and (d) 200 °C. | ||
The hydrothermal treatment temperature also leads to substantially different morphologies as shown in Fig. 3b–d. When treated at 160 °C, BNT manifests agglomeration of nanoparticles with very fine whiskers of ∼50 nm diameter (Fig. 3b). As evidenced by Fig. 3c and d, higher treatment temperatures can effectively promote the growth of BNT nanofibers. Although a considerable amount of agglomeration is still present, fibers of 150 nm diameter and several microns length can be clearly seen in the SEM image (Fig. 3c). If the treatment temperature rises to 200 °C, the agglomerations are almost gone and the dominant morphology is fibre with some nanocubes at local regions.
XRD patterns in Fig. 4a depict the effect of hydrothermal treatment time on the phase structure of the BNT nanostructures synthesized at 200 °C with NaOH = 12 M. Weak peak of secondary phase is seen from the XRD pattern of 10 h-treated BNT. When the treatment time is ≥20 h, the secondary phase is gone and pure perovskite phase is obtained. According to the XRD patterns, no conspicuous changes on the BNT phase structures can be detected if the treatment time is longer than 20 h. However, the change of treatment time results in significantly different shape and morphology of the nanostructures. As shown in Fig. 4b, only the 20 h-treated samples render a nanofiber dominant morphology. All the other treatment periods lead to only a small population of fibres embedded into a matrix of spherical and agglomeration particles. Surprisingly, prolongation of the reaction time doesn't promote the amount of nanofibres. Therefore, the hydrothermal treatment time is critical to obtain the desired BNT morphology, i.e. nanofibres.
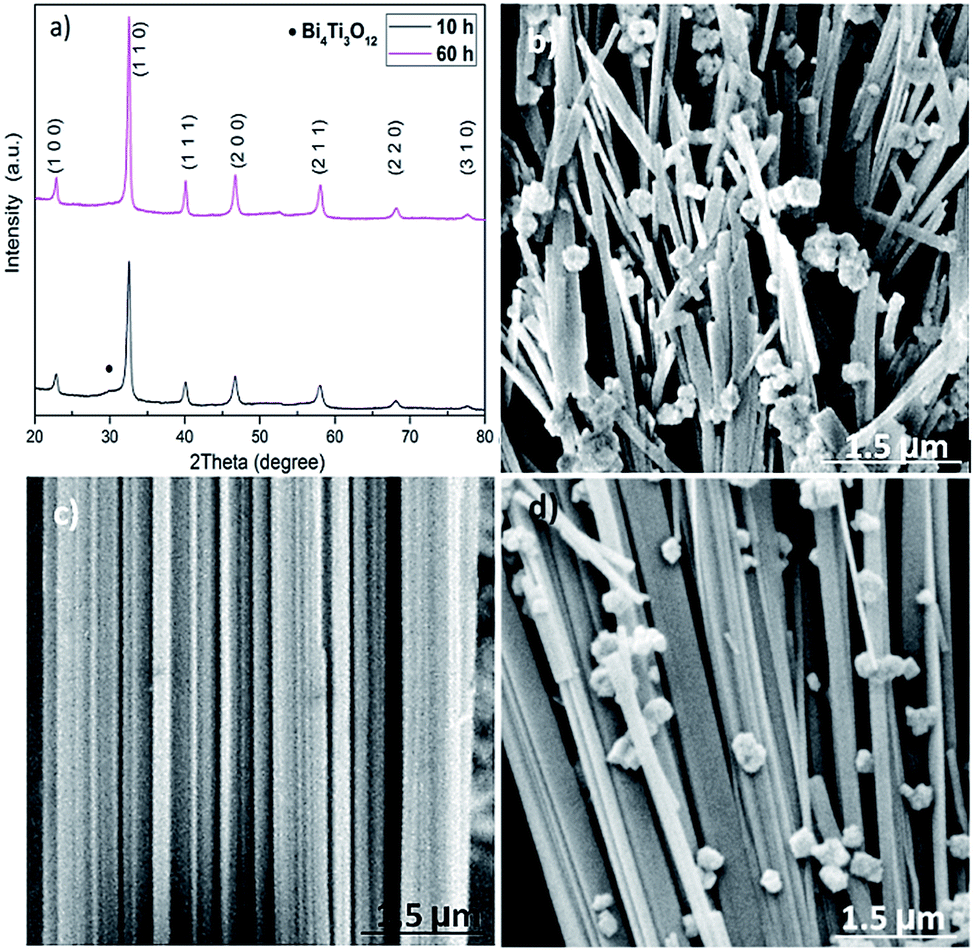 | ||
| Fig. 4 XRD patterns and SEM images of BNT nanostructures synthesised at 200 °C with NaOH = 12 M. (a) XRD patterns, (b) 10 h, (c) 20 h, (d) 60 h reaction time. | ||
As discussed, the formation of BNT particles is a two-step process including dissolution and recrystallization. This suggests, by an oriented attachment process, the larger particles are produced from smaller initial nanoparticles. Then, the neighbouring nanocubes join together through a self-assembly mechanism at a planar interface and a same crystallographic direction to form BNT nanofibers.26 Thermodynamically, the elimination of high energy surfaces which leads to a significant decrease in surface free energy is the motivation for this natural oriented attachment.27 Meanwhile, for long hydrothermal treatment period, adjacent particles with different size and morphology can be self-assembled and produce bulks of cubes and nanofibers or massive agglomerations as shown in Fig. 4d.28
Table 2 summarizes the different products and morphologies of BNT nanostructures produced in various hydrothermal conditions which might be referable to other lead-free piezoelectric materials. It can be concluded that 200 °C, NaOH = 12 M and the hydrothermal treatment time of 20 h are the optimal conditions for synthesising BNT nanofibers whilst BNT nanocubes can be produced at 200 °C, NaOH = 16 M and treatment period between 20 and 60 h.
| Temperature (°C) | NaOH (M) | Time (h) | Phase | Morphology |
|---|---|---|---|---|
| 200 | 4 | 80 | BNT, Bi4Ti3O12, TiO2 | — |
| 200 | 8 | 80 | BNT, Bi4Ti3O12 | — |
| 200 | 12 | 10 | BNT, Bi4Ti3O12 | Cubic, nanofiber |
| 200 | 12 | 20 | BNT | Nanofiber |
| 200 | 12 | 40 | BNT | Nanofiber, agglomeration |
| 200 | 12 | 60 | BNT | Nanofiber, agglomeration |
| 200 | 16 | 10 | BNT, Bi4Ti3O12 | Cubic, agglomeration |
| 200 | 16 | 20 | BNT | Cubic |
| 200 | 16 | 60 | BNT | Cubic |
| 200 | 16 | 80 | BNT | Cubic, agglomeration |
| 180 | 12 | 20 | BNT | Agglomeration, nanofiber |
| 180 | 12 | 40 | BNT | Agglomeration, nanofiber |
| 160 | 12 | 20 | BNT, Bi4Ti3O12 | Agglomeration |
| 160 | 12 | 40 | BNT, Bi4Ti3O12 | Agglomeration, nanofiber |
Fig. 5 shows the energy dispersive X-ray spectrometry (EDS) spectra which reveal the detailed elemental compositions in BNT nanofibers and cubes. These analyses prove that both morphologies include Na, Bi, Ti and O with the approximate atomic ratio of 1:1:2:6, which is in good agreement with the nominal stoichiometric ratio of BNT material.29
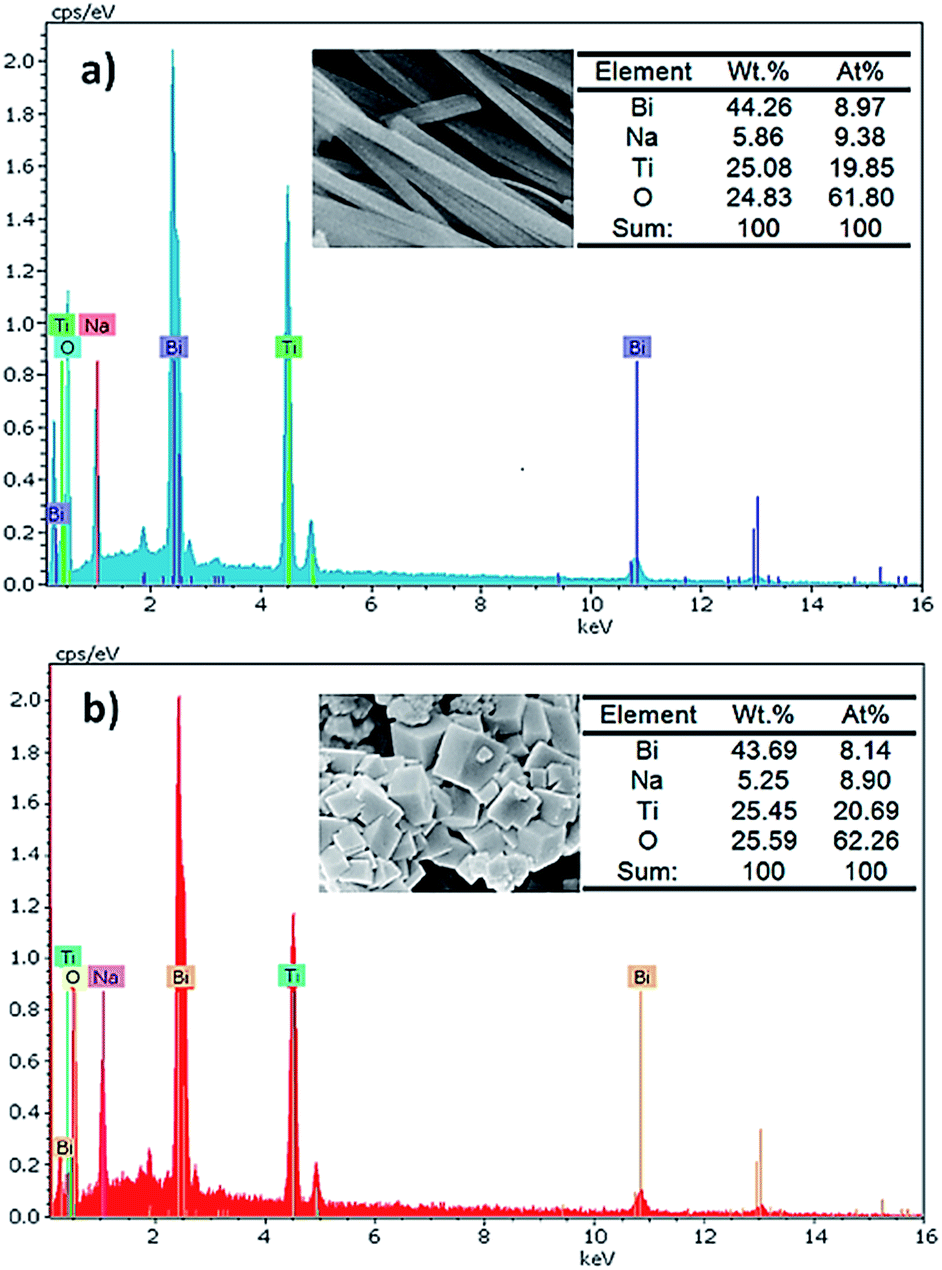 | ||
| Fig. 5 EDS spectra of (a) BNT nanofibers and (b) BNT nanocubes. | ||
Fig. 6a shows the bright field TEM image of a single BNT nanofiber with a diameter about 150 nm synthesised under the optimal conditions. Fig. 6b and c show selected area electron diffraction (SEAD) pattern around the [11![[1 with combining macron]](https://www.rsc.org/images/entities/char_0031_0304.gif) ] zone axis and HR-TEM image of a single BNT nanofiber, indicating the single crystal nature of the nanofibers. TEM characterization on the fibers showed an orthorhombic structure and the growth plane is (011) with interplanar spacing of 0.44 nm, indicating the growth direction is [011].
] zone axis and HR-TEM image of a single BNT nanofiber, indicating the single crystal nature of the nanofibers. TEM characterization on the fibers showed an orthorhombic structure and the growth plane is (011) with interplanar spacing of 0.44 nm, indicating the growth direction is [011].
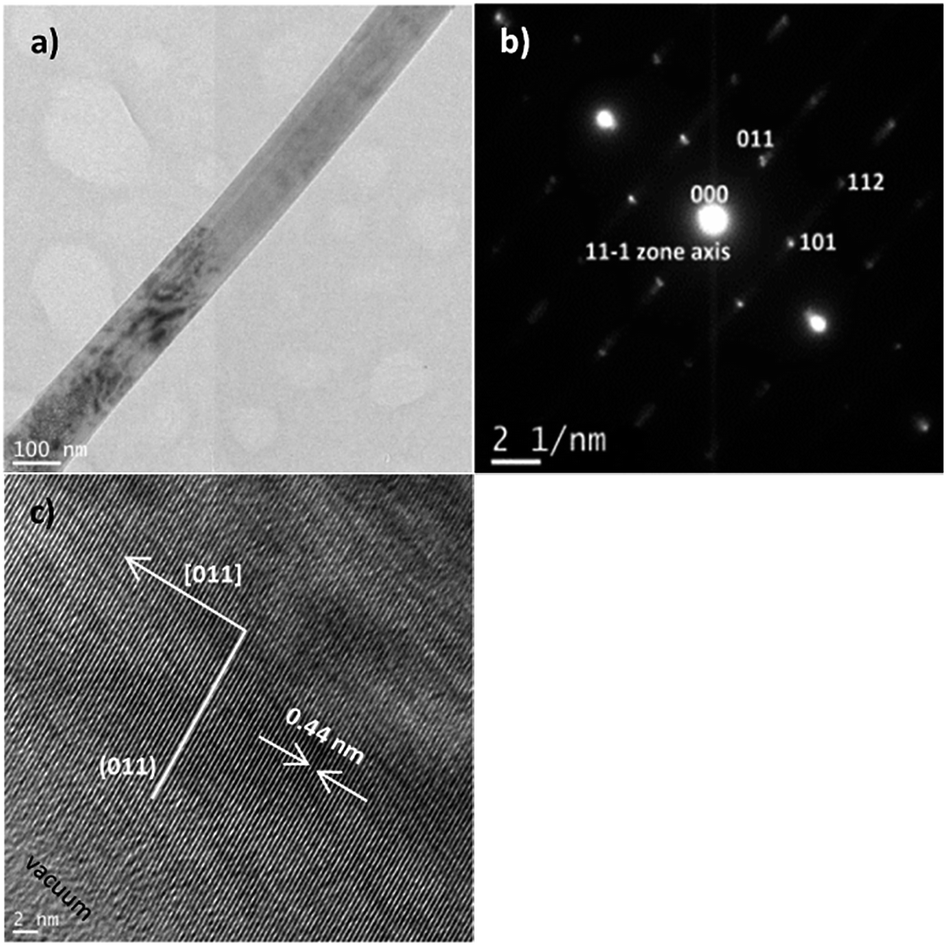 | ||
| Fig. 6 (a) Bright field TEM micrograph, (b) SAED pattern and (c) HR-TEM image of a BNT nanofiber. | ||
Fig. 7 shows the TEM results of the BNT nanocubes, as the by-products of the nanofibres, synthesized at 200 °C for 20 h with NaOH concentration of 12 M. Nanocubes have a size range of 80–150 nm, as shown in Fig. 7a, in which a number of nanocubes overlapped. SEAD pattern (Fig. 7b) and the clear lattice fringes in the HR-TEM image of a single cube (Fig. 7c) indicate that cubes are also highly crystalized. TEM characterization on the nanocubes indicates a cubic structure that the growth plane is (110) with interplanar spacing of 0.27 nm.
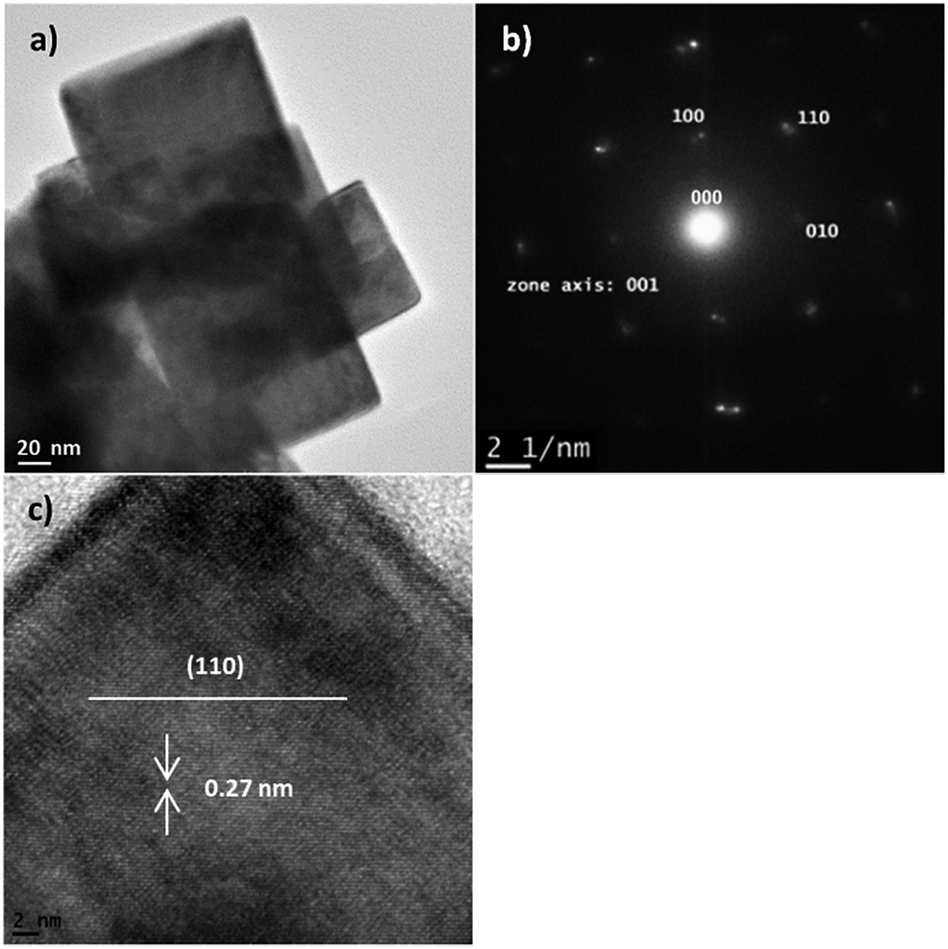 | ||
| Fig. 7 (a) TEM bright field micrograph, (b) SAED pattern and (c) HR-TEM image of the BNT nanocubes. | ||
Fig. 8 shows Raman spectrum of BNT nanofibres measured at room temperature. The samples were dried at 110 °C to bake out the absorbed moisture prior to Raman measurement. Three A1(TO) absorption bands related to perovskite structure appeared at 128, 267 and 529 cm−1 while A1,E(LO) band appears at 789 cm−1. Intense band at 128 cm−1 is assigned to Na–O vibrations while bands at 267 and 529 cm−1 are associated with TiO6 octahedral vibrations.30–33
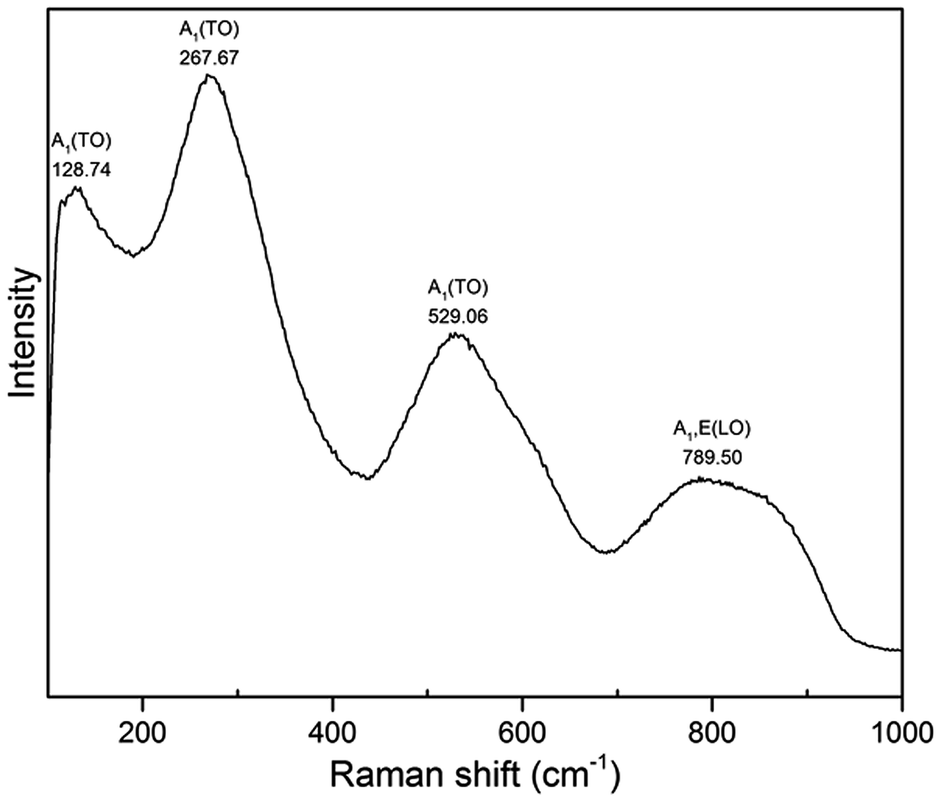 | ||
| Fig. 8 Raman spectrum of BNT nanofibres synthesized at 200 °C for 20 h with NaOH concentration of 12 M. | ||
While the piezoelectric properties of many one-dimensional materials have been reported,34–49 the electrical properties of BNT nanofibers are rarely investigated. In this work, piezoresponse of BNT nanofibers was measured by PFM with Dual AC Resonance Tracking (DART) mode. The sample was prepared by dispersing BNT nanofibers in ethanol and distributing on a Pt-coated silicon wafer followed by drying at 50 °C in oven. Fig. 9a describes a schematic of the direction of a nanofiber of interest against the PFM tip. For PFM measurements, a Ti/Ir-coated silicon tip was used and a force contact of 3 N m−1 was applied. Topography, piezoresponse amplitude and piezoresponse phase images of a 200 nm-diameter BNT nanofiber of interest are shown in Fig. 9b–d, respectively. Local piezoresponse of the BNT nanofiber was characterized by applying an AC voltage of 4 V between Pt bottom electrode and the conductive PFM tip under a DC voltage of ±45 V. The typical phase-voltage hysteresis loop and amplitude-voltage butterfly loop are observed as shown in Fig. 9e. The 180° piezoresponse phase reversal suggests the ferroelectric nature of the BNT nanofiber. A piezoelectric coefficient (d33) of ∼18 pm V−1 was estimated through measuring the slop of linear part of amplitude-voltage butterfly loop. Table 3 shows piezoelectric coefficient for some 1D piezoelectric materials synthesised with hydrothermal routes. These values indicate that our hydrothermally synthesised BNT nanofiber is highly comparable with other 1D piezoelectric materials, suggesting the potential of our BNT nanofibres for applications in nanogenerators and nanoactuators.
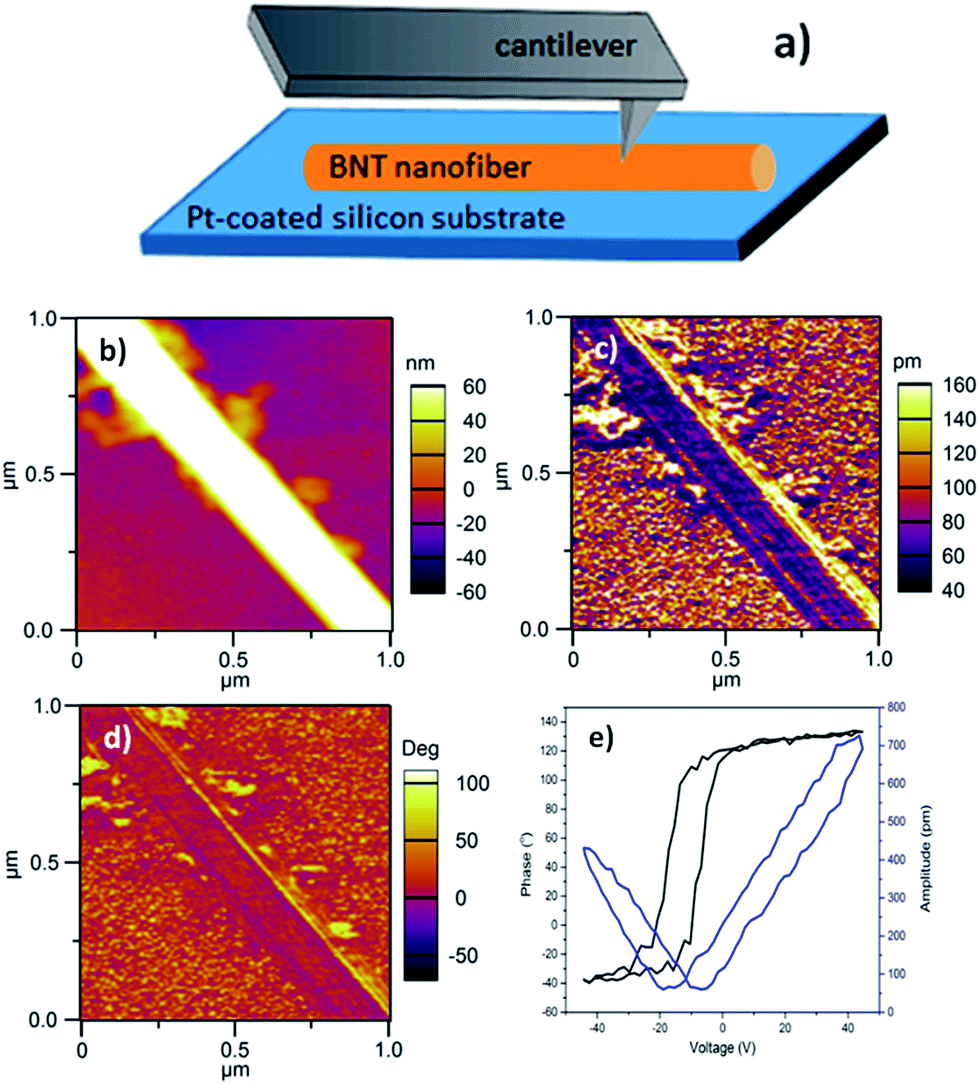 | ||
| Fig. 9 PFM results of a BNT nanofibres synthesized at 200 °C for 20 h with NaOH concentration of 12 M. (a) Schematic of a nanofiber on Pt/Si substrate for PFM measurement; (b) topography, (c) piezoresponse amplitude image, (d) piezoresponse phase image, (e) phase hysteresis and amplitude butterfly loops versus voltage. | ||
Conclusions
In conclusion, a morphology-optimized synthesis of BNT nanofibers has been accomplished by a simple and feasible hydrothermal method. The best combination of precursors was identified and the effect of several controllable factors on structure and morphology of BNT was investigated to increase the production of nanofibers. Effective control of the BNT morphology can be achieved through optimizing the mineralizer (NaOH) concentration, hydrothermal treatment time and temperature. It is found that the concentration of mineralizer is the dominant factor that determines the structure and morphology of BNT nanostructures, while reaction time has a more significant impact on morphology than treatment temperature. Large volume of highly crystallized BNT nanofibres with diameter of 150–200 nm was produced under the optimized hydrothermal conditions. Good piezoelectric response of d33 = ∼18 pm V−1 was confirmed by the PFM measurements, implying the potential applications of our BNT nanofibres in next generation nanoelectronic devices.Acknowledgements
This work was partially supported by the Australian Research Council Discovery Project (Grant No. DP170103514). D. Y. Wang also acknowledges the financial support of Silverstar Award, UNSW Australia (Grant number PS24402).Notes and references
- G. A. Smolenskii, V. A. Isupov, A. I. Agranovskaya and N. N. Krainik, Sov. Phys. Solid. State, 1961, 2, 2651 Search PubMed.
- A. Safari and M. Abazari, IEEE Trans. Ultrason. Eng., 2010, 57, 2165–2176 CrossRef PubMed.
- Y.-Q. Lu and Y.-X. Li, J. Adv. Dielectr., 2011, 1, 269–288 CrossRef CAS.
- I. Coondoo, N. Panwar and A. Kholkin, J. Adv. Dielectr., 2013, 3, 1330002 CrossRef.
- N. D. Quan, L. Huu Bac, D. van Thiet, V. N. Hung and D. D. Dung, Adv. Mater. Sci. Eng., 2014, 2014, 1–13 CrossRef.
- D. Q. Xiao, J. G. Wu, L. Wu, J. G. Zhu, P. Yu, D. M. Lin, Y. W. Liao and Y. Sun, J. Mater. Sci., 2009, 44, 5408–5419 CrossRef CAS.
- T. Takenaka and K. Sakata, Ferroelectrics, 1989, 95, 153–156 CrossRef CAS.
- J. J. Urban, W. S. Yun, Q. Gu and H. Park, J. Am. Chem. Soc., 2002, 124, 1186–1187 CrossRef CAS PubMed.
- B. Li, M.-S. Cao, J. Liu and D.-W. Wang, J. Am. Ceram. Soc., 2016, 11, 2316–2326 CrossRef.
- Y.-D. Hou, L. Hou, J.-L. Zhao, M.-K. Zhu and H. Yan, J. Electroceram., 2011, 26, 37–43 CrossRef CAS.
- Y. Zhao, R. L. Frost, W. N. Martens and H. Y. Zhu, Langmuir, 2007, 23, 9850–9859 CrossRef CAS PubMed.
- X.-Q. Fang, J.-X. Liu and V. Gupta, Nanoscale, 2013, 5, 1716–1726 RSC.
- M. M. Lencka, M. Oledzka and R. E. Riman, Chem. Mater., 2000, 12, 1323–1330 CrossRef CAS.
- X. Jing, Y. Li and Q. Yin, Mater. Sci. Eng., B, 2003, 99, 506–510 CrossRef.
- Y. J. Ma, J. H. Cho, Y. H. Lee and B. I. Kim, Mater. Chem. Phys., 2006, 98, 5–8 CrossRef CAS.
- K. Kanie, Y. Numamoto, S. Tsukamoto, T. Sasaki, M. Nakaya, J. Tani, H. Takahashi and A. Muramatsu, Mater. Trans., 2011, 52, 1396–1401 CrossRef CAS.
- T. Lu, J. Dai, J. Tian, W. Song, X. Liu, L. Lai, H. Chu, X. Huang and X. Liu, J. Alloys Compd., 2010, 490, 232–235 CrossRef CAS.
- Y. Liu, Y. Lu and S. Dai, J. Alloys Compd., 2009, 484, 801–805 CrossRef CAS.
- J. Li, G. Wang, H. Wang, C. Tang, Y. Wang, C. Liang, W. Cai and L. Zhang, J. Mater. Chem., 2009, 19, 2253 RSC.
- X. Ma, W. Zhang, L. Xue, S. Yin, L. Wan and Y. Yan, J. Mater. Sci., 2013, 48, 6878–6884 CrossRef CAS.
- Y. Masuda, T. Yamada and K. Koumoto, Cryst. Growth Des., 2008, 8, 169–171 CAS.
- R. Lu, J. Yuan, H. Shi, B. Li, W. Wang, D. Wang and M. Cao, CrystEngComm, 2013, 15, 3984 RSC.
- J. Yu, M. Zhang and M. Guo, CrystEngComm, 2011, 13, 1953–1958 RSC.
- B. L. Cushing, V. L. Kolesnichenko and C. J. O'Connor, Chem. Rev., 2004, 104, 3893–3946 CrossRef CAS PubMed.
- J. Tang and A. P. Alivisatos, Nano Lett., 2006, 6, 2701–2706 CrossRef CAS PubMed.
- P. Pookmaneea, S. Phanichphanta and R. B. Heimann, CFI, Ceram. Forum Int., 2001, 78, 28–30 Search PubMed.
- Q. Zhang, S.-J. Liu and S.-H. Yu, J. Mater. Chem., 2009, 19, 191–207 RSC.
- J. H. Jung, M. Lee, J. Il Hong, Y. Ding, C. Y. Chen, L. J. Chou and Z. L. Wang, ACS Nano, 2011, 5, 10041–10046 CrossRef CAS PubMed.
- X. Zhou, C. Jiang, C. Chen, H. Luo, K. Zhou and D. Zhang, CrystEngComm, 2016, 18, 1302–1310 RSC.
- Y. Wang, G. Xu, L. Yang, Z. Ren, X. Wei, W. Weng, P. Du, G. Shen and G. Han, Ceram. Int., 2009, 35, 1657–1659 CrossRef CAS.
- M.-S. Zhang, J. F. Scott and J. A. Zvirgzds, Ferroelectr., Lett. Sect., 1986, 6, 147–152 CrossRef CAS.
- M. K. Niranjan, T. Karthik, S. Asthana, J. Pan and U. V. Waghmare, J. Appl. Phys., 2013, 113, 0–7 CrossRef CAS.
- J. Kreisel, A. M. Glazer, P. Bouvier and G. Lucazeau, Phys. Rev. B, 2001, 63, 174106 CrossRef.
- Y. Q. Chen, X. J. Zheng, X. Feng, D. Z. Zhang and S. H. Dai, Phys. Status Solidi RRL, 2009, 292, 290–292 CrossRef.
- Y. Q. Chen, X. J. Zheng, X. Feng, S. H. Dai and D. Z. Zhang, Mater. Res. Bull., 2010, 45, 717–721 CrossRef CAS.
- I. Shoji, T. Kondo, A. Kitamoto, M. Shirane and R. Ito, J. Opt. Soc. Am. B, 1997, 14, 2268 CrossRef CAS.
- Z. Wang, A. P. Suryavanshi and M.-F. Yu, Appl. Phys. Lett., 2006, 89, 82903 CrossRef.
- X. Li, Y.-F. Lim, K. Yao, F. E. H. Tay and K. H. Seah, Chem. Mater., 2013, 25, 524–529 CrossRef CAS.
- L. Liang, X. Kang, Y. Sang and H. Liu, Adv. Sci., 2016, 3, 1–21 Search PubMed.
- Z. Wang, J. Hu, A. P. Suryavanshi, K. Yum and M.-F. Yu, Nano Lett., 2007, 7, 2966–2969 CrossRef CAS PubMed.
- M. Ghosh, S. Ghosh, M. Seibt, K. Y. Rao, P. Peretzki and G. Mohan Rao, CrystEngComm, 2016, 18, 622–630 RSC.
- S. D. Nguyen and P. S. Halasyamani, Inorg. Chem., 2013, 52, 2637–2647 CrossRef CAS PubMed.
- M. Liao, X. L. Zhong, J. B. Wang, S. H. Xie and Y. C. Zhou, Appl. Phys. Lett., 2010, 96, 12904 CrossRef.
- T. Y. Ke, H. A. Chen, H. S. Sheu, J. W. Yeh, H. N. Lin, C. Y. Lee and H. T. Chiu, J. Phys. Chem. C, 2008, 112, 8827–8831 CAS.
- S. Xu, G. Poirier and N. Yao, Nano Energy, 2012, 1, 602–607 CrossRef CAS.
- D. Y. Wang, K. Li and H. L. W. Chan, Sens. Actuators, A, 2004, 114, 1–6 CrossRef CAS.
- H. Tang, Z. Zhou and H. A. Sodano, Appl. Phys. Lett., 2014, 104, 142905 CrossRef.
- B. Yun, Y. Park, M. Lee, N. Lee, W. Jo, S. Lee and J. Jung, Nanoscale Res. Lett., 2014, 9, 4 CrossRef PubMed.
- M.-R. Joung, I.-T. Seo, J.-S. Kim, H. Xu, G. Han, M.-G. Kang, C.-Y. Kang, S.-J. Yoon and S. Nahm, Acta Mater., 2013, 61, 3703–3708 CrossRef CAS.
| This journal is © The Royal Society of Chemistry 2017 |