
 Open Access Article
 This Open Access Article is licensed under a
 Creative Commons Attribution 3.0 Unported Licence
Biofabrication of Fe nanoparticles in aqueous extract of Hibiscus sabdariffa with enhanced photocatalytic activities
Abdulmohsen Alshehria,
Maqsood Ahmad Malik *a,
Zaheer Khana,
Shaeel Ahmed Al-Thabaitia and
Nazim Hasanb
*a,
Zaheer Khana,
Shaeel Ahmed Al-Thabaitia and
Nazim Hasanb
aChemistry Department, Faculty of Science, King Abdulaziz University, P.O. Box 80203, Jeddah 21589, Saudi Arabia. E-mail: maqsoodchem@gmail.com
bDepartment of Chemistry, Faculty of Science, Jazan University, P.O. Box 2097, Jazan 82621, Saudi Arabia
First published on 10th May 2017
Abstract
Hibiscus sabdariffa is a strongly basic dye with a large number of medicinal applications and is used for various diagnostic purposes. The biofabrication of Fe nanoparticles using Hibiscus sabdariffa (Roselle) flower extract is an eco-friendly and cost-effective protocol reported for the first time in the present investigation. The natural plant extract acts as a non-toxic, biodegradable and economical reducing agent in the biosynthesis of the Fe nanoparticles. Different well-known complementary characterization techniques such as UV-vis spectroscopy, Fourier transform infrared spectroscopy (FTIR), transmission electron microscopy (TEM), X-ray diffraction (XRD), dynamic light scattering (DLS) and thermogravimetric analysis-differential scanning calorimetry (TGA-DSC) were used to investigate the morphological, structural and optical properties of the as-synthesised Fe nanoparticles. The resulting nanoparticles were then utilized as a photocatalyst for the degradation of the toxic organic dye Congo red (CR). UV-visible spectroscopy was used to determine the photocatalytic performance of the Fe nanoparticles under UV irradiation. The results of the photocatalytic degradation of Congo red in aqueous solution under UV light showed a higher photocatalytic activity. A reasonable mechanism was proposed for the enhanced photocatalytic activity of the Fe nanoparticles.
1. Introduction
Nanotechnology is an interdisciplinary area of research that has undergone extensive development and attracted attention worldwide during the last few years and has made an impact in different areas of human life.1,2 Metal nanoparticles have attracted considerable attention from researchers because of their unusual chemical and physical properties. They enable an array of potential applications in materials science, electronics, optics, medicine, biomedical science and engineering and catalysis.3–5 Among magnetic metallic nanomaterials, iron nanoparticles have gained considerable attention for site remediation and the treatment of water polluted by organic and inorganic contaminants because of the higher inherent reactivity of their surface sites.6 Iron nanoparticles have unique characteristics that include suitability for environmental remediation,7 high efficiency for the degradation of aqueous organic solutes,8,9 catalytic activity,10 and optical,11 electronic,12 and antibacterial properties. Thus, they find a role in a wide range of applications such as cosmetics,13 biomedicine,14 bioremediation,15 clinical materials,16 and engineering.17Fe nanoparticles have been synthesized by different chemical and physical methods such as electrochemical processes,18 photochemical reduction,19 thermal evaporation,20 etc.21 In general, sodium borohydride (NaBH4),22 hydrazine, sodium dodecyl sulphate, etc., are used in the presence of organic surfactants or with the use of capping agents.23–25 These reducing agents have proven fatal to the natural environment; in addition, they produce harmful by-products that damage human health.26 However, the majority of these techniques involve hazardous chemicals, require special equipment, employ large amounts of energy, are generally expensive and require complex cleansing processes. For this reason, there is a growing requirement to create environment-friendly and sustainable protocols for the synthesis of Fe nanoparticles. To overcome these technical complications, natural principles have been employed in recent years and materials science researchers are attempting to understand, mimic and exploit natural processes with this aim.27 The field of nanotechnology still demands an economical, commercially feasible and environment-friendly method for synthesizing nanoparticles.28
Shahwan et al. used green tea leaves to fabricate Fe nanoparticles. They utilized the resulting materials as a Fenton-like catalyst for the degradation of methylene blue and methyl orange.29 Nadagouda et al. reported the synthesis of iron nanoparticles utilizing green tea leaf and sorghum bran extracts.30 Maaza et al., Mishra et al., and Kalita and Ganguli used Hibiscus sabdariffa flower extract as a reducing and stabilizing agent for the synthesis of cerium oxide, gold, and silver nanoparticles, respectively, for the characterization of the main physical properties, the evaluation of cytotoxicity against U87 glioblastoma cells under hyperglycemic conditions, and the catalytic reduction of 4-nitrophenol.31–33 However, it is an essential environmental aspect of wastewater remediation to develop suitable eco-friendly semiconductor photocatalysts. Because light-assisted photoinitiated redox reactions, which are involved in the degradation of carcinogenic and neurotoxic dyes in industry, are tedious, photocatalysts have been proven to be effective reaction inducers involved in reducing environmental pollution. Likewise, water pollution caused by industrial waste leads to serious problems throughout the world.34 Moreover, some dyes, which are the by-products of textile industries, prove fatal to ecosystems and cause various severe problems such as carcinogenicity in humans, eutrophication in water bodies and damage to living organisms.35 Photocatalytic degradation under visible-light irradiation has gained widespread attention because it is rapid, highly efficient, and economical and causes no secondary pollution.36 The problems associated with conventional methods (the use of toxic stabilizers, solvents, and surfactants) encouraged us to synthesise biocompatible Fe nanoparticles using Hibiscus sabdariffa (HS) red flower extract as an effective stabilizing agent without the addition of a stabilizer or capping agent for the first time. In addition, the as-prepared Fe nanoparticles were used as a catalyst for the degradation of CR.
2. Experimental
2.1. Materials and chemical constituents of Hibiscus sabdariffa flowers
Iron(III) chloride hexahydrate (FeCl3·6H2O, purity > 99%) was purchased from Sigma-Aldrich. The water used as a solvent throughout this experiment was double-distilled water with a conductivity of 1.05 × 10⁻⁶ S cm−1. Hibiscus sabdariffa, which has the common name Roselle, belongs to the family Malvaceae and produces red flowers in the form of calyces. These fleshy calyces (sepals) are important raw materials for the food industry and have commercial importance for the production of beverages, juices, jams, and syrups. Furthermore, these calyces possess high pigment contents and are used as a good source of natural food colorants. In addition to the use of Roselle in the beverage and food industries, it is additionally consumed as animal feed and in nutraceuticals, cosmetics and pharmaceuticals.37 Numerous studies of the different constituents of this plant have been reported in the literature.38 Among these are a notable (and underreported) group of phenolic compounds, which have recently obtained a great amount of research interest owing to their vital role in the promotion of human health and hygiene. The chemical constituents present in this plant are phenolic compounds, flavonoids with their respective glycosides and anthocyanins. The compounds present in this plant include organic and phenolic acids such as hydroxycitric acid, citric acid, protocatechuic acid and hibiscus acid. Flavonoids such as gossypetin, quercetin, and luteolin and anthocyanin compounds such as cyanidin 3-rutinoside, delphinidin 3-sambubioside, cyanidin 3-sambubioside, cyanidin 3-glucoside and delphinidin 3-glucoside are also present in this plant. Maganha et al. also reported that delphinidin, delphinidin 3-glucoxyloside, delphinidin 3-monoglucoside and cyanidin 3,5-diglucoside are major anthocyanin components in HS.39 However, anthocyanin as a pigment is present in large amounts in the calyces and is responsible for their bright red color. Gradinaru et al. reported two predominant anthocyanins (delphinidin 3-sambubioside and cyanidin 3-sambubioside) and two minor anthocyanins (cyanidin 3-glucoside and delphinidin 3-glucoside) in HS.40 Fig. 1 shows the structures of some of these HS anthocyanins. | ||
| Fig. 1 Chemical structures of some anthocyanin compounds found in Hibiscus sabdariffa. | ||
2.2. Preparation of Hibiscus sabdariffa extract
Fresh samples of red petals of HS were collected from a local market in Jeddah, Saudi Arabia and were air-dried at room temperature. Hibiscus samples were stored in glass jars and flushed with nitrogen. Using a domestic blender, dried flowers of HS were ground to a fine powder. In a typical procedure, 10.0 g clean HS flower petals were weighed in a beaker and added to 400 mL distilled water. Our main objective was to carry out non-thermal extraction; therefore, the aqueous extraction solution was kept at room temperature for 25 h to obtain a high concentration of anthocyanins. The obtained red extract solution was then vacuum-filtered twice to eliminate any residual solids, and the red extract was collected for further experiments. It has been reported that aqueous extracts of HS have stronger antioxidant properties in comparison to extracts obtained with methanol.412.3. Biogenic preparation of Fe nanoparticles
In a typical experiment, a 0.01 M solution of FeCl3 was prepared with double-distilled water and freshly prepared HS extract was used as a reducing agent and stabilizer. For the biogenic synthesis of Fe nanoparticles, 5 mL HS extract was added to 100 mL of the aqueous solution of FeCl3 and stirring was carried out for 2 min at 25 °C to ensure that a homogeneous reaction occurred within the solution. It was observed that reduction took place rapidly, as indicated by a colour change. The entire reaction system was covered to avoid any photoinduced phenomena. The colloids were found to be stable for about one month and underwent no precipitation or colour change. The Fe sol solution was centrifuged to obtain a dried powder of Fe nanoparticles for further analyses and characterization.2.4. Characterization of Fe nanoparticles
The progress of the reaction and the reduction of Fe3+ to Fe0 were monitored by recording the UV-vis spectra of the nanoreaction mixture. The UV-visible spectra of the pure red extract of HS and the FeCl3 solution were also recorded for comparison with the spectrum of the Fe sol solution. UV-visible spectral analysis was carried out using a Shimadzu UV-260 spectrophotometer with 1 cm quartz cuvettes in the range from 200 to 700 nm. X-ray diffraction (XRD) was used to examine the structure of the synthesised Fe nanoparticles. This examination was carried out with Ni-filtered Cu Kα radiation (λ = 1.54056 Å) using a Rigaku X-ray diffractometer operating at 40 kV and 150 mA at a scanning rate of 0.02° per step in the 2θ range of 10° ≤ 2θ ≤ 80°. FTIR analysis was carried out to determine the functional groups present in HS flower extract and their possible involvement in the synthesis of Fe nanoparticles. The FTIR spectra of the synthesised Fe nanoparticles was also recorded in transmission mode (4000–650 cm−1) using a Bruker Tensor II FTIR spectrometer. The biofabricated Fe nanoparticles were characterized by dynamic light scattering (DLS) with the use of a Laser Spectroscatter 201 instrument (RiNA GmbH, Berlin, Germany). The polydispersity and particle size were determined by DLS measurements. The DLS measurements were performed using a beam of He–Ne laser at 660 nm, and Dispersion Technology Software (DTS) was used to fit the curves. The surface morphology of the Fe nanoparticles was examined by TEM coupled with an energy-dispersive X-ray spectrometer (EDX) (JSM-7001F, JEOL, Tokyo, Japan). The elemental contents of the synthesised Fe nanoparticles were determined at different magnifications by sprinkling the Fe nanoparticles onto a metallic carbon disk. Transmission electron microscopy (TEM) images were acquired to observe the morphology of the Fe nanoparticles with a JEOL JEM-2010F microscope (Tokyo, Japan) operating at 120 kV. Nanoparticle samples were sonicated in analytical-grade methanol for 30 s and mounted on carbon-coated copper grids. Thermogravimetric analysis (TGA) and differential scanning calorimetry (DSC) were also conducted using an EXSTAR TGA/DTA 6000 analyzer under a nitrogen atmosphere at a heating rate of 10 °C min−1 in an inert atmosphere to determine the presence of organic compounds from the HS flower extract.2.5. Photocatalytic activity
The photocatalytic degradation efficiency of the biofabricated Fe nanoparticles was measured by performing the degradation of CR dye under UV light irradiation. The photocatalytic activity of the Fe nanoparticles was determined by the decolourization of an aqueous solution of CR under UV irradiation. A stock solution of CR [2.0 × 10⁻³ M] [MW = 619.66 mg L−1 CR] was prepared by dissolving CR in an appropriate amount of deionized water. Further dilution of the stock solution was performed to obtain the desired experimental solutions used for degradation reactions. The photocatalytic experiments were performed in a 500 mL jacketed glass beaker equipped with a magnetic stirrer under UV light at 100 W (maximum emission at 365 nm) (Fig. 2). In a typical experiment, biologically synthesised Fe nanoparticles were dispersed in 250 mL of an aqueous solution of CR with continuous stirring. Before illumination, the suspension was stirred for 30 min in dark conditions to achieve adsorption/desorption equilibrium between the Fe nanophotocatalyst and CR. All dye degradation experiments were performed at 30 °C (room temperature) by continuous circulation of water to the outer jacket of the beaker (with the reactor in an aqueous medium) to ensure a constant temperature throughout the experiment. Then, the experimental mixture was exposed to UV irradiation with continuous stirring. At specific intervals, 5 mL samples of the experimental solution were withdrawn and centrifuged to separate the catalyst particles. The photocatalytic degradation of CR was monitored by measuring its absorbance with a UV-vis spectrophotometer. The reaction was monitored with a Shimadzu UV-260 spectrophotometer and the decrease in the absorbance intensity of CR at λmax = 497 nm was recorded at intervals of 10 min. The effects of the Fe photocatalyst concentration were investigated with loadings of 5.0, 10.0, 15.0, and 20.0 mg in 250 mL CR solution (1.0 × 10⁻⁵ M). One more set of experiments was carried out, in which initial CR concentrations of 1.0 × 10⁻⁵ M, 2.0 × 10⁻⁵ M, 3.0 × 10⁻⁵ M, and 4.0 × 10⁻⁵ M were used with a fixed loading of the Fe nanophotocatalyst of 15 mg in 250 mL dye solution. The optimum conditions that enable high photocatalytic degradation efficiency, such as the amount of catalyst and initial concentration of CR, and their influence on photocatalytic degradation were studied. The following equation was used to calculate the photocatalytic decolourization efficiency of the Fe nanoparticles for CR:42
 | (1) |
 | ||
| Fig. 2 Schematic of experimental setup for visible-light photodegradation of Congo red. | ||
3. Results and discussion
3.1. Characterization of biofabricated Fe nanoparticles
The formation of Fe0 by the reduction of Fe3+ was monitored by recording the UV-vis spectrum of the Fe nanoparticle solution in the range of 200–800 nm. The reduction of Fe3+ to Fe nanoparticles was evident from the colour change (to a yellowish-brown colour) when the red extract of HS was mixed with FeCl3. UV-visible spectroscopy is a useful technique for studying the kinetics of the formation of Fe nanoparticles. Fig. 3 shows the UV-visible spectrum of Fe nanoparticles stabilized by the organic constituents of HS extract. Studies of the UV-visible absorption spectra provided strong evidence of the formation of Fe nanoparticles and their growth. The absorption spectra of the FeCl3 solution and the extract of HS were recorded, as shown in Fig. 3. The peaks for the pure HS extract at 287, 322 and 519 nm correspond to the presence of various natural moieties in the extract. As shown in Fig. 3, the peaks for the HS extract at 287, 322 and 519 nm completely disappeared after the reaction with the iron ions, and the colour of the reaction mixture changed from red to dark yellow. More importantly, a strong absorption peak for the Fe nanoparticles synthesized by the HS extract was observed at 335 nm. This indicates that various components present in the extract acted as reducing and capping agents for the synthesis of the Fe nanoparticles. The hydroxyl groups present in biologically active molecules first bound with Fe3+ to give ferric hydroxide, which was partially reduced by other bioactive materials to form Fe nanoparticles. The UV-visible spectra of the as-synthesised Fe nanoparticles were also recorded as a function of time to determine their stability. We did not observe any significant changes in the shape of the UV-visible spectra (the position of the wavelength maxima and the absorbance remained constant with an increase in the reaction time; Fig. 3), which indicated that the resulting nanoparticles were stable under our experimental conditions and ruled out the possibility of their aggregation.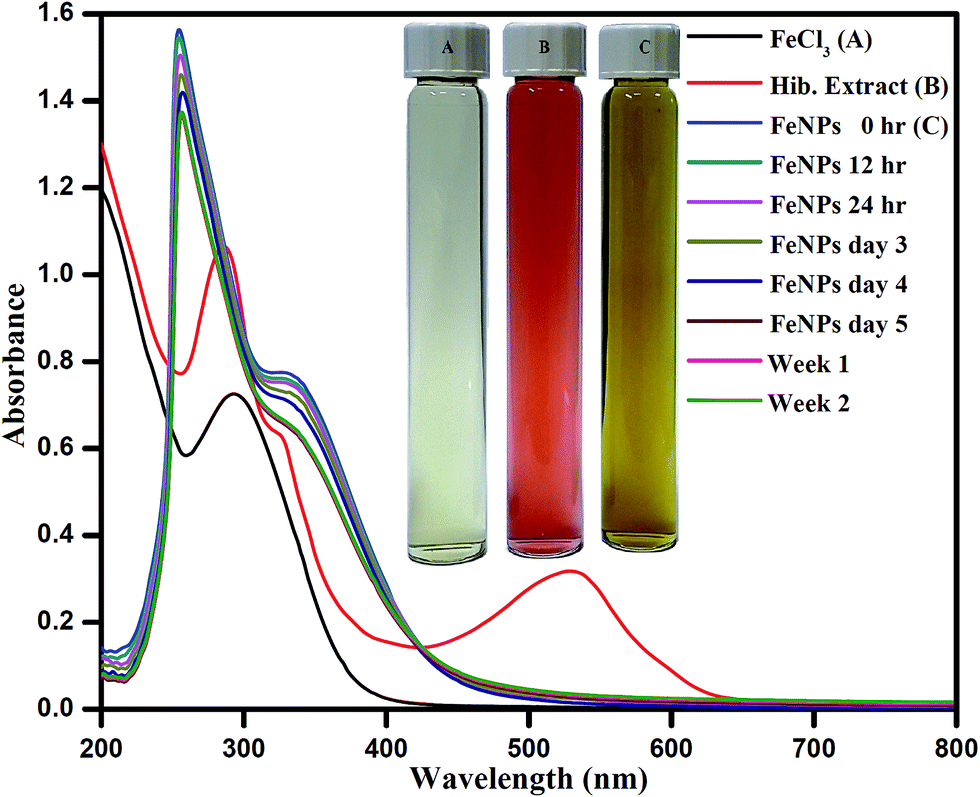 | ||
| Fig. 3 UV-vis spectra of the FeCl3 solution, the aqueous extract of red petals of Hibiscus sabdariffa and the Fe nanoparticles at different time intervals after synthesis. | ||
The shape, size, and morphology of the Fe nanoparticles were analyzed using transmission electron microscopy. Aliquots of the Fe nanoparticle solution were placed on a carbon-coated copper grid and allowed to dry under ambient conditions. A TEM image of the Fe nanoparticles is shown in Fig. 4(a), which reveals the successful biological formation and stabilization of the Fe nanoparticles. From the transmission electron microscopy (TEM) analysis, it is clear that the particles are mainly spherical with a size of 100 nm. The particles are observed to have a mixture of spherical morphologies and are well separated from each other. It can be seen that the one-pot reaction yielded nearly monodisperse Fe nanoparticles. The size distribution and the average size of the biologically synthesised Fe nanoparticles were measured by dynamic light scattering (DLS). The hydrodynamic radius RH was calculated by the Stokes–Einstein equation, and the diameter was found to be in the range of 10–100 nm (Fig. 4(b)). The size distribution of the Fe NPs was probably due to the fact that non-thermal extracts of HS in water contain various naturally derived compounds with different reducing properties.43 Anthocyanin compounds found in the HS petal extract probably played a crucial role in controlling the oxidation and aggregation of the Fe nanoparticles to enhance their dispersion by acting as surface capping agents. Delie et al. in their pioneering review suggested that the determination of the size and polydispersity index (PDI) of nanoparticles is not straightforward44 and is totally dependent on the experimental techniques (different physical theories and data processing methods), mean sizes of particles, variations in distribution, refractive index of the solvent used, and nature of the dispersive medium.45,46 The polydispersity of the as-prepared Fe nanoparticles was calculated using the following relation:47
| PDI = σ/Rd | (2) |
 | ||
| Fig. 4 (a) Transmission electron microscope image (inset – selected area electron diffraction (SAED) image of Fe-nanoparticle), (b) particle size measurement of by dynamic light scattering, (c) XRD pattern and (d) EDX spectrum of Fe-nanoparticles (inset – HR-TEM micrograph of a spherical Fe-nanoparticle). | ||
The biofabricated Fe nanoparticles were further investigated by XRD, as shown in Fig. 4(c). A series of X-ray diffraction patterns were recorded in the range of 20–70°. As can be clearly seen from Fig. 4(c), characteristic diffraction peaks were observed, which were assigned to the (220), (311), (400), (422), (511), and (440) Bragg reflections. Furthermore, these patterns were also comparable to the standard XRD pattern of magnetite (JCPDS card no. 89-0950). The purity of the synthesised material was observed from the wide-angle XRD pattern, and peaks could easily be identified and corresponded to the pure cubic phase of Fe nanoparticles. However, no additional peaks (impurity peaks) were observed, which confirms that high-purity crystalline Fe nanoparticles were successfully synthesised. The crystalline nature of the Fe-nanoparticles was analyzed by selected area electron diffraction (SAED) (Fig. 4(a) inset). The selected area electron diffraction (SAED) pattern has been recorded from an area where large number of nanoparticles was found and these biofabricated Fe-nanoparticles were observed to be crystalline. The HR-TEM (Fig. 4(d) inset) result also reveals that spherical Fe-nanoparticles were well dispersed and capped with water soluble anthocyanin compounds present in the HS petal extract. To identify the elemental composition of the Fe nanoparticles, energy-dispersive X-ray spectroscopy (EDS) (Fig. 4(d) (inset – HRTEM)) was carried out, which clearly revealed the presence of Fe and O elements in the composite. The spectrum contained intense peaks of C, O and Fe, which confirmed the presence of iron. The presence of Cu and C was due to the carbon-coated grid that was used for the preparation of the samples. Fe nanoparticles have reactive surfaces and are highly liable to be oxidised, and hence their particle size increases; nevertheless, anthocyanins stabilize the surfaces of iron nanoparticles and limit surface oxidation because of the biogenic molecular environment.
Analysis by Fourier transform infrared spectroscopy (FTIR) was carried out to identify the presence of biomolecules in the HS petal extract that were responsible for the bioreduction and stabilization of the Fe nanoparticles. The FTIR spectra of the HS extract and biologically synthesised Fe nanoparticles are shown in Fig. 5(a) and (b). In Fig. 5(b), two strong absorption bands are observed at around 638 cm−1 and 575 cm−1, which correspond to Fe–O bonds, whereas these bands are not observed in the spectrum of the HS extract (Fig. 5(a)).48 We confirmed the presence of anthocyanin compounds in the Fe NPs: the FTIR spectrum displays bands at 1629 cm−1 due to C![[double bond, length as m-dash]](https://www.rsc.org/images/entities/char_e001.gif) C stretching vibrations in aromatic rings and 1066 cm−1 due to C–O–C and O–H absorption peaks, respectively.49 The same pattern is also observed in Fig. 5(a) as a result of direct analysis of the HS extract, with bands at 1657 cm−1 and 1417 cm−1. Strong asymmetric stretching of vinyl alkyl ethers at 1220 cm−1 is observed in Fig. 5(b); on the other hand, vibrational bands of aliphatic hydrocarbons, which correspond to –CH and –CH2 groups, are observed at 2854 cm−1 and 2935 cm−1. The intense absorption bands at 3426 cm−1 and 3438 cm−1 in Fig. 5(b) and (a), respectively, are attributed to O–H stretching vibrations. HS has antioxidant properties that induce the reduction of the iron precursor salt, and nanoparticles stabilized by anthocyanin moieties are the resulting product, as confirmed by FTIR data.
C stretching vibrations in aromatic rings and 1066 cm−1 due to C–O–C and O–H absorption peaks, respectively.49 The same pattern is also observed in Fig. 5(a) as a result of direct analysis of the HS extract, with bands at 1657 cm−1 and 1417 cm−1. Strong asymmetric stretching of vinyl alkyl ethers at 1220 cm−1 is observed in Fig. 5(b); on the other hand, vibrational bands of aliphatic hydrocarbons, which correspond to –CH and –CH2 groups, are observed at 2854 cm−1 and 2935 cm−1. The intense absorption bands at 3426 cm−1 and 3438 cm−1 in Fig. 5(b) and (a), respectively, are attributed to O–H stretching vibrations. HS has antioxidant properties that induce the reduction of the iron precursor salt, and nanoparticles stabilized by anthocyanin moieties are the resulting product, as confirmed by FTIR data.
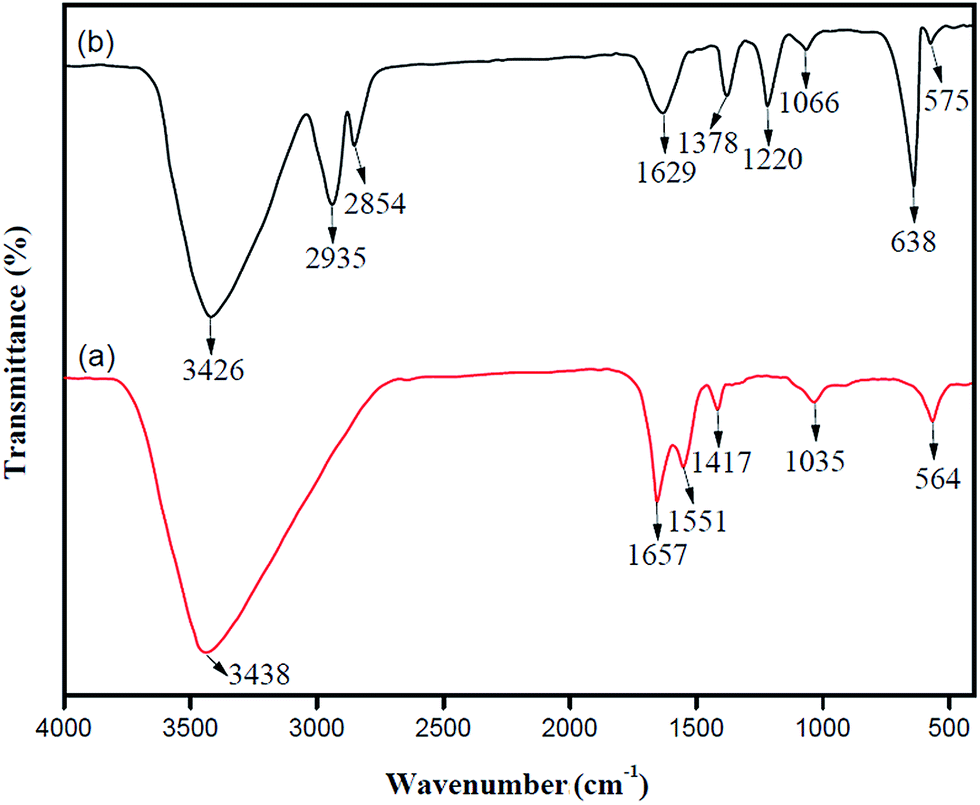 | ||
| Fig. 5 FTIR spectra of (a) aqueous extract of HS and (b) synthesised Fe nanoparticles. | ||
It has been established that the weight loss of metal nanoparticles at lower (≤200 °C) and higher temperatures (≥200 °C) might be due to the evaporation of adsorbed water and the breakdown of the organic skeleton, respectively.50,51 The decomposition pathway of Fe nanoparticles was studied by TGA and DSC analysis. Fig. 6 shows that the weight loss of the Fe nanoparticles started at ca. 130 °C, which might be due to the removal of water chemisorbed on the crystal lattice. The second exothermic peak at ca. 275 °C was due to the combustion of organic constituents present on the surface of the Fe nanoparticles. Some residues were left (ca. 40%) above 600 °C, which were stable up to 900 °C. The DSC curve displays two main peaks (one exothermic peak at 680 °C and another endothermic peak at 720 °C; Fig. 6). We did not observe any mass loss at higher temperatures. Thus, we may state confidently that pure zero-valent Fe nanoparticles were formed under our experimental conditions.
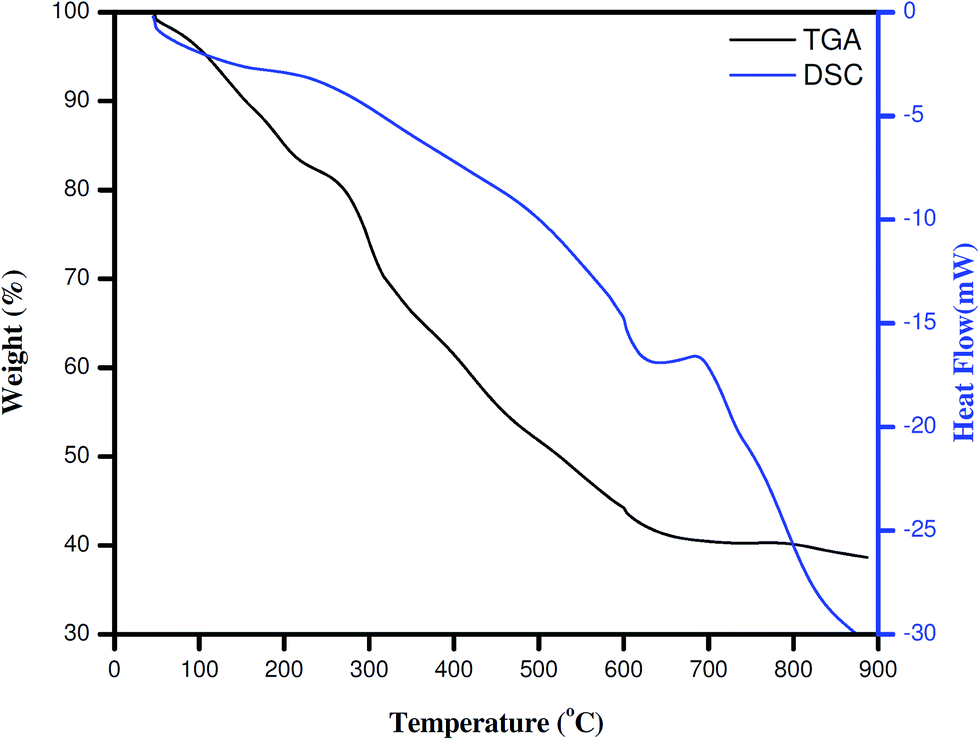 | ||
| Fig. 6 TGA and DSC curves of Fe nanoparticles obtained from aqueous extract of HS. | ||
It is well known that HS petal extracts contain various organic acids (L-ascorbic, citric, malic, stearic, and protocatechuic), anthocyanins, saccharides (galactose, mucopolysaccharide, and polysaccharide), carotene, pectin, and wax.52 The literature includes multiple investigations of the use of ascorbic acid as a reductant for carrying out the syntheses of various metal nanoparticles (Ag, Au, Cu, and Fe). It has been established that the presence of a capping agent, which hinders the unlimited growth of nanoparticles, is essential for the synthesis of perfectly transparent sols of these metal nanoparticles.53–56 In the present study, the Hibiscus sabdariffa extract acted as a reducing agent as well as a capping agent. Thus, we may state confidently that the presence of a stabilizer is not mandatory for the synthesis of Fe nanoparticles using a green chemical reduction method.
3.2. Photocatalytic activity of biofabricated Fe nanoparticles
CR (1-naphthalene sulphonic acid, 3,3′-(4,4′-biphenylenebis(azo))bis(4-amino-) disodium salt) is a benzidine-based anionic azo dye, which was selected as a model pollutant because it is associated with carcinogenicity and causes great harm to aquatic biota. CR has an aromatic structure that provides physicochemical, thermal and optical stability.57 CR has a wide range of uses in plastics, paper, rubber, textile industries and microbiology. Environmentally, CR has some adverse effects on the human body such as respiratory tract irritation, eye irritation, and central nervous system depression if direct contact or inhalation occurs. As-prepared Fe nanoparticles that were reduced and stabilized by HS were investigated for the photocatalytic degradation of CR under visible-light irradiation. Fig. 7(a) shows the effect of the Fe nanoparticles on the oxidation of CR under visible-light irradiation. The main absorbance peaks of CR with the Fe nanoparticles were at wavelengths of 497 nm (π → π*), 350 nm (n → π*) and 235 nm (n → n*) because of the azo functional group. The intensity of the peaks gradually decreased as the irradiation time increased. The UV-visible spectrum shows that the Fe nanoparticles displayed rapid photocatalytic activity on the surface, which is stabilized by biological moieties, as depicted in Fig. 7(b), which shows the percentage degradation of CR at different exposure times under UV light irradiation in the presence of Fe nanoparticles. Fig. 7(c) shows the degradation efficiency of CR under optimum experimental conditions, and it is clearly indicated in the plot that CR was completely degraded. The percentage degradation of the dye was calculated using eqn (1). Within 30 minutes the Fe nanoparticles degraded more than 55% of CR. This is explained on the basis that the nanoparticles were stabilized by anthocyanin moieties from the HS extract, which enhanced the immobilization of dye molecules on the nanoparticle surface, and photocatalytic activity occurred immediately under UV light. As ultraviolet light was incident on the Fe nanoparticles, photogenerated electron–hole pairs were generated and migrated to the nanoparticle surface to induce redox reactions of aqueous organic substrates in the presence of oxygen. | ||
| Fig. 7 (a) UV-vis spectra of the degradation of CR, (b) percentage degradation of CR dye with respect to irradiation time, (c) degradation efficiency of CR, and (d) pseudo-first-order kinetics of degradation of CR. | ||
Kinetic analysis is one of the most significant methods of defining reaction pathways. The kinetic parameters of the visible-light degradation of aqueous CR dye by Fe nanoparticles were investigated under optimum conditions to understand the reaction characteristics of the anionic CR dye under UV irradiation (Fig. 7(d)). A plot of the degradation of CR with respect to the irradiation time (plot of ln(Co/C) vs. irradiation time) follows a linear relationship and thus exhibits pseudo-first-order kinetics (eqn (3)):58
 | (3) |
In photocatalytic processes, an important factor is the amount of catalyst, which determines the rate of degradation and has been thoroughly studied. Throughout the experiment, a fixed dye concentration (1.0 × 10⁻⁵ M) and an irradiation time of 70 min were employed with different loadings of Fe nanoparticles (5.0, 10.0, 15.0, and 20.0 mg in 250 mL CR solution). Fig. 8(a) shows the effect of the amount of catalyst on the degradation efficiency of Congo red dye. At a dose of Fe nanoparticles of 15.0 mg the maximum efficiency was attained in comparison to the other doses. It is known that in heterogeneous photocatalytic reactions there is an increase in photodegradation in proportion with the catalyst loading.59,60 In general, for a given photocatalytic application it is necessary to determine the optimum catalyst concentration to avoid the use of excess catalyst and to ensure optimum absorption efficiency of photons. This may be attributed to unfavourable light scattering and hindered penetration of light into the solution in the event of excess photocatalyst loading. It can be explained on the basis of the active sites and surface availability of the catalyst, as well as the penetration of UV light into the suspension. The maximum efficiency of the Fe nanoparticles was achieved at a dose of 15.0 mg, and the efficiency decreased when the dose was increased further to 20.0 mg. On the basis of observations of the catalyst loading efficiency, the catalyst loading was kept at 15.0 mg in the degradation experiments to achieve the maximum performance.
 | ||
| Fig. 8 The effects of the catalyst concentration (a), the initial dye concentration (b), and the pH (c) on the photodegradation of CR. | ||
The efficiency depended on the dye concentration, which is worth considering from the viewpoint of applications. As shown in Fig. 8(b), the maximum efficiency for dye degradation was observed at a pH of 4 with 15 mg Fe nanoparticles. A degradation rate of 96.1% was achieved at a dye concentration of 1 × 10⁻⁵ M at room temperature (30 °C). It was observed that for aqueous concentrations of CR of 2.0 × 10⁻⁵ M, 3.0 × 10⁻⁵ M and 4.0 × 10⁻⁵ M the degradation rate decreased to 80%, 71% and 60%, respectively. The reason for the observed changes could be linked to the adsorption of an increasing number of dye molecules on the surface of the Fe nanoparticles with an increase in the initial dye concentration. The UV light irradiation time and amount of photocatalyst were kept constant, which led to the formation of dimers and higher-order aggregates owing to hydrophobic interactions between aromatic rings. Hence, the rate of formation of hydroxyl and superoxide radical anions was dramatically reduced, and thereby the rate of degradation decreased. The adsorbed dye molecules at high concentrations could have exerted an inhibitory effect on the photocatalytic degradation, which was possibly due to a lack of direct contact between photogenerated holes, hydroxyl radicals or superoxide radicals. Moreover, the presence of high concentrations of the dye may have acted as an inner filter that resulted in excitation by photons away from the surface of the Fe nanoparticles. At high concentrations, most of the dye molecules, after being adsorbed on the surface of Fe nanoparticles, may block the active reaction sites and might result in a decrease in the photodegradation efficiency.60
The nature of the dye, the surface of the photocatalyst and the pH are essential parameter that impose limits on the extent of degradation and greatly influence the photocatalytic degradation of dyes. Therefore, it is necessary to optimize the pH for the complete degradation of dyes. The surface charge properties of the photocatalyst are related to the pH of the experimental suspension. The effects of the pH on the degradation of CR were investigated using the optimum amount (15.0 mg) of Fe nanoparticles at a fixed concentration of CR solution (1.0 × 10⁻⁵ M) in the pH range of 4.0 to 10.0 (Fig. 8(c)). As the pH increases the surface of a photocatalyst becomes negatively charged and causes the repulsion of anionic surfaces of the dye from the catalyst surface, which thus results in a corresponding decline in the degradation of CR.61,62 Furthermore, the magnetic Fe nanoparticles can be easily recovered by applying a magnetic force after the treatment of the dye and can be recycled for multiple treatment procedures owing to their long-term stability. Thus, photocatalysis by Fe nanoparticles could be used as a practical and useful technique for the removal of carcinogenic azo dyes from wastewater, which contributes to environmental pollution.
In a typical experiment, Fe nanoparticles were recovered by adding a magnetic bar to a decolorized reaction mixture containing CR and Fe nanoparticles. The solution was decanted, the magnetic bar was taken out, and the particles were dispersed in double-distilled water. The resulting black dispersion of particles was centrifuged and the Fe nanoparticles were separated. The recovered Fe nanoparticles were reused five times for the degradation of CR under similar experimental conditions. Fig. 9 shows that the performance of the nanoparticles was slightly affected after the fourth cycle, which indicated that the as-prepared Fe nanoparticles acted as an excellent catalyst without the loss of catalytic activity.
 | ||
| Fig. 9 Recovery and reuse of Fe nanoparticles for the catalytic degradation of CR under UV light irradiation. | ||
On the basis of the above observed results, a suitable mechanistic pathway for the degradation of Congo red dye by Fe nanoparticles in aqueous solution can be proposed. A possible photocatalytic mechanism of the use of Fe nanoparticles for the degradation of aqueous Congo red is illustrated in Fig. 10. In Fe nanoparticles photogenerated holes in the valence band hvb+ are made to react with H2O and OH− to generate reactive OH˙ and H+ species. Furthermore, e− in the conduction band generate an electron resonance plasma over the nanoparticle surface and react with O2 to generate O2˙−. The hydroxyl radicals (OH˙) and superoxide radical anions (O2˙−) generated in the Fe nanoparticles enable the oxidation process on the surface of the nanoparticles and enrich CR dye simultaneously. These free radicals resulted in the bleaching of the CR dye within 10 min, the degradation of CR, and the generation of intermediate products (Fig. 10). It is clear from the obtained data that the Fe nanoparticles stabilized by HS extract enable the immobilization of the dye on their surface and exhibit high photocatalytic activity. Thus, these Fe nanoparticles can be employed as a photocatalyst for the treatment of wastewater derived from textile industries.
 | ||
| Fig. 10 (a) Structure of Congo red and (b) scheme of the photocatalytic mechanism of the Fe nanoparticles under UV light irradiation. | ||
4. Conclusions
The green fabrication of Fe nanoparticles was carried out using HS extract, taking advantage of the natural reducing and capping ability of its constituent compounds. A facile and green approach to the synthesis of Fe nanoparticles from an aqueous solution of iron(III) chloride using an aqueous extract of HS was described. It was demonstrated that the aqueous extract of HS contains components that have the ability to reduce the iron salt to Fe NPs. FTIR spectroscopy showed that the biomolecules present in the aqueous extract of HS were responsible for reducing FeCl3 and capping the active molecules in the Fe nanoparticles. UV-visible spectroscopy and TEM suggested that the produced nanoparticles were stable, and XRD and EDX confirmed their structure and elemental composition, respectively. Overall, the proposed green synthetic method is simple and eco-friendly because it does not require any additional surfactants or reductants and it could produce Fe nanoparticles that are useful for nanotechnology applications. The outstanding photocatalytic activity of the Fe nanoparticles was primarily ascribed to their high photodegradation capacity for CR. It can be concluded that this study may provide several new insights into the understanding and preparation of Fe nanoparticles as high-performance photocatalysts. As a whole, the single-step biosynthesis of Fe nanoparticles is environmentally safe and robust, and the catalytic activity of these Fe nanoparticles for the degradation of CR was non-toxic, economically viable and environmentally benign. These findings highlighted the above method for the production of excellent photocatalysts for the degradation of azo dyes.Acknowledgements
This project was funded by the Saudi Basic Industries Corporation (SABIC) and the Deanship of Scientific Research (DSR) at King Abdulaziz University, Jeddah, under grant no. (S-17-342-37). The authors, therefore, acknowledge with thanks SABIC and DSR for technical and financial support.References
- M. C. Roco and W. S. Bainbridge, J. Nanopart. Res., 2005, 7, 1–13 CrossRef.
- M. A. Albrecht, C. W. Evan and C. L. Raston, Green Chem., 2006, 8, 417–432 RSC.
- D. Bhattacharyya, S. Singh, N. Satnalika, A. Khandelwal and S. H. Jeon, International Journal of u- and e-Service, Science and Technology, 2009, 2, 229–238 Search PubMed.
- A. L. Kane, D. R. Bond and J. A. Gralnick, ACS Synth. Biol., 2013, 2, 93–101 CrossRef CAS PubMed.
- Y. Lee, A. Loew and S. Sun, Chem. Mater., 2010, 22, 755–761 CrossRef CAS.
- K. S. Prasad, P. Gandhi and K. Selvaraj, Appl. Surf. Sci., 2014, 317, 1052–1059 CrossRef CAS.
- H. Y. Shu, M. C. Chang, H. H. Yu and W. H. Chen, J. Colloid Interface Sci., 2007, 314, 89–97 CrossRef CAS PubMed.
- S. Shin, H. Yoon and J. Jang, Catal. Commun., 2008, 10, 178–182 CrossRef CAS.
- L. Xu and J. Wang, J. Hazard. Mater., 2011, 186, 256–264 CrossRef CAS PubMed.
- T. Shahwana, S. Abu Sirriah, M. Nairata, E. Boyacıb, A. E. Eroglub, T. B. Scottc and K. R. Hallam, Chem. Eng. J., 2011, 172, 258–266 CrossRef.
- B. K. Pandey, A. K. Shahi, S. Jyoti and R. K. Kotnala, Appl. Surf. Sci., 2014, 289, 462–471 CrossRef CAS.
- F. Huilong, P. Zhiwei, L. Lei, Y. Yang, L. Wei, L. G. S. Errol, F. Xiujun and M. T. James, Nano Res., 2014, 7, 502–510 CrossRef.
- L. S. Ana, M. O. Riansares, S. L. Jon and C. Carmen, Anal. Methods, 2014, 6, 38–56 RSC.
- K. G. Ajay and G. Mona, Biomaterials, 2005, 26, 3995–4021 CrossRef PubMed.
- B. Juliane, B. Julian and U. M. Rainer, New Biotechnol., 2013, 30, 793–802 CrossRef PubMed.
- C. Chen, X. Jiang, Y. V. Kaneti and A. Yu, Powder Technol., 2013, 236, 157–163 CrossRef CAS.
- X. Li, W. L. Elliot and W. Zhang, Crit. Rev. Solid State Mater. Sci., 2006, 31, 111–122 CrossRef CAS.
- B. Yin, H. Ma, S. Wang and S. Chen, J. Phys. Chem. B, 2003, 107, 8898–8904 CrossRef CAS.
- S. Keki, J. Torok, G. Deak, L. Daróczi and M. Zsuga, J. Colloid Interface Sci., 2000, 229, 550–553 CrossRef CAS PubMed.
- A. B. Smetana, K. J. Klabunde and C. M. Sorensen, J. Colloid Interface Sci., 2005, 284, 521–526 CrossRef CAS PubMed.
- L. T. Kuhn, A. Bojesen, L. Timmermann, M. M. Nielsen and S. Morup, J. Phys.: Condens. Matter, 2002, 14, 13551–13567 CrossRef CAS.
- P. Monalisa and P. L. Nayak, Int. J. Plant, Anim. Environ. Sci., 2013, 3, 68–78 Search PubMed.
- S. C. G. Kiruba Daniel, G. Vinothini, N. Subramanian, K. Nehru and M. Sivakumar, J. Nanopart. Res., 2013, 15, 1–10 CrossRef.
- V. Smuleac, R. Varma, S. Sikdar and D. Bhattacharyya, J. Membr. Sci., 2011, 379, 131–137 CrossRef CAS PubMed.
- Y. P. Sun, X. Q. Li, W. X. Zhang and H. P. Wang, Colloids Surf. A, 2007, 308, 60–66 CrossRef CAS.
- S. Malathi, V. Ramya, T. Ezhilarasu, T. Abiraman and S. Balasubramanian, J. Nanotechnol., 2014, 1–7 Search PubMed.
- C. Jayseelan, R. Ramkumar, A. A. Rahman and P. Perumal, Ind. Crops Prod., 2013, 45, 423–429 CrossRef.
- D. Jain, H. K. Daima, S. Kachhwaha and S. L. Kothari, Dig. J. Nanomater. Bios., 2009, 4, 557–563 Search PubMed.
- T. Shahwan, S. A. Sirriah, M. Nairat, E. Boyacı, A. E. Eroglu, T. B. Scottc and K. R. Hallam, Chem. Eng. J., 2011, 172, 258–266 CrossRef CAS.
- M. N. Nadagouda, A. B. Castle, R. C. Murdock, S. M. Hussain and R. S. Varma, Green Chem., 2010, 12, 114–122 RSC.
- N. Thovhogi, A. Diallo, A. Gurib-Fakim and M. Maaza, J. Alloys Compd., 2015, 647, 392–396 CrossRef CAS.
- P. Mishra, S. Ray, S. Sinha, B. Das, M. I. Khan, S. K. Behera, S.-Il. Yun, S. K. Tripathy and A. Mishra, Biochem. Eng. J., 2016, 105, 264–272 CrossRef CAS.
- N. K. Kalita and J. N. Ganguli, Inorganic and Nano-Metal Chemistry, 2017, 47, 788–793 CrossRef CAS.
- R. A. Crane and T. B. Scott, J. Hazard. Mater., 2012, 211–212, 112–125 CrossRef CAS PubMed.
- M. Visa and A. Duta, J. Hazard. Mater., 2013, 244–245, 773–779 CrossRef CAS PubMed.
- B. P. Nenavathu, A. V. R. K. Rao, A. Goyal, A. Kapoor and R. K. Dutta, Appl. Catal., A, 2013, 459, 106–113 CrossRef CAS.
- S. M. Lam, J. C. Sin, A. Zuhairi Abdullah and A. Rahman Mohamed, Mater. Lett., 2013, 93, 423–426 CrossRef CAS.
- M. L. Wang, B. Morris, B. Tonnis, J. Davis and G. A. Pederson, J. Agric. Food Chem., 2012, 60, 6620–6626 CrossRef CAS PubMed.
- E. G. Maganha, R. D. Halmenschlager, R. M. Rosa, J. A. P. Henriques, A. Ramos and J. Saffi, Food Chem., 2010, 118, 1–10 CrossRef CAS.
- G. Gradinaru, C. G. Biliaderis, S. Kallithraka, P. Kefalas and C. Garcia-Viguera, Food Chem., 2003, 83, 423–436 CrossRef CAS.
- B. H. Ali, N. Al Wabel and G. Blunden, Phytother. Res., 2005, 19, 369–375 CrossRef CAS PubMed.
- E. Prenesti, S. Berto, P. G. Daniele and S. Toso, Food Chem., 2007, 100, 433–438 CrossRef CAS.
- S. Danwittayakul, M. Jaisai and J. Dutta, Appl. Catal., B, 2015, 163, 1–8 CrossRef CAS.
- M. Gaumet, A. Vargas, R. Gurny and F. Delie, Eur. J. Pharm. Biopharm., 2008, 69, 1–9 CrossRef CAS PubMed.
- D. E. Koppel, J. Chem. Phys., 1972, 57, 4814–4820 CrossRef CAS.
- A. Bootz, V. Vogel, D. Schubert and J. Kreuter, Eur. J. Pharm. Biopharm., 2004, 57, 369–375 CrossRef CAS PubMed.
- D. Shi, M. E. Sadat, A. W. Dunn and D. B. Mast, Nanoscale, 2015, 7, 8209–8232 RSC.
- N. Hasan, Z. Guo and H. F. Wu, Anal. Bioanal. Chem., 2016, 408, 6269–6281 CrossRef CAS PubMed.
- N. M. Salem, A. L. Ahmad and A. M. Awwad, Nanosci. Nanotechnol., 2013, 3, 48–51 Search PubMed.
- Z. Durmus, H. Kavas, M. S. Toprak, A. Baykal, T. G. Altınçekiç, A. Aslan, A. Bozkurt and S. Coşgun, J. Alloys Compd., 2009, 484, 371–376 CrossRef CAS.
- A. K. Peacock, S. I. Cauët, A. Taylor, P. Murray, S. R. Williams, J. V. M. Weaver, D. J. Adamsa and M. J. Rosseinsky, Chem. Commun., 2012, 48, 9373–9375 RSC.
- B. H. Ali, N. A. Wabel and G. Blunden, Phytother. Res., 2005, 19, 369–375 CrossRef CAS PubMed.
- S. A. Al-Thabaiti, F. M. Al-Nowaiser, A. Y. Obaid, A. O. Al-Youbi and Z. Khan, Colloids Surf., B, 2008, 67, 230–237 CrossRef CAS PubMed.
- Z. Khan, T. Singh, J. I. Hussain and A. A. Hashmi, Colloids Surf., B, 2013, 104, 11–17 CrossRef CAS PubMed.
- S. A. Al-Thabaiti, A. Y. Obaid, Z. Khan, O. Bashir and S. Hussain, Colloid Polym. Sci., 2015, 293, 2543–2554 CAS.
- J. Perez-Juste, L. M. Liz-Marzan, S. Carnie, D. Y. C. Chan and P. Mulvaney, Adv. Funct. Mater., 2004, 14, 571 CrossRef CAS.
- A. Afkhami and R. Moosavi, J. Hazard. Mater., 2010, 174, 398–403 CrossRef CAS PubMed.
- R. Lamba, A. Umar, S. K. Mehta and S. K. Kansal, Talanta, 2015, 131, 490–498 CrossRef CAS PubMed.
- C. G. Silva, Y. Bouizi, V. Fornes and H. Garcia, J. Am. Chem. Soc., 2009, 131, 13833–13839 CrossRef PubMed.
- P. R. Chowdhury and K. G. Bhattacharyya, Dalton Trans., 2015, 44, 6809–6824 RSC.
- I. Kazeminezhad and A. sadollahkhani, Mater. Lett., 2014, 120, 267–270 CrossRef CAS.
- A. Sadollahkhani, Z. H. Ibupoto, S. Elhaga, O. Nura and M. Willandera, Ceram. Int., 2014, 40, 11311–11317 CrossRef CAS.
| This journal is © The Royal Society of Chemistry 2017 |