 Open Access Article
Plasmonic-induced SERS enhancement of shell-dependent Ag@Cu2O core–shell nanoparticles†
Lei Chen ab,
Huanhuan Suna,
Yue Zhaoa,
Yongjun Zhang*a,
Yaxin Wanga,
Yang Liua,
Xiaolong Zhanga,
Yuhong Jianga,
Zhong Hua*a and
Jinghai Yanga
aKey Laboratory of Functional Materials Physics and Chemistry, Ministry of Education, College of Physics, Jilin Normal University, Changchun 130103, P. R. China. E-mail: yjzhang@jlnu.edu.cn
bKey Laboratory of Preparation and Applications of Environmental Friendly Materials, Ministry of Education, College of Chemistry, Jilin Normal University, Changchun 130103, P. R. China
First published on 15th March 2017
Abstract
In this study, we designed shell-dependent Ag@Cu2O core–shell nanoparticles (NPs) for SERS study. Compared to Cu2O NPs, Ag@Cu2O core–shell NPs exhibited high SERS activity because of the localized surface plasmon resonance (LSPR) from Ag core. For electron–hole pairs in Cu2O, the plasmon-induced resonant energy transfer from silver to Cu2O and the direct electron transfer can be simultaneously observed from the SERS intensity and the red-shift of the extinction spectra. Therefore, charge separation between silver and Cu2O will lead to high SERS activity. Moreover, the SERS activity of the Ag@Cu2O core–shell NPs can be modulated by changing the shell thickness, and it was found that SERS was optimal for the shell thickness of around 31 nm. The proposed enhancement mechanism can be extended to any metal–semiconductor complex system, which is contributed from plasmonic-induced SERS.
1. Introduction
Since its discovery on a rough silver electrode in 1974, surface-enhanced Raman scattering (SERS) has received significant attention for its high sensitivity in single-molecule determination.1–3 Nowadays, SERS is being widely applied in many areas because of its potential application in medical diagnosis, biological determination, colloidal and surface chemistry, electrochemistry, and analytical chemistry.4–8 Generally, the enhancement mechanisms of Raman signal from a SERS-active substrate can be divided into two mechanisms: electromagnetic mechanism (EM) and chemical mechanism (CM).9–11 EM enhancement mainly stems from surface plasmon resonance on a metal substrate,12 whereas CM enhancement is mainly attributed to charge-transfer (CT) between the substrate and probe molecule, which is a resonance-like process.13–15For most plasmonic-based SERS study, researchers focus on metal materials, which are induced via localized surface plasmon resonance (LSPR) by light irradiation and provide special optical responsive component in SERS.16,17 By controlling the sizes, morphologies, composition, and geometry of the particles, we can easily tune the LSPR properties of these particles.18–21 Noble metal cores@semiconductor shell nanocomposites have been recognized as a promising functional material with the unique plasma oscillation mode. A number of corresponding architectures including Au@Cu2O,22 Au@TiO2,23 Ag@Cu2O,24 Ag@Fe2O3,25 and so on have been synthesized in the past few years. The biggest advantage of employing semiconductor@metal systems in comparison to metals or semiconductors is that there are numerous additional properties that may be easily controlled such as phonon coupling strength, plasmon-induced resonant energy transfer, LSPR, and surface morphology.26–28 The optical properties of the semiconductor@metal system can be theoretically interpreted via the plasmon hybridization model in which the geometrically tunable plasmon resonances of the core–shell conformation originate because of the interactions between the plasmons supported by the inner metallic core and the outer semiconductor surfaces of the shell.22–25
Cu2O is a wide-band-gap p-type semiconductor (2.2 eV) that exhibits potential applications in biochemical sensors, photocatalysis, ultraviolet-visible light emission devices, and so on.29 Previously, it has been reported that Cu2O is a type of SERS-active semiconductor, for which, the extinction properties can be fine-tuned across the visible and near-infrared spectral regions by introducing a metal (silver or gold) into Cu2O.24 For SERS-based study on the Cu2O material, Kudelski and co-workers30 first observed the SERS activity on both Cu2O colloidal and Cu2O-coated copper electrodes. Another study reported that the SERS signal of 4-Mpy can be significantly enhanced on Cu2O/Ag nanocomposites.31 In addition, core–shell metal@semiconductor heterostructures have unique properties compared with the pure metal or semiconductor. The core–shell framework is promising for constructing a novel photoelectric system. Moreover, Cu@Cu2O and Cu2O hollow dendrites were found to be excellent materials.32–34
SERS from the probe molecule adsorbed on semiconductor materials is different from the probe molecule adsorbed on the noble metal materials because the CT and resonance mechanism contribute to the semiconductor-based enhancement. Recently, many experiments and theoretical approaches have been carried out to demonstrate the importance of the CM enhancement in SERS-based studies.26 Metal–semiconductor complex represents an important class of multicomponent heterojunction system, which exhibits a combination of properties from the individual components of metal and semiconductor. Moreover, the multicomponent heterojunction system will further enhance property tenability and new synergistic properties from the interactions of the disparate metal and semiconductor components. Note that the CT mechanism is frequently applied to explain the semiconductor-based SERS enhancement, and a few investigations mention EM enhancement. Actually, some semiconductors have the EM contribution because of the resonant energy transfer from metal to semiconductor. The system constructed in this study combined the long-range electromagnetic effect of Ag nanoparticles (NPs), LSPR of Ag@Cu2O nanoshell, and the CT contribution together, with which we obtained a more ideal SERS signal and more evident variation in SERS signal derived from LSPR of the Ag@Cu2O nanoshell.
2. Experiment
2.1. Materials
Silver nitrate (AgNO3), trisodium citrate dihydrate (C6H5Na3O7·2H2O), copper(II) nitrate trihydrate (Cu(NO3)2·3H2O), polyvinylpyrrolidone ((C6H9NO)n, PVP K30), hydrazine hydrate (H4N2·H2O, 85 wt%), and anhydrous ethanol (C2H6O) were purchased from Sinopharm Chemical Reagent Co., Ltd. 4-Mercaptobenzoic acid (4-MBA) was purchased from Sigma-Aldrich Chemical Co., Ltd. All the reagents were used as received without further purification. Deionized water was used throughout the present study.2.2. Synthesis of Ag NPs and Ag@Cu2O core–shell NPs
The Cu2O nanospheres (ESI_Fig. 3†) were obtained with no addition of Ag colloid solution, and other procedures were the same as the synthesis of Ag@Cu2O core–shell NPs.
2.3. Characterization
The morphologies and structures of the NPs were obtained by transmission electron microscopy (TEM) measurements using a Hitachi H-800 transmission electron microscope operated at the accelerating voltage of 200 kV. More detailed morphological and structural information of the NPs was obtained by scanning electron microscopy (SEM) measurements using a JEOL 7800F scanning electron microscope operated at the accelerating voltage of 5 kV. The crystalline structures of the NPs samples were characterized by X-ray diffraction (XRD) using a Rigaku D/Max 3C X-ray diffractometer with Cu-Kα radiation (λ = 1.5418 Å). The elemental composition and chemical state of the NPs were determined by X-ray photoelectron spectroscopy (XPS) using a Thermo Scientific ESACLAB 250Xi A1440 system. The optical properties of the NPs were studied via UV-vis spectroscopy using a Shimadzu 3600 spectrometer.2.4. SERS measurements
For SERS experiments, 4-MBA was used as the probe molecule. 4-MBA solution was prepared with anhydrous ethanol and the concentration was 10−3 M. The Ag@Cu2O core–shell NPs and Ag NPs samples were incubated in the 10−3 M 4-MBA solution for 2 h, then centrifuged and washed with anhydrous ethanol to remove the unadsorbed 4-MBA molecules, and finally drop-cast onto glass slides to obtain the SERS spectra. The SERS spectra of the NPs samples were studied by a Horiba-Jobin-Yvon LabRAM ARAMIS spectrometer with a 633 nm He–Ne exciting laser with an effective power of 3 mW reaching the samples. The laser was focused on the surface of the samples through a 50× long distance objective lens with a 1 μm spot size. Data acquisition was the result of two 30 s accumulations using a holographic grating of 1200 grooves per mm. The Raman band of the silicon wafer at 520.7 cm−1 was used to calibrate the spectrometer.3. Results and discussion
3.1. Preparation and characterization
The preparation of Ag@Cu2O core–shell NPs samples is illustrated as follows. The first step is the synthesis of the Ag core. The second step is the introduction of different volumes of the Ag NPs into the reaction system, which contained a certain amount of Cu2+ and PVP. Therefore, Ag@Cu2O core–shell NPs with fixed core size but varying outer shell dimensions could be obtained. This step involves the assembly of Cu2O nanocrystals, which were formed through the reduction of Cu2+ by hydrazine hydrate, into a solid nanoshell wrapping around the Ag core in the presence of PVP as the structure-directing agent.22,36 This approach provides a unique way to finely control the thickness of the Cu2O shell over a broad size range while well-maintaining the symmetry and an overall spherical morphology of the NPs even in the thick Cu2O shell regime.Fig. 1 shows the TEM images of Ag@Cu2O core–shell NPs samples with four different shell thickness obtained by introducing 2.00, 4.00, 8.00, and 12.00 mL of Ag colloid NPs solution. The average particle sizes were 135, 117, 98, and 79 nm, which correspond to the average Cu2O shell thickness of 50, 40, 31, and 22 nm, respectively (ESI_Table S1†). The resulting samples were denoted as Ag@Cu2O (d nm), where d represents the shell thickness. The shell thickness was inversely related to the addition volume of the Ag colloid NPs solution. For all the obtained samples, each NP only contained one individual Ag NP core, and almost no particles with multiple Ag NPs cores were found. Moreover, as shown in the SEM images (Fig. 2), the as-obtained core–shell NPs exhibited an overall uniform quasi-spherical morphology, preserving well the quasi-spherical shape of the Ag core.
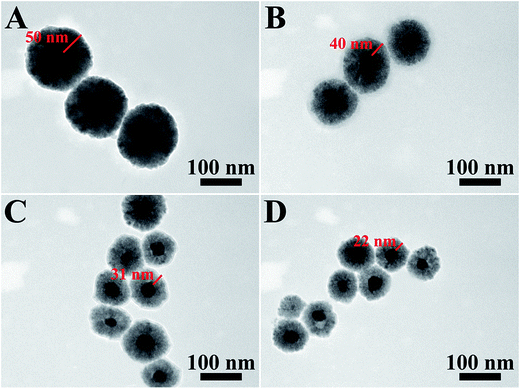 | ||
| Fig. 1 TEM images of the Ag@Cu2O core–shell NPs samples with different Cu2O shell thickness. (A) Ag@Cu2O (50 nm), (B) Ag@Cu2O (40 nm), (C) Ag@Cu2O (31 nm), and (D) Ag@Cu2O (22 nm). | ||
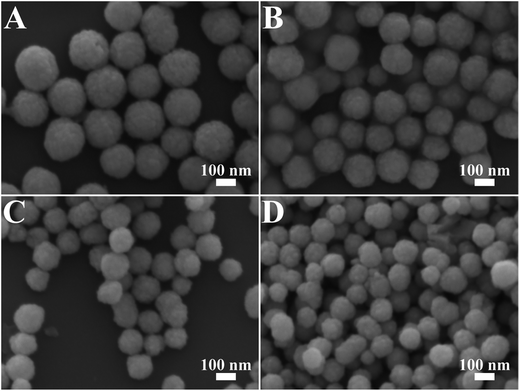 | ||
| Fig. 2 SEM images of the Ag@Cu2O core–shell NPs samples with varying Cu2O shell thickness. (A) Ag@Cu2O (50 nm), (B) Ag@Cu2O (40 nm), (C) Ag@Cu2O (31 nm), and (D) Ag@Cu2O (22 nm). | ||
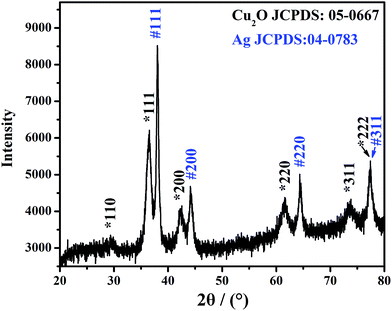
Fig. 3 shows the XRD pattern of the Ag@Cu2O NPs sample. The diffraction peaks located at 2θ = 29.4, 36.5, 42.2, 61.5, 73.7, and 77.4° can be indexed to the {110}, {111}, {200}, {220}, {311}, and {222} lattices, respectively, of the pure cubic-phase Cu2O nanocrystals (JCPDS: 05-0667, space group: Pn![[3 with combining macron]](https://www.rsc.org/images/entities/char_0033_0304.gif) m, a = 0.4270 nm).37,38 The other diffraction peaks located at 2θ = 38.0, 44.1, 64.4, and 77.4° can be indexed to the {111}, {200}, {220}, and {311} planes, respectively, of the face-centered cubic structure of the Ag nanocrystals (JCPDS: 04-0783, space group: Fm3m, a = 0.4086 nm).39 These results indicate that the structure is composed of Cu2O and Ag.
m, a = 0.4270 nm).37,38 The other diffraction peaks located at 2θ = 38.0, 44.1, 64.4, and 77.4° can be indexed to the {111}, {200}, {220}, and {311} planes, respectively, of the face-centered cubic structure of the Ag nanocrystals (JCPDS: 04-0783, space group: Fm3m, a = 0.4086 nm).39 These results indicate that the structure is composed of Cu2O and Ag.
XPS was used to determine the surface components of the shell. The binding energies in the XPS spectra, as presented in Fig. 4, are calibrated by contaminant carbon (C1s = 284.8 eV). The full XPS spectra of Cu2O nanospheres and Ag@Cu2O (31 nm) are shown in Fig. 4A, and the major peaks can be assigned to Cu2p and O1s. The binding energies of Cu2p3/2 and O1s of Cu2O nanospheres are 931.0 and 528.8 eV, respectively, and those of Ag@Cu2O (31 nm) are 931.8 and 529.3 eV, respectively, which are all consistent with the values of Cu2O.40 Fig. 4B shows XPS spectral regions for Cu2p of the Cu2O nanospheres and Ag@Cu2O core–shell NPs samples with varying Cu2O shell thickness. The Cu2p3/2 binding energies of Ag@Cu2O core–shell NPs samples [Ag@Cu2O (50 nm), Ag@Cu2O (40 nm), Ag@Cu2O (31 nm), and Ag@Cu2O (22 nm)] all have slightly positive shifts (from 931.0 to 931.8 eV) compared to those of the Cu2O nanospheres. This suggests that the interfacial surface charge distribution of Ag@Cu2O core–shell NPs has changed and indicates the formation of a charge-transfer complex, which suggests the strongest interaction between the metallic Ag and Cu2O.
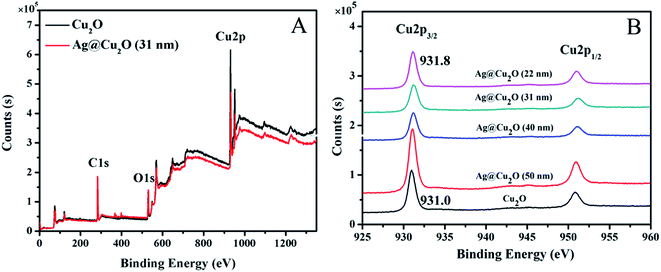 | ||
| Fig. 4 XPS spectra. (A) Survey spectra of Cu2O nanospheres and Ag@Cu2O (31 nm). (B) Cu2p peak regions of Cu2O nanospheres and Ag@Cu2O core–shell NPs samples with various Cu2O shell thickness. | ||
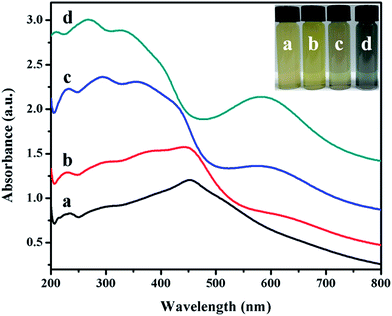
The inset in Fig. 5 is an image of the colloidal solutions of Ag@Cu2O core–shell NPs samples (Fig. 1A–D). The color of the colloidal solutions varied from pale yellow all the way to dark blue as the thickness of the Cu2O shell decreased. The corresponding extinction spectra, as shown in Fig. 5, represent the absorption spectra of Au nanospheres covered with Cu2O material at four different shell thicknesses. Ag@Cu2O nanoshell exhibited much more complicated optical features in comparison to Cu2O nanospheres (ESI_Fig. 3D†) and Ag NPs (ESI_Fig. 1B†). The spectral features on the blue side of 500 nm for all the samples were attributed to the interband transitions in Cu2O and scattering from the Cu2O nanoshells,39 and the peaks red-shifted when the shell thickness increased. The spectral feature on the red side of 500 nm was attributed to the LSPR for all the core–shell NPs samples. Bare Ag NPs exhibited a LSPR at 429 nm (ESI_Fig. 1B†). The local dielectric constant increased with the increasing Cu2O thickness, leading to the red-shift of the peak. On changing the Cu2O thickness, a red-shift of the plasmon peaks was observed, where the plasmon wavelength of silver nanospheres was controlled by altering the coating materials and their thickness. The spectral features of the band at 600 nm shared similarities with the optical characteristics of Cu2O nanoshells in terms of the multi-peaked extinction line-shapes and the red-shift of the peaks when the shell thickness increased. These features primarily originated from geometry-dependent light absorption and scattering from the mesoscopic Cu2O nanoshells.36
3.2. SERS study
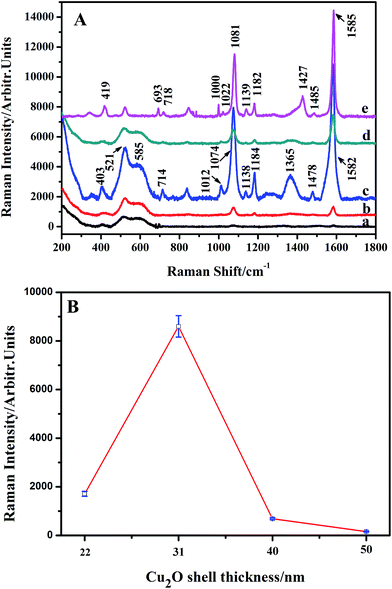
ESI_Fig. 4† shows the SERS spectrum of 4-MBA (10−3 M) adsorbed on Cu2O nanospheres. The spectrum shows three bands at around 401, 534, and 618 cm−1 associated with Cu2O,37,38 and no significantly enhanced Raman bands for 4-MBA are observed, which indicates the absence of the SERS effect on the Cu2O nanospheres. Subsequently, the SERS spectra of 4-MBA (10−3 M) adsorbed on Ag@Cu2O core–shell NPs samples with various Cu2O shell thickness and Ag NPs are compared in Fig. 6A. With Ag@Cu2O core–shell NPs samples, distinct 4-MBA SERS signals at around 403, 714, 1012, 1074, 1138, 1184, 1365, 1478, and 1582 cm−1 are observed,41,42 and the bands at about 403, 521, and 585 cm−1 are Cu2O Raman signals.37,38 The assignments of the SERS bands of the 4-MBA molecule adsorbed on Ag and Ag@Cu2O NPs are shown in Table 1.43 As is shown in Fig. 6A, their SERS bands are significantly different from those of 4-MBA adsorbed on Ag and Ag@Cu2O because of the CT from the substrate to the probe molecule. We found that the SERS intensity decreases with the decreasing Cu2O shell thickness of the Ag@Cu2O NPs and reaches a maximum value of SERS enhancement when the thickness of the Cu2O shell is 31 nm. Further decrease of Cu2O shell thickness of Ag@Cu2O NPs results in the decrease in the SERS intensity. Fig. 6B shows SERS intensities of the Raman peak of 4-MBA (1582 cm−1) versus Cu2O shell thickness (the Cu2O shell thickness are 22, 31, 40, and 50 nm) of Ag@Cu2O NPs. Error bars indicate the standard deviations from four independent measurements.| Wavenumber (cm−1) | Band assignments | |
|---|---|---|
| Ag/4-MBA | Ag@Cu2O/4-MBA | |
| a ν, stretching; γ, bending. For ring vibrations, the corresponding vibrational modes of benzene and the symmetry species under C2v symmetry are indicated. | ||
| — | 403 | ν(C–S) + Cu2O |
| 419 | — | ν(C–S) |
| — | 521 | Cu2O |
| — | 585 | Cu2O |
| 693 | — | C–H out-of-plane deformation |
| 718 | 714 | γ(CCC) out of plane |
| 1000 | — | In-plane ring breathing, b2 |
| — | 1012 | In-plane ring breathing, b2 |
| 1022 | — | In-plane ring breathing, b2 |
| 1081 | 1074 | In-plane ring breathing + ν(C–S), a1 |
| 1182 | 1184 | ν(CH), a1 |
| 1139 | 1138 | ν(CH), b2 |
| 1427 | 1363 | COO− stretching |
| 1485 | 1478 | ν(CC) + γ(CH) |
| 1585 | 1582 | Totally symmetric ν(CC), a1 |
3.3. The possible enhancement mechanism of the proposed system
Semiconductors with poor conductivity for fewer free electrons generally show much weaker resonance effect. Therefore, their SERS effects are much poorer than those of noble metals. More interestingly, the SPR of most semiconductor materials is located in the infrared region.26 Thus, when semiconductor materials are applied as SERS substrates, the CT mechanism can be a dominant contribution to the SERS signal on semiconductor substrate, which provides an extensive space for studying the CT mechanism. Previous studies are focused on the CT enhancement mechanism of the semiconductor-SERS.44,45 Therefore, we first employed the degree of CT (ρCT) to evaluate the contribution of the chemical enhancement. In the present study, the degree of CT (ρCT) was employed for investigation of the CT contribution to the present SERS intensity. As described in a previous article, ρCT(k) of a k-band can be represented as follows:46| ρCT(k) = Ik(CT) − Ik(SPR)/Ik(CT) + I0(SPR) | (1) |
According to the CT mechanism, non-totally symmetric modes such as b2 modes are usually selectively enhanced by the Herzberg–Teller contribution via CT, and a1 modes are not affected by the contribution via CT. In the proposed Ag@Cu2O–4-MBA system, two candidate bands (1184 and 1138 cm−1) were selected for the analysis of the degree of CT (ρCT). One band at 1184 cm−1, which was selected to calculate ρCT, is the C–H stretching a1 mode. The other band is the C–H stretching b2 mode of 4-MBA at 1138 cm−1, which is strongly affected by the charge-transfer (CT) process caused by adsorption and SERS effects.
As is known, the value of ρCT is proportional to the contribution from CM enhancement. In this way, the change of CT process caused by various CM effects can be qualitatively evaluated by the degree of CT (ρCT). As the shell thicknesses of Ag@Cu2O are 50, 40, 31, 22, and 0 nm, their ρCT values are 0.182, 0.195, 0.253, 0.219, and, 0.368, respectively, which are all below 0.5. Therefore, the main contribution of the proposed system is from SPR.
For the contribution from the EM, it is mainly contributed from the Ag@Cu2O nanoshell. The SERS activity of the shell-dependent Ag@Cu2O (Fig. 6) and the pure Cu2O NPs (ESI_Fig. 4†) were evaluated by employing 4-MBA as the probe molecule with 633 nm laser irradiation. As is shown in Fig. 6, the Ag@Cu2O core–shell NPs showed much higher SERS enhancement compared to the pure Cu2O NPs, which can be attributed to the presence of the LSPR of Ag@Cu2O based on the 633 nm laser excitation. Moreover, we found that SERS activity of the Ag@Cu2O NPs was highly dependent on the thickness of the Cu2O shell. Since the increase of the Cu2O shell thickness led to the red-shift of the LSPR, the strength of the plasmonic energy transfer depended on the shell thickness. The SERS activity of the Ag@Cu2O NPs was enhanced with an increase in the shell thickness from 22 to 31 nm. However, on further increasing the shell thickness from 40 to 50 nm, their SERS activity was diminished. Three possible factors compete to define the optimal thickness for SERS. First, since increasing the Cu2O shell thickness leads to a red-shift of the LSPR peak, the strength of the plasmonic energy transfer depends on the shell thickness. Second, although the local EM field was extended into the Cu2O shell for all shell thicknesses, the intensity of the plasmonic enhancement was different. The possible largest plasmonic enhancement was with about 31 nm thick shells and decreased for thinner or thicker shells. Third, change in the shell thickness affects the recombination of the LSPR-induced electron and holes. The thinner Cu2O shell thickness will influence the lifetimes of charge carriers due to an increase in the surface states as compared to bulk states, possibly reducing the SERS efficiency. As the shell thickness increases, the carrier recombination dynamics become closer to that of bulk Cu2O. All these factors contribute to the dependency of SERS enhancement on thickness. The strength of the plasmonic energy transfer and the resulting SERS enhancement are proportional to the strength of the LSPR and the coupling of the near-field EM interaction as well as the carrier lifetime, suggesting why the SERS is optimal for shell thicknesses of around 31 nm, for which, the EF could be estimated to be 3.21 × 10⁵, (see ESI†). The most critical aspect in performing a SERS experiment is the choice of an ideal substrate. Herein, Ag@Cu2O NPs with the perfect shell thickness of 31 nm, which provided higher SERS enhancement, were employed to quantitation determination of 4-MBA. Fig. 7 shows SERS spectra of 4-MBA at different concentrations (from 10−3 to 10−7 M) adsorbed on Ag@Cu2O NPs with the shell thickness of 31 nm. Even at 10−7 M, the SERS spectrum of 4-MBA shows two obvious peaks at 1582 and 1074 cm−1.
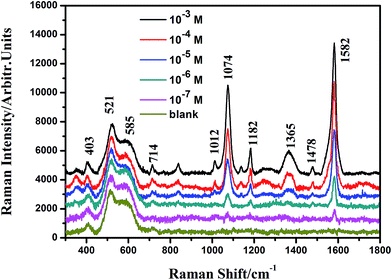 | ||
| Fig. 7 Concentration-dependent (10−3, 10−4, 10−5, 10−6, 10−7 M, and blank sample) SERS spectra of 4-MBA adsorbed on the Ag@Cu2O core–shell NPs samples with the Cu2O shell thickness of 31 nm. | ||
4. Conclusions
In summary, the proposed method offers a colloidal chemistry approach to improving SERS for 4-MBA adsorbed on particles, which is independent of the shell thickness. The LSPR band of Ag@Cu2O core–shell NPs shows a red-shift with an increase in the Cu2O shell thickness. For variation of the shell, these exhibited different plasmonic energy transfer and the recombination of the LSPR-induced electron and holes, suggesting an optimal SERS for a shell thicknesses of around 31 nm. The plasmonic energy transfer mechanisms introduced in the proposed research can be extended to other metal–semiconductor complex systems, outlining the design strategies for plasmonic enhancement of SERS.Acknowledgements
This work was supported by the National Natural Science Foundation of China (No. 61575080, 61675090 and 21676115), National Youth Program Foundation of China (No. 21546013, 61405072 and 51609100), Program for the development of Science and Technology of Jilin province (No. 20150519024JH, 20150520015JH, 20160101287JC and 20140519003JH), and Technology of Education Department of Jilin Province (No. 2016-217).References
- M. Fleischmann, P. J. Hendra and A. J. McQuillan, Raman spectra of pyridine adsorbed at silver electrode, Chem. Phys. Lett., 1974, 26, 163–166 CrossRef CAS.
- K. Kneipp, M. Moskovits and H. Kneipp, Surface-Enhanced Raman Scattering-Physics and Applications, Springer, Berlin, Heidelberg, 2006 Search PubMed.
- E. C. Le Ru, P. G. Etchegoin and M. Meryer, Enhancement factor distribution around a single surface-enhanced Raman scattering hot spot and its relation to single molecule detection, J. Chem. Phys., 2006, 125, 204701 CrossRef CAS PubMed.
- A. Michota and J. Bukowska, Surface-enhanced Raman scattering (SERS) of 4-mercaptobenzoic acid on silver and gold substrates, J. Raman Spectrosc., 2003, 34, 21–25 CrossRef CAS.
- Z. Q. Tian and B. Ren, Adsorption and reaction at electrochemical interfaces as probed by surface-enhanced Raman spectroscopy, Annu. Rev. Phys. Chem., 2004, 55, 197–229 CrossRef CAS PubMed.
- K. Kneipp, M. Moskovits and H. Kneipp, Surface-Enhanced Raman Scattering-Physics and Applications, Springer, Berlin, Heidelberg, 2006 Search PubMed.
- W. E. Smith, Practical understanding and use of surface enhanced Raman scattering/surface enhanced resonance Raman scattering in chemical and biological analysis, Chem. Soc. Rev., 2008, 37, 955–964 RSC.
- D. Graham and R. Goodacre, Chemical and bioanalytical applications of surface enhanced Raman scattering spectroscopy, Chem. Soc. Rev., 2008, 37, 883–884 RSC.
- M. Moskovits, Surface-enhanced spectroscopy, Rev. Mod. Phys., 1985, 57, 783–826 CrossRef CAS.
- H. Metiu, Surface enhanced spectroscopy, Prog. Surf. Sci., 1984, 17, 153–320 CrossRef CAS.
- J. R. Lombardi and R. L. Birke, A unified approach to surface-enhanced Raman spectroscopy, J. Phys. Chem. C, 2008, 112, 5605–5617 CAS.
- E. J. Zeman and G. C. Schatz, An accurate electromagnetic theory study of surface enhancement factors for silver, gold, copper, lithium, sodium, aluminum, gallium, indium, zinc, and cadmium, J. Phys. Chem., 1987, 91, 634–643 CrossRef CAS.
- L. Yang, Y. Zhang, W. Ruan, B. Zhao, W. Xu and J. R. Lombardi, Improved surface-enhanced Raman scattering properties of TiO2 nanoparticles by Zn dopant, J. Raman Spectrosc., 2009, 41, 721–726 Search PubMed.
- W. Ji, X. Xue, W. Ruan, C. Wang, N. Ji, L. Chen, Z. Li, W. Song, B. Zhao and J. R. Lombardi, Scanned chemical enhancement of surface-enhanced Raman scattering using a charge-transfer complex, Chem. Commun., 2011, 47, 2426–2428 RSC.
- A. Musumeci, D. Gosztola, T. Schiller, N. M. Dimitrijevic, V. Mujica, D. Martin and T. Rajh, SERS of semiconducting nanoparticles (TiO2 hybrid composites), J. Am. Chem. Soc., 2009, 131, 6040–6041 CrossRef CAS PubMed.
- N. Wiriyakun, K. Pankhlueab, S. Boonrungsiman and R. Laocharoensuk, Site-selective controlled dealloying process of gold–silver nanowire array: a simple approach towards long-term stability and sensitivity improvement of SERS substrate, Sci. Rep., 2016, 6, 39115 CrossRef CAS PubMed.
- R. Liu, Z. He, J. Sun, J. Liu and G. Jiang, Tracking the fate of surface plasmon resonance-generated hot electrons by in situ SERS surveying of catalyzed reaction, Small, 2016, 12, 6378–6387 CrossRef CAS PubMed.
- J. M. Nam, J. W. Oh and H. Lee, Acc. Chem. Res., 2016, 49, 2746–2755 CrossRef CAS PubMed.
- K. Li, Y. Wang, K. Jiang, Y. Ren, Y. Dai, Y. Lu and P. Wang, Plasmonic nanogap-enhanced Raman scattering with nanoparticles, Nanotechnology, 2016, 27, 495402 CrossRef PubMed.
- P. Kuhler, E. M. Roller, R. Schreiber, T. Liedl, T. Lohmuller and J. Feldmann, Plasmonic DNA-origami nanoantennas for surface-enhanced Raman spectroscopy, Nano Lett., 2014, 14, 2914–2919 CrossRef PubMed.
- V. V. Thacker, L. O. Herrmann, D. O. Sigle, T. Zhang, T. Liedl, J. J. Baumberg and U. F. Keyser, DNA origami based assembly of gold nanoparticle dimers for surface-enhanced Raman scattering, Nat. Commun., 2014, 5, 3448 Search PubMed.
- L. Zhang, D. A. Blom and H. Wang, Au–Cu2O core–shell nanoparticles: a hybrid metal–semiconductor heteronanostructure with geometrically tunable optical properties, Chem. Mater., 2011, 23, 4587–4598 CrossRef CAS.
- H. Liu, W. Yang, M. Wang, L. Xiao and S. Liu, Fabrication of lotus-like Au@TiO2 nanocomposites with enhanced gas-sensing properties, Sens. Actuators, B, 2016, 236, 490–498 CrossRef CAS.
- S. Sun, Recent advances in hybrid Cu2O-based heterogeneous nanostructures, Nanoscale, 2015, 7, 10850–10882 RSC.
- N. Gao, Y. Chen and J. Jiang, Ag@Fe2O3–GO nanocomposites prepared by a phase transfer method with long-term antibacterial property, ACS Appl. Mater. Interfaces, 2013, 5, 11307–11314 CAS.
- W. Ji, B. Zhao and Y. Ozaki, Semiconductor materials in analytical applications of surface-enhanced Raman scattering, J. Raman Spectrosc., 2016, 47, 51–58 CrossRef CAS.
- L. Yang, X. Jiang, W. Ruan, B. Zhao, W. Xu and J. R. Lombardi, Observation of enhanced Raman scattering for molecules adsorbed on TiO2 nanoparticles: charge-transfer contribution, J. Phys. Chem. C, 2008, 112, 20095–20098 CAS.
- M. G. Blaber, M. D. Arnold and M. J. Ford, Search for the ideal plasmonic nanoshell: the effects of surface scattering and alternatives to gold and silver, J. Phys. Chem. C, 2009, 113, 3041–3045 CAS.
- B. D. Yuhas and P. Yang, Nanowire-based all-oxide solar cells, J. Am. Chem. Soc., 2009, 131, 3756–3761 CrossRef CAS PubMed.
- A. Kudelski, W. Grochala, M. Janik-Czachor, J. Bukowska, A. Szummer and M. Dolata, Surface-enhanced Raman scattering at (SERS) oxide copper(I), J. Raman Spectrosc., 1998, 29, 431–435 CrossRef CAS.
- Y. X. Wang, W. Song, J. X. Yang, W. Q. Xu and B. Zhao, Surface enhanced Raman scattering on Cu2O/Ag composite, Chem. J. Chin. Univ., 2011, 32, 1789–1793 CAS.
- R. C. Wang and C. H. Li, Cu, Cu–Cu2O core–shell, and hollow Cu2O nanodendrites: structural evolution and reverse surface-enhanced Raman scattering, Acta Mater., 2011, 59, 822–829 CrossRef CAS.
- R. Ji, W. Sun and Y. Chu, One-step hydrothermal synthesis of Ag/Cu2O heterogeneous nanostructures over Cu foil and their SERS applications, RSC Adv., 2014, 4, 6055–6059 RSC.
- J. Li, S. K. Cushing, J. Bright, F. Meng, T. R. Senty, P. Zheng, A. D. Bristow and N. Wu, Ag@Cu2O core–shell nanoparticles as visible-light plasmonic photocatalysts, ACS Catal., 2013, 3, 47–51 CrossRef CAS.
- P. C. Lee and D. Meisel, Adsorption and surface-enhanced Raman of dyes on silver and gold sols, J. Phys. Chem., 1982, 86, 3391–3395 CrossRef CAS.
- L. Zhang and H. Wang, Cuprous oxide nanoshells with geometrically tunable optical properties, ACS Nano, 2011, 5, 3257–3267 CrossRef CAS PubMed.
- L. Chen, Y. Zhao, Y. Zhang, M. Liu, Y. Wang, X. Qu, Y. Liu, J. Li, X. Liu and J. Yang, Design of Cu2O–Au composite microstructures for surface-enhanced Raman scattering study, Colloids Surf., A, 2016, 507, 96–102 CrossRef CAS.
- L. Yang, J. Lv, Y. Sui, W. Fu, X. Zhou, J. Ma, S. Su, W. Zhang, P. Lv, D. Wu, Y. Mu and H. Yang, Fabrication of Cu2O/Ag composite nanoframes as surface-enhanced Raman scattering substrates in a successive one-pot procedure, CrystEngComm, 2014, 16, 2298–2304 RSC.
- C. D. Wagner, W. M. Riggs, L. E. Davis and J. F. Mouler, Handbook of X-Ray Photoelectron Spectroscopy, ed. G. E. Muilenberg, Perkin Elmer Corporation, Physical Electronics Division, Eden Prairie, MN, 1979 Search PubMed.
- M. Mahmoud, W. Qian and M. El-Sayed, Following charge separation on the nanoscale in Cu2O–Au nanoframe hollow nanoparticles, Nano Lett., 2011, 11, 3285–3289 CrossRef CAS PubMed.
- Y. Wang, W. Ji, H. Sui, Y. Kitahama, W. Ruan, Y. Ozaki and B. Zhao, Exploring the Effect of Intermolecular H-Bonding: A Study on Charge-Transfer Contribution to Surface-Enhanced Raman Scattering of p-Mercaptobenzoic Acid, J. Phys. Chem. C, 2014, 118, 10191–10197 CAS.
- S. Zhu, C. Fan, J. Wang, J. He, E. Liang and M. Chao, Realization of high sensitive SERS substrates with one-pot fabrication of Ag–Fe3O4 nanocomposites, J. Colloid Interface Sci., 2015, 438, 116–121 CrossRef CAS PubMed.
- X. Xue, W. Ji, Z. Mao, H. Mao, Y. Wang, X. Wang, W. Ruan, B. Zhao and J. R. Lombardi, Raman investigation of nanosized TiO2: effect of crystallite size and quantum confinement, J. Phys. Chem. C, 2012, 116, 8792–8797 CAS.
- W. Ji, Y. Kitahama, X. Xue, B. Zhao and Y. Ozaki, Generation of pronounced resonance profile of charge-transfer contributions to surface-enhanced Raman scattering, J. Phys. Chem. C, 2012, 116, 2515–2520 CAS.
- L. Jiang, T. You, P. Yin, Y. Shang, D. Zhang, L. Guo and S. Yang, Surface-enhanced Raman scattering spectra of adsorbates on Cu2O nanospheres: charge-transfer and electromagnetic enhancement, Nanoscale, 2013, 5, 2784–2789 RSC.
- J. R. Lombardi and R. L. Birke, A unified view of surface-enhanced Raman scattering, Acc. Chem. Res., 2009, 42, 734–742 CrossRef CAS PubMed.
Footnote |
| † Electronic supplementary information (ESI) available. See DOI: 10.1039/c7ra01187c |
| This journal is © The Royal Society of Chemistry 2017 |

