
 Open Access Article
 This Open Access Article is licensed under a
 Creative Commons Attribution 3.0 Unported Licence
The chain order of binary unsaturated lipid bilayers modulated by aromatic-residue-containing peptides: an ATR-FTIR spectroscopy study†
Bo Peng ,
Xiao-Yan Ding,
Chao Sun,
Ya-Nan Yang,
Yu-Jiao Gao and
Xin Zhao*
,
Xiao-Yan Ding,
Chao Sun,
Ya-Nan Yang,
Yu-Jiao Gao and
Xin Zhao*
Shanghai Key Laboratory of Magnetic Resonance, Department of Physics, School of Physics and Materials Science, East China Normal University, Shanghai 200062, P. R. China. E-mail: xzhao@phy.ecnu.edu.cn; Fax: +86 21 62234329; Tel: +86 21 62234329
First published on 6th June 2017
Abstract
In this study, we described the chain order change of binary unsaturated lipid bilayers by studying pure 2-oleoyl-1-pamlitoyl-sn-glyecro-3-phosphocholine (POPC) bilayers, 2-oleoyl-1-pamlitoyl-sn-glyecro-3-glycerol (POPG) bilayers, and POPC/POPG bilayers. The interactions between the POPC/POPG membrane and three model peptides containing basic, aromatic, and hydrophobic residues were studied to investigate the effects of the peptide orientation on the acyl chain order of the POPC/POPG bilayers. Attenuated total reflectance-Fourier transform infrared (ATR-FTIR) spectroscopic studies showed that the acyl chain order of the POPC/POPG bilayers decreased as compared to that of the pure POPC or POPG bilayers. The chain order of the POPC/POPG bilayers significantly decreased when Gravin was added as compared to that when Vamp2 or Antp was added. Fluorescence spectroscopic measurements further show that the tryptophan of the three peptides may interact with the hydrophobic region of the POPC/POPG bilayers, thus resulting in a change in the conformational order of the POPC/POPG acyl chains. This study may provide valuable insight into the dynamics and flexibility of lipid bilayers with different lipids and highlights the importance of aromatic residues in peptide binding to the membrane.
1. Introduction
Biological membranes display a complex variety of different lipids. Variations in the lipid composition1 and the size of lipid bilayer aggregates2 are well-known to significantly affect membrane properties, especially the lipid composition. Different lipid compositions make the physicochemical properties and physical behavior, including the permeability,3 melting transition behavior,4 fluidity, curvature, thickness, and charge distribution,5 of the membranes complex. In addition, the lipid composition is also involved in the insertion and stabilization of amino acids in the membranes6 and the structure and function of the membrane proteins.7The lipid composition is distinguished by different head groups, acyl chain lengths, and acyl chain unsaturation. The most common phosphatidylcholine (PC) molecules are present in all mammalian cell membranes except for those in the brain.8 Phosphatidylglycerol (PG) is the only major phospholipid in the thylakoid membrane of plant chloroplasts and cyanobacteria.9 Both POPG and POPC contain an unsaturated (C18) and a saturated (C16) fatty acid as the lipophilic tails. While the hydrophilic head group of POPC is zwitterionic, the head group attached to the diacylglycerol backbone in POPG is negatively charged.
Many peripheral proteins, such as myristoylated alanine-rich C kinase substrate (MARCKS),10 FAT C-terminal (FATC) domain,11 and LL37,12 contain clusters of basic and aromatic residues that interact with lipid bilayers. Generally, aromatic and basic residue motifs are important for the anchoring of proteins to the biomembranes,13 particularly aromatic residues, which may play key roles as efficient anchors during binding at the phospholipid membrane interface.14,15 The interactions between aromatic residue-containing peptides and membrane bilayers with different lipid compositions are complex. Using neutron reflectivity (NR), electron spin resonance (ESR), fluorescence titration, and molecular dynamics (MD) simulations, Vitiello et al. showed that the lipid composition modulated the interaction of the three tryptophan-containing octapeptides (C8) with membrane bilayers and the C8 may interact with the cholesterol-interacting sphingomyelin and induce a significant reduction of the POPC acyl chain order.16 Sanders et al. reported that the tryptophan-rich wild type (Pin-b) and mutant (Trp44 to Arg44 mutant, Pin-bs) puroindoline proteins interacted with mixed phosphatidylethanolamine (PE) and PG with different lipid selectivity. Moreover, using FTIR spectroscopy, surface pressure measurements, and Brewster angle microscopy, it was found that Pin-b could insert into the head groups of the mixed PE and PG more deeply than Pin-bs.17 Using dual polarisation interferometry (DPI), Hirst et al. demonstrated that the HPA3 peptide, which contains basic and aromatic residues, may bind to different lipid bilayers and induce unsaturated bilayers to be more disordered than saturated bilayers.18 It has been reported that the interactions between C6-LfB6 peptide, which contains basic and aromatic residues, and POPE/POPG or POPC bilayers depend on the lipid composition. C6-LfB6 may bind to the negatively charged POPE/POPG bilayer interface and cause no change in the lipid acyl chain order, whereas for zwitterionic POPC bilayers, it can more deeply insert into the POPC membrane and induce a slight decrease in the order of the lipid acyl chains, as observed via solid-state 2H and 31P nuclear magnetic resonance (NMR) and all-atom MD simulations.19 In addition, the arginine-rich RL9 and tryptophan-containing RW9 peptides may locate at the interface of POPC, POPG, and POPC/POPG membranes and water, where RW9 has a larger influence in increasing membrane flexibility than RL9 based on isothermal titration calorimetry (ITC), solid-state NMR, and MD simulations.20 However, the perturbation of aromatic residue-containing peptides interacting with binary unsaturated lipid bilayers remains unclear, and studies to better understand this possible effect associated with the lipid composition are of particular importance.
Fourier transform infrared (FTIR) spectroscopy, a common non-invasive biophysical approach, has been broadly used to selectively monitor the perturbations on the polar head groups, the interfacial region, and the hydrophobic acyl chains of lipids.21,22 It provides valuable information about biomembranes: the phase transition and order–disorder state of lipid membranes,23 the asymmetry and assemblies of bilayers,24 the structural changes in membranes induced via interactions with small molecules,25,26 or antimicrobial cationic lipopeptides,27 etc. Changes in the width and position of the lipid IR peaks can provide useful information regarding lipid membrane dynamics28 and interactions of lipids with proteins.29 In the current study, we aimed at investigating the chain order of binary unsaturated lipid mixtures and the perturbation of binary unsaturated lipids with aromatic residue-containing peptide binding. We used polarised ATR-FTIR spectroscopy to investigate the acyl chain order of the mixed POPC/POPG bilayers and the perturbation of the chain order in the POPC/POPG membrane bilayers modulated by three specially designed model peptides. In addition, the possible role of the Trp residues in the process of peptide interaction with POPC/POPG bilayers was qualitatively analysed via fluorescence spectroscopy.
2. Methodology
2.1. Materials
POPC and POPG were obtained as powders from Avanti Polar Lipids without further purification. D2O (99.9%) was obtained from Cambridge Isotope Laboratory. Trp-OMe, Vamp2 (83–95) KLKRKYWWKNLKM, Antp (43–58) RQILIWFQNRRMKWKK, and Gravin (297–317) KKFFTQGWAGWRKKTSFRKPK were purchased from Ji'er Biochemical (Shanghai) Co. Ltd. The molecular formulae of POPC and POPG and the sequences of model peptides are shown in Fig. 1.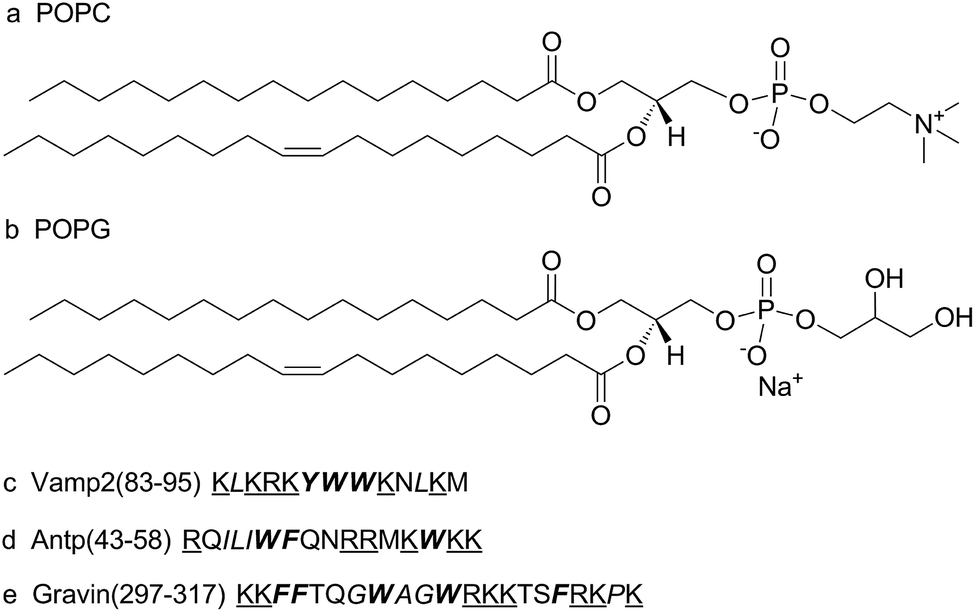 | ||
| Fig. 1 Molecular formulae of a zwitterionic lipid (a) POPC (2-oleoyl-1-pamlitoyl-sn-glyecro-3-phosphocholine), an anionic lipid (b) POPG (2-oleoyl-1-pamlitoyl-sn-glyecro-3-glycerol) (sodium salt), sequences of (c) Vamp2 (83–95), (d) Antp (43–58), and (e) Gravin (297–317). Basic residues (lysine and arginine) have been underlined. Aromatic residues (phenylalanine, tryptophan, and tyrosine) are presented in bold. Hydrophobic residues (leucine, isoleucine, glycine, alanine, proline, phenylalanine, tryptophan, and tyrosine) are presented in italics. | ||
2.2. Preparation of the multilamellar vesicles (MLVs)
Lipids were dissolved in a mixture of chloroform and methanol (2![[thin space (1/6-em)]](https://www.rsc.org/images/entities/char_2009.gif) :1), and then, the solvent was evaporated under a stream of nitrogen gas and lyophilised for several hours. Lipids were then dissolved in cyclohexane, evaporated under a flow of nitrogen gas, and then desiccated under vacuum to remove any residual solvent. Dried films were hydrated with 20 mM 4-(2-hydroxyethyl)-1-piperazineethanesulphonic acid (HEPES) and 30 mM sodium chloride (NaCl) buffer (pH 7.0), subjected to 10 cycles of freeze–thaw–sonication, and then kept under vacuum for several hours. Dried lipid films were hydrated with D2O to 50% water by mass. Then, the lipid samples were incubated at 37 °C for 2 days. The POPC/POPG molar ratio was 10:3. The model peptides were added to the POPC/POPG MLVs prior to lyophilisation at a molar ratio of 1:50. The molar concentration of the peptides was about 2%.
:1), and then, the solvent was evaporated under a stream of nitrogen gas and lyophilised for several hours. Lipids were then dissolved in cyclohexane, evaporated under a flow of nitrogen gas, and then desiccated under vacuum to remove any residual solvent. Dried films were hydrated with 20 mM 4-(2-hydroxyethyl)-1-piperazineethanesulphonic acid (HEPES) and 30 mM sodium chloride (NaCl) buffer (pH 7.0), subjected to 10 cycles of freeze–thaw–sonication, and then kept under vacuum for several hours. Dried lipid films were hydrated with D2O to 50% water by mass. Then, the lipid samples were incubated at 37 °C for 2 days. The POPC/POPG molar ratio was 10:3. The model peptides were added to the POPC/POPG MLVs prior to lyophilisation at a molar ratio of 1:50. The molar concentration of the peptides was about 2%.
2.3. ATR-FTIR spectroscopy
The ATR-FTIR experiments were performed via a Nicolet 8700 USB IR spectrometer equipped with a deuterated triglycine sulphate (DTGS) detector. A standard PIKE Technologies ATRMax device equipped with a ZnSe grating polariser that can be oriented parallel or perpendicular to the ATR plane was used. The internal reflection element was a 56 mm × 10 mm × 4 mm ZnSe plate with an aperture angle of 45° yielding 7 internal reflections. A schematic of the ATR device with an internal ZnSe reflection plate covered with the POPC bilayers, POPC/POPG bilayers, and POPC/POPG bilayer–peptide complexes is shown in Fig. 2. Spectra were obtained with 4 cm−1 resolution between 650 and 4000 cm−1 region at 298 K, and 128 scans were obtained for each spectrum. The dichroic ratio (RATR) values are the average values obtained from three measurements. The orientation order parameter f and the average angle of the lipid chains relative to the membrane normal γ were calculated following a previous method.30,31 The tilt angle β of the α-helical component from the membrane normal was calculated via a previous method.32–35 Detailed information about the polarised ATR-FTIR data analysis is shown in the ESI.† All the experiments were analysed via an OMNIC 8.1 software (Thermo Fisher Scientific Inc.). Second derivative spectra were obtained via a 5-point Norris derivative method. | ||
| Fig. 2 A schematic of the ATR device with an internal ZnSe reflection plate covered with the POPC bilayers, POPC/POPG bilayers, and POPC/POPG bilayer–peptide complexes (yellow: POPC and blue: POPG). | ||
2.4. Fluorescence spectroscopy
Fluorescence emission spectra were obtained via a Horiba Jobin-Yvon Fluoromax-4 spectrofluorometer. The bandwidth for emission was 4 nm, and an excitation wavelength of 295 nm was used to ensure that light was almost entirely absorbed by the tryptophanyl groups.36 All spectra were obtained at room temperature.3. Results and discussion
3.1. FTIR spectra of the POPC bilayers, POPG bilayers, and POPC/POPG bilayers
Fig. 3A and C show the FTIR spectra of the POPC bilayers, POPG bilayers, and POPC/POPG bilayers in the 3050–2800 cm−1 and 1800–1000 cm−1 regions, respectively. The important vibrational peaks could be clearly assigned.37 For the POPC bilayers, the band of the![[double bond, length as m-dash]](https://www.rsc.org/images/entities/char_e001.gif) CH stretching mode at 3010.2 cm−1 and the CC stretching mode at 1651.4 cm−1 can be taken into consideration. The CH2 antisymmetric stretching band at 2919.3 cm−1 and CH2 symmetric stretching band at 2850.3 cm−1 were also unambiguously identified. In addition, the PO2− antisymmetric stretching band at 1240.5 cm−1, the PO2− symmetric stretching band at 1091.3 cm−1, and the C–N+–C symmetric stretching band at 919.4 cm−1 were also taken into consideration. For the POPG bilayers, the band of the CH stretching mode at 3010.0 cm−1, the CC stretching mode at 1651.8 cm−1, the CH2 antisymmetric stretching band at 2920.6 cm−1, and the CH2 symmetric stretching band at 2850.7 cm−1 can be clearly assigned. These bands are similar to those for the POPC bilayers. While the PO2− antisymmetric stretching band at 1220.0 cm−1 and the PO2− symmetric stretching band at 1094.6 cm−1 were also taken into consideration, these bands were different from those for the POPC bilayers.
CH stretching mode at 3010.2 cm−1 and the CC stretching mode at 1651.4 cm−1 can be taken into consideration. The CH2 antisymmetric stretching band at 2919.3 cm−1 and CH2 symmetric stretching band at 2850.3 cm−1 were also unambiguously identified. In addition, the PO2− antisymmetric stretching band at 1240.5 cm−1, the PO2− symmetric stretching band at 1091.3 cm−1, and the C–N+–C symmetric stretching band at 919.4 cm−1 were also taken into consideration. For the POPG bilayers, the band of the CH stretching mode at 3010.0 cm−1, the CC stretching mode at 1651.8 cm−1, the CH2 antisymmetric stretching band at 2920.6 cm−1, and the CH2 symmetric stretching band at 2850.7 cm−1 can be clearly assigned. These bands are similar to those for the POPC bilayers. While the PO2− antisymmetric stretching band at 1220.0 cm−1 and the PO2− symmetric stretching band at 1094.6 cm−1 were also taken into consideration, these bands were different from those for the POPC bilayers.
 | ||
| Fig. 3 FTIR spectra of (a) POPC bilayers, (b) POPG bilayers, and (c) POPC/POPG bilayers. (A) FTIR spectra in the 3050–2800 cm−1 region. (B) Second-derivative spectra in the 3050–2800 cm−1 region. (C) FTIR spectra in the 1800–1000 cm−1 region. (D) Second-derivative spectra in the 1800–1000 cm−1 region. | ||
For the POPC/POPG bilayers, the vibrational frequencies of the CH and CC stretching modes showed red shifts. The second-derivative FTIR spectra of the POPC, POPG, and POPC/POPG bilayers in the 3050–2800 cm−1 and 1800–1000 cm−1 regions are presented in Fig. 3B and D, respectively. The band of the CH stretching mode locates at 3008.1 cm−1 and the CC stretching mode locates at 1646.8 cm−1 in the POPC/POPG bilayers. Compared to the POPC bilayers, the CH and CC stretching modes show red shifts of 2.1 cm−1 and 4.6 cm−1, respectively, in the mixed POPC/POPG bilayers. Moreover, the vibrational frequencies of the CH2 antisymmetric and symmetric stretching modes show blue shifts of 2.5 cm−1 and 1.6 cm−1, respectively. Moreover, the frequency, width, and intensity of the antisymmetric and symmetric CH2 and CH3 stretching bands can be used to monitor the order state of the membranes.38 These results demonstrate that the order of the acyl chains decreases in the POPC/POPG bilayers as compared to that in the pure POPC bilayers. In addition, the PO2− antisymmetric stretching band at 1233.6 cm−1 shows a red shift of 6.9 cm−1 and the C–N+–C antisymmetric stretching band at 922.4 cm−1 shows a small blue shift of 3 cm−1 for the POPC/POPG bilayers as compared to those for the POPC bilayers. These bands are mainly associated with the head groups of lipids. The lipid headgroup packing depends on the structure of the headgroup as well as on the fatty acyl chain structure.5 Our FTIR results demonstrate that the acyl chain order in the case of a binary lipid system composed of POPC and POPG decreases to some extent although based on MD simulations, Janosi et al. have reported that the POPC bilayers containing ∼23% POPG differ from their neutral counterparts only at the headgroup.39 This discrepancy may be caused by the differences in the chosen force field for the MD simulations. The head group of POPC is zwitterionic, whereas the head group of POPG is negatively charged. With the different head groups in the POPC/POPG bilayers, the packing and arrangements in the polar head group and interfacial regions of the lipid matrix are different from those of the pure POPC or POPG bilayers. Thus, we can speculate that the acyl chain order of the POPC/POPG bilayers decreases to some extent as compared to that of the POPC or POPG bilayers.
3.2. FTIR spectra of the POPC/POPG bilayers and POPC/POPG bilayer–model peptide complexes
We used several model peptides to further investigate the chain order of the mixed POPC/POPG bilayers. Initial spectra of the POPC/POPG bilayers were obtained as references. Fig. 4A shows the FTIR spectra of the POPC/POPG bilayers and POPC/POPG bilayer–model peptide complexes in the 3050–2800 cm−1 region. The important vibrational peaks could also be clearly assigned.37 In the second-derivative FTIR spectra in the 3050–2800 cm−1 region of the POPC/POPG bilayers and complexes of model peptides with the POPC/POPG bilayers (Fig. 4B), a red shift of 1.2 cm−1 for theCH stretching band of the POPC/POPG bilayers was observed when Gravin was added. However, there were negligible changes in the frequency of the C–H stretching band when Antp (a red shift of about 1.1 cm−1) and Vamp2 (about 0.6 cm−1) were added. The CO stretching mode of ester carbonyl at 1736.4 cm−1 was mainly associated with the POPC/POPG bilayers. Fig. 4C shows that the shoulder peaks near the ν(CO) band became widest when Gravin was added. In addition, shoulder peaks near the ν(CO) were observed when Antp and Vamp2 were added. These peaks are associated with the amide I band and amino acid side chains in this region when model peptides are mixed into binary lipid bilayers. The second-derivative spectra in the 1800–1000 cm−1 region (Fig. 4D) show that main shoulder peaks appeared at 1679.5 cm−1, 1655.6 cm−1, and 1624.5 cm−1 for the Antp–POPC/POPG bilayer complex. These may be associated with the γ-turn, the anti-parallel β-sheet, the α-helix, or the aggregated β-sheet.40 For the Vamp2–POPC/POPG bilayer complex, main shoulder peaks appeared at 1678.8 cm−1 and 1645.7 cm−1. These may be associated with the anti-parallel β-sheet, the γ-turn, or the α-helix.40 They also appeared at 1678.1 cm−1 and 1642.7 cm−1 in the Gravin–POPC/POPG bilayer complex and these may be associated with the anti-parallel β-sheet, the γ-turn, or the α-helix.40 As the FTIR absorption bands of this region are complex, variations in the frequency of the CC stretching band of the POPC/POPG acyl chains have not yet been distinguished and analysed. Additionally, the shape of the PO2− antisymmetric stretching band shows variation to some extent when the three peptides are mixed into the POPC/POPG bilayers. These phenomena are mainly due to the interactions between the PO2− groups of the POPC/POPG bilayers and the peptides.
 | ||
| Fig. 4 FTIR spectra of the POPC/POPG bilayers and POPC/POPG bilayer–peptide complexes. (A) FTIR spectra in the 3050–2800 cm−1 region. (B) Second-derivative spectra in the 3050–2800 cm−1 region. (C) FTIR spectra in the 1800–1000 cm−1 region. (D) Second-derivative spectra in the 1800–1000 cm−1 region. (a) POPC/POPG bilayers, (b) Vamp2 peptide with POPC/POPG bilayers, (c) Antp peptide with POPC/POPG bilayers, and (d) Gravin peptide with POPC/POPG bilayers. | ||
Using ATR-FTIR spectroscopy, information on the secondary structures and orientations of peptides can be readily obtained.41–43 Table 1 shows the parameters for s- and p-polarized ATR-FTIR spectra of the POPC/POPG bilayer–peptide complexes. According to the strength ratio of the s- and p-polarized spectra, the tilt angle of the α-helical component from the membrane normal was calculated to be 69.0° in the Vamp2–POPC/POPG bilayer complex; it was calculated to be 53.6° in the Antp–POPC/POPG bilayer complex; and it was determined to be 42.4° in the Gravin–POPC/POPG bilayer complex.
| Sample | Freq. (cm−1) | Assignment | A (s-polarized) | A (p-polarized) |
|---|---|---|---|---|
| POPC/POPG and Vamp2 | 1678.8 | γ-turn, anti-parallel β-sheet | 0.138 | 0.209 |
| 1645.7 | α-helix | 0.128 | 0.207 | |
| POPC/POPG and Antp | 1679.5 | γ-turn, anti-parallel β-sheet | 0.091 | 0.170 |
| 1655.6 | α-helix | 0.075 | 0.153 | |
| 1624.5 | aggregated β-sheet | 0.075 | 0.135 | |
| POPC/POPG and Gravin | 1678.1 | γ-turn, anti-parallel β-sheet | 0.138 | 0.294 |
| 1642.7 | α-helix | 0.102 | 0.256 |
As shown in Fig. 1, the three model peptides have different amino acid sequence motifs. All three peptides have various basic, aromatic, and hydrophobic residues in the sequence. Vamp2 (83–95) is a 13-residue peptide that contains three aromatic residues (2-Trp and 1-Tyr), six basic residues (5-Lys and 1-Arg), and two hydrophobic residues (2-Leu). Gravin (297–317) is a 21-residue peptide that contains five aromatic residues (3-Phe and 2-Trp), eight basic residues (6-Lys and 2-Arg), and four hydrophobic residues (2-Gly, 1-Ala, and 1-Pro). Antp (43–58) is a 16-residue peptide that contains three aromatic residues (2-Trp and 1-Phe), six basic residues (3-Lys and 3-Arg), and three hydrophobic residues (2-Ile and 1-Leu). As the positively charged basic amino acid residues may generally interact with the negatively charged headgroups of lipids via electrostatic effects,44 the side-chains of the arginine residues may interact with the hydrophilic moieties, such as phosphate moieties, of lipids.45 The side chain groups of basic amino acids, such as lysine, can also provide a flexible hydrocarbon spacer and enable hydrophobic interactions.46 The three peptides may adopt various orientations via interacting with the membrane. Several studies have reported that the Antp (43–58) peptide is helical at low ratios of peptide to lipid and becomes less helical at high ratios of peptide to lipid.47,48 Gravin has the smallest tilt angle of the α-helical component with respect to the membrane normal. It may induce the most significant conformational change and disorder of the POPC/POPG acyl chains in the membrane.
As above mentioned, we focused on the changes in the CH stretching mode of the POPC/POPG bilayers. The red shifts in the frequency of the CH stretching mode are found not only in POPC/POPG bilayers but also in the complexes of the model peptides with the POPC/POPG bilayers. Among the three POPC/POPG bilayer–model peptide complexes, the maximum red shift in the frequency of the CH stretching mode of the POPC/POPG acyl chains was observed when Gravin was added. These results indicate that the acyl chain order of the binary unsaturated POPC/POPG bilayers decreases as compared to that of the pure POPC or POPG bilayers, and the chain order of POPC/POPG bilayers also decreases to some extent when the three model peptides are mixed in, especially Gravin. Therefore, we can speculate that the red shift of the CH stretching band of the POPC/POPG bilayers mainly arises from the packing and conformational changes of the POPC/POPG acyl chains in the membranes. This may occur via aromatic residue-containing peptides interacting with the interface region of the POPC/POPG bilayers and disrupting acyl chain packing and cooperativity in the POPC/POPG bilayers. The three peptides influence the structural properties of the POPC/POPG bilayers, particularly the binary lipid acyl chain packing and membrane fluidity. The amplitude of the disorder in the acyl chains is mainly determined by the sequence, structural context, and orientation of the interacting peptides.
3.3. Dichroic properties of the POPC bilayers, POPG bilayers, POPC/POPG bilayers, and POPC/POPG bilayer–model peptide complexes
The CH/CD stretching vibrational and CH2 deformation modes are very useful in determining the lipid order.21 RATR parameters for the POPC bilayers, POPG bilayers, POPC/POPG bilayers, and POPC/POPG bilayer–peptide complexes are shown in Table 2. The pure POPC bilayers are well-ordered with the orientation factor f = 0.40, and the ATR parameters of the POPG bilayers are the same as those of the POPC bilayers. However, the RATR of lipids significantly increased in the POPC/POPG bilayers as compared to that in the pure POPC or POPG bilayers. Correspondingly, the orientation factor f of the POPC/POPG bilayers decreased to 0.35 ± 0.02 and γ increased to 41.2° ± 0.8°. This result further indicates that the addition of POPG induces an obvious decrease in the order of POPC acyl chains. The conformational order of the binary POPC/POPG acyl chains significantly decreases as compared to that of the single composition system.| Sample | RATR of νas (CH2) | f | γ |
|---|---|---|---|
| a Derivations are the upper and lower limits of calculated values for three measurements. | |||
| POPC | 1.18 | 0.40 | 39.2° |
| POPG | 1.18 | 0.40 | 39.2° |
| POPC/POPG | 1.27 ± 0.03 | 0.35 ± 0.02 | 41.2° ± 0.8° |
| POPC/POPG and Vamp2 | 1.38 ± 0.02 | 0.29 ± 0.01 | 43.4° ± 0.4° |
| POPC/POPG and Antp | 1.38 ± 0.02 | 0.29 ± 0.01 | 43.4° ± 0.4° |
| POPC/POPG and Gravin | 1.55 ± 0.03 | 0.20 ± 0.02 | 46.8° ± 0.8° |
In the POPC/POPG bilayers, the RATR of the acyl chains was 1.27 ± 0.03, the orientation factor f was 0.35 ± 0.02, and the corresponding γ was 41.2° ± 0.8°. The values of RATR, f, and γ changed to varying degrees when the three peptides were added into the POPC/POPG bilayers. The value of RATR considerably increased when Gravin was added, whereas only slightly increased when Vamp2 or Antp was added. The corresponding orientation factor f of the POPC/POPG bilayers decreased to 0.20 ± 0.02, and γ increased to 46.8° ± 0.8° when Gravin was added. This result suggests that Vamp2 and Antp have less effect on the CH2 stretching mode of the acyl chains than Gravin. Gravin, which has a smaller tilt angle than Vamp2 and Antp, caused a significant increase in the dichroic ratio and a significant decrease in the orientation factor f of the POPC/POPG acyl chains. Thus, the conformational order of the POPC/POPG acyl chains significantly decreased. These results are consistent with the results of the ATR-FTIR spectroscopy.
3.4. Fluorescence spectra of the POPC bilayer–Trp-OMe and POPC/POPG bilayer–model peptide complexes
Proteins that contain aromatic amino acids display a useful intrinsic fluorescence. Among the three aromatic residues, the fluorescence of Trp is most sensitive to the dielectric constant of the local environment49 because it has highest fluorescence emission intensity and highest quantum yield.50 Therefore, the fluorescence of Trp can be used as a fluorescence probe. Interactions between the membranes and proteins can be conveniently monitored through changes in the Trp fluorescence emission wavelength and intensity.As shown in Fig. 5A, there was an intense fluorescence emission band at 353 nm in the fluorescence spectrum of Trp-OMe in the buffer solution, which can be assigned to the Trp residue. This band had a blue shift of about 18 nm when Trp-OMe was mixed with the POPC bilayers, suggesting that Trp-OMe bound to the POPC bilayers and the indole ring penetrated into the low dielectric region of the POPC bilayers. Blue shifts were also observed when Vamp2, Antp, and Gravin, all of which had Trp residues, were mixed with the POPC/POPG bilayers. As shown in Fig. 5B, a fluorescence emission maximum at 355 nm was observed for the Trp residue in Vamp2 in the buffer solution, with a blue shift to 336 nm when Vamp2 was added to the POPC/POPG bilayers. Similarly, the fluorescence emission peak for Antp at 351 nm was blue-shifted to 337 nm and the fluorescence emission peak at 358 nm for Gravin was blue-shifted to 341 nm when they were mixed with the POPC/POPG bilayers.
 | ||
| Fig. 5 Fluorescence emission spectra of the POPC bilayer–Trp-OMe and POPC/POPG bilayer–peptide complexes. (A) Fluorescence emission spectra of Trp-OMe (a) in the buffer solution and (b) in the POPC bilayers. (B) Fluorescence emission spectra of Vamp2 (a) in the buffer solution and (b) in POPC/POPG bilayers. (C) Fluorescence emission spectra of Antp (a) in the buffer solution and (b) in POPC/POPG bilayers. (D) Fluorescence emission spectra of Gravin (a) in the buffer solution and (b) in POPC/POPG bilayers. | ||
The complexes of the lipid bilayers with Trp-OMe or the three peptides were coated on the quartz surface, whereas Trp-OMe, Vamp2, Antp, and Gravin monomers were dissolved in the buffer solution and measurements were performed in quartz cuvettes. This method ensured that we were not comparing the fluorescence intensity change of the Trp residues with or without lipids. Compared with the monomers in the buffer solution, the fluorescence emission band of the Trp residues had a blue shift not only in the complexes of Trp-OMe and POPC bilayers but also in the complexes of the three Trp-containing peptides and POPC/POPG bilayers. Phe and Tyr residues did not contribute to the emission when the excitation wavelength was 295 nm. A blue shift and increased intensity in the fluorescence emission spectra of the indole group in Trp can be observed in a completely apolar environment.51 Therefore, the blue shift in the fluorescence emission spectrum of the Trp residues in the membranes indicates that the indole ring of Trp-OMe penetrates into the low dielectric region of the POPC bilayers and the local environment surrounding the indole ring changes. Additionally, the three model peptides also bind to the POPC/POPG bilayers with the Trp residue insertion into the apolar interior of the POPC/POPG bilayers. Trp residues play a vital role in the process of peptides interacting with the membranes. Jobin et al. have reported that the number, position in the helix, and size of the hydrophobic face of the Trp residues are important for the internalization efficacy of RW9 as an efficient cell-penetrating peptide.52 In addition, the aromatic residues in the peptides are adjacent to the positively charged basic residues on two sides, and the basic residues can be pulled into the polar headgroup region; thus, it is convenient for the peptides to bind to the POPC/POPG bilayers.44 Accordingly, the aromatic residues may penetrate into the hydrophobic interior of the membrane bilayers and the peptides may bind to the POPC/POPG bilayers; thus, the conformational order of the POPC/POPG acyl chains significantly changes to different extents.
4. Conclusions
The acyl chain order changes of binary unsaturated lipid bilayers were investigated via polarised ATR-FTIR spectroscopy. The alterations in the frequency values of theCH and CC stretching vibrations and dichroic properties can be used to monitor the acyl chain order of the POPC/POPG bilayers. The acyl chain order of the POPC/POPG bilayers significantly decreases as compared to that of the pure POPC or POPG bilayers. Furthermore, the chain order of the POPC/POPG bilayers is influenced by the three aromatic-residue containing peptides as well, involving in the process of the peptides interacting with the membrane bilayers, especially Gravin. In addition, the fluorescence spectroscopic measurements further supported the conclusion that the Trp of the three peptides may insert into the apolar interior region of the POPC/POPG bilayers and the peptides may bind to the POPC/POPG bilayers. Thus, the conformational order of the POPC/POPG acyl chains changes to different extents. Our findings may provide valuable information on the flexibility of the lipid bilayers with different lipid compositions and the effects of the lipid bilayers interacting with the aromatic-residue-containing peptides. It highlights the importance of aromatic residues in influencing peptide binding to the membrane and demonstrates that the stability of the membranes depends on the membrane lipid composition and the sequence, structural context, and orientation of the peptides that are bound.
Abbreviations
| POPC | 2-Oleoyl-1-pamlitoyl-sn-glyecro-3-phosphocholine |
| POPG | 2-Oleoyl-1-pamlitoyl-sn-glyecro-3-glycerol |
| ATR-FTIR | Attenuated total reflectance-Fourier transfer infrared spectroscopy |
| ZnSe | Zinc selenide |
| MARCKS | Myristoylated alanine-rich C kinase substrate |
| FATC | FAT C-terminal |
| PE | Phosphatidylethanolamine |
| NR | Neutron reflectivity |
| ESR | Electron spin resonance |
| DPI | Dual polarisation interferometry |
| MD | Molecular dynamics |
| ITC | Isothermal titration calorimetry |
| NMR | Nuclear magnetic resonance |
| Trp-OMe | Tryptophan methyl ester |
| HEPES | 4-(2-Hydroxyethyl)-1-piperazineethanesulphonic acid |
Acknowledgements
The National Natural Science Foundation of China (grant numbers 30970657 and 21475045), Shanghai Pujiang Program (grant number 09PJ1404300), and East China Normal University (grant numbers 79003A29, 79301207, 79301411, and 41500-515430-14100) are acknowledged for providing the financial support of the work.References
- K. Nobuhiko, I. Akihiko, I. Takehiko, N. Fumimasa, T. Shuichi and T. Kingo, Membranes, 2015, 5, 22–47 CrossRef PubMed.
- M. Goto, H. Sawaguchi, N. Tamai, H. Matsuki and S. Kaneshina, Langmuir, 2010, 26, 13377–13384 CrossRef CAS PubMed.
- H. A. Scheidt, I. Haralampiev, S. Theisgen, A. Schirbel, S. Sbiera, D. Huster, M. Kroiss and P. Müller, Mol. Cell. Endocrinol., 2016, 428, 68–81 CrossRef CAS PubMed.
- M. Fidorra, T. Heimburg and H. M. Seeger, Biochim. Biophys. Acta, Biomembr., 2009, 1788, 600–607 CrossRef CAS PubMed.
- A. G. Lee, Biochim. Biophys. Acta, 2004, 1666, 62–87 CrossRef CAS PubMed.
- A. C. Johansson and E. Lindahl, J. Chem. Phys., 2009, 130, 185101 CrossRef PubMed.
- A. G. Lee, Mol. BioSyst., 2005, 1, 203–212 RSC.
- T. W. Mitchell, K. Ekroos, S. J. Blanksby, A. J. Hulbert and P. L. Else, J. Exp. Biol., 2007, 210, 3440–3450 CrossRef CAS PubMed.
- K. Kobayashi, K. Endo and H. Wada, Front. Recent Dev. Plant Sci., 2016, 7, 336 Search PubMed.
- J. Wang, A. Gambhir, G. Hangyás-Mihályné, D. Murray, U. Golebiewska and S. McLaughlin, J. Biol. Chem., 2002, 277, 34401–34412 CrossRef CAS PubMed.
- L. A. Sommer, M. Schaad and S. A. Dames, J. Biol. Chem., 2013, 288, 20046–20063 CrossRef CAS PubMed.
- G. Wang, B. Mishra, R. F. Epand and R. M. Epand, Biochim. Biophys. Acta, 2014, 1838, 2160–2172 CrossRef CAS PubMed.
- T. Aramaki, Y. Abe, K. Furutani, T. Katayama and T. Ueda, J. Biochem., 2015, 157, 529–537 CrossRef CAS PubMed.
- S. Serrano, A. Araujo, B. Apellaniz, S. Bryson, P. Carravilla, I. de la Arada, N. Huarte, E. Rujas, E. F. Pai, J. L. Arrondo, C. Domene, M. A. Jimenez and J. L. Nieva, J. Biol. Chem., 2014, 289, 6565–6580 CrossRef CAS PubMed.
- J. Cheng, R. Goldstein, A. Gershenson, B. Stec and M. F. Roberts, J. Biol. Chem., 2013, 288, 14863–14873 CrossRef CAS PubMed.
- G. Vitiello, G. Fragneto, A. A. Petruk, A. Falanga, S. Galdiero, A. M. D'Ursi, A. Merlino and G. D'Errico, Soft Matter, 2013, 9, 6442–6456 RSC.
- M. R. Sanders, L. A. Clifton, R. A. Frazier and R. J. Green, Langmuir, 2016, 32, 2050–2057 CrossRef CAS PubMed.
- D. J. Hirst, T. H. Lee, M. J. Swann, S. Unabia, Y. Park, K. S. Hahm and M. I. Aguilar, Eur. Biophys. J., 2011, 40, 503–514 CrossRef CAS PubMed.
- T. D. Romo, L. A. Bradney, D. V. Greathouse and A. Grossfield, Biochim. Biophys. Acta, Biomembr., 2011, 1808, 2019–2030 CrossRef CAS PubMed.
- K. Witte, B. E. Olausson, A. Walrant, I. D. Alves and A. Vogel, Biochim. Biophys. Acta, 2013, 1828, 824–833 CrossRef CAS PubMed.
- R. N. A. H. Lewis and R. N. McElhaney, Biochim. Biophys. Acta, Biomembr., 2013, 1828, 2347–2358 CrossRef CAS PubMed.
- G. Güler, R. M. Gärtner, C. Ziegler and W. Mäntele, J. Biol. Chem., 2016, 291, 4295–4307 CrossRef PubMed.
- S. Ergun, P. Demir, T. Uzbay and F. Severcan, Biochim. Biophys. Acta, Biomembr., 2014, 1838, 2798–2806 CrossRef CAS PubMed.
- Z. D. Schultz and I. W. Levin, Annu. Rev. Anal. Chem., 2011, 4, 343–366 CrossRef CAS PubMed.
- M. Arczewska, D. M. Kamiński, E. Górecka, D. Pociecha, E. Rój, A. Sławińska-Brych and M. Gagoś, Biochim. Biophys. Acta, Biomembr., 2013, 1828, 213–222 CrossRef CAS PubMed.
- B. Peng, X.-Y. Ding, C. Sun, W. Liu, J. Z. H. Zhang and X. Zhao, RSC Adv., 2016, 6, 45569–45577 RSC.
- E. Sikorska, M. Dawgul, K. Greber, E. Iłowska, A. Pogorzelska and W. Kamysz, Biochim. Biophys. Acta, Biomembr., 2014, 1838, 2625–2634 CrossRef CAS PubMed.
- M. G. K. Benesch, R. N. A. H. Lewis and R. N. McElhaney, Biochim. Biophys. Acta, Biomembr., 2016, 1858, 168–180 CrossRef CAS PubMed.
- F. Korkmaz, S. Köster, Ö. Yildiz and W. Mäntele, Biochemistry, 2008, 47, 12126–12134 CrossRef CAS PubMed.
- R. Ishiguro, N. Kimura and S. Takahashi, Biochemistry, 1993, 32, 9792–9797 CrossRef CAS PubMed.
- M. Pritsker, J. Rucker, T. L. Hoffman, R. W. Doms and Y. Shai, Biochemistry, 1999, 38, 11359–11371 CrossRef CAS PubMed.
- A. Menikh, M. T. Saleh, J. Gariépy and J. M. Boggs, Biochemistry, 1997, 36, 15865–15872 CrossRef CAS PubMed.
- I. T. Arkin, W. P. Russ, M. Lebendiker and S. Schuldiner, Biochemistry, 1996, 35, 7233–7238 CrossRef CAS PubMed.
- S. O. Smith, R. Jonas, M. Braiman and B. J. Bormann, Biochemistry, 1994, 33, 6334–6341 CrossRef CAS PubMed.
- L. K. Tamm and S. A. Tatulian, Biochemistry, 1993, 32, 7720–7726 CrossRef CAS PubMed.
- O. K. Gasymov, A. R. Abduragimov, T. N. Yusifov and B. J. Glasgow, Protein Sci., 2000, 9, 325–331 CrossRef CAS PubMed.
- A. Blume, Curr. Opin. Colloid Interface Sci., 1996, 1, 64–77 CrossRef CAS.
- H. L. Casal and H. H. Mantsch, Biochim. Biophys. Acta, Rev. Biomembr., 1984, 779, 381–401 CrossRef CAS.
- L. Janosi and A. A. Gorfe, J. Chem. Theory Comput., 2010, 6, 3267–3273 CrossRef CAS PubMed.
- S. A. Tatulian, Methods Mol. Biol., 2013, 974, 177–218 CAS.
- C. Vigano, L. Manciu, F. Buyse, E. Goormaghtigh and J. M. Ruysschaert, Pept. Sci., 2000, 55, 373–380 CrossRef CAS.
- F.-X. Ding, H. Xie, B. Arshava, J. M. Becker and F. Naider, Biochemistry, 2001, 40, 8945–8954 CrossRef CAS PubMed.
- B. Ding and Z. Chen, J. Phys. Chem. B, 2012, 116, 2545–2552 CrossRef CAS PubMed.
- A. Gambhir, G. Hangyas-Mihalyne, I. Zaitseva, D. S. Cafiso, J. Y. Wang, D. Murray, S. N. Pentyala, S. O. Smith and S. McLaughlin, Biophys. J., 2004, 86, 2188–2207 CrossRef CAS PubMed.
- A. M. Bouchet, F. Lairion, J. M. Ruysschaert and M. F. Lensink, Chem. Phys. Lipids, 2012, 165, 89–96 CrossRef CAS PubMed.
- M. Hoernke, C. Schwieger, A. Kerth and A. Blume, Biochim. Biophys. Acta, Biomembr., 2012, 1818, 1663–1672 CrossRef CAS PubMed.
- B. Christiaens, S. Symoens, S. Vanderheyden, Y. Engelborghs, A. Joliot, A. Prochiantz, J. Vandekerckhove, M. Rosseneu and B. Vanloo, Eur. J. Biochem., 2002, 269, 2918–2926 CrossRef CAS PubMed.
- B. Christiaens, J. Grooten, M. Reusens, A. Joliot, M. Goethals, J. Vandekerckhove, A. Prochiantz and M. Rosseneu, Eur. J. Biochem., 2004, 271, 1187–1197 CrossRef CAS PubMed.
- D. Williams, J. Vicogne, I. Zaitseva, S. McLaughlin and J. E. Pessin, Mol. Biol. Cell, 2009, 20, 4910–4919 CrossRef CAS PubMed.
- C. A. Kraft, J. L. Garrido, L. Leiva-Vega and G. Romero, Sci. Signaling, 2009, 2, p14 CrossRef PubMed.
- J. R. Lakowicz, Principles of Fluorescence Spectroscopy, Springer, New York, 3rd edn, 2006 Search PubMed.
- M.-L. Jobin, M. Blanchet, S. Henry, S. Chaignepain, C. Manigand, S. Castano, S. Lecomte, F. Burlina, S. Sagan and I. D. Alves, Biochim. Biophys. Acta, Biomembr., 2015, 1848, 593–602 CrossRef CAS PubMed.
Footnote |
| † Electronic supplementary information (ESI) available. See DOI: 10.1039/c7ra01145h |
| This journal is © The Royal Society of Chemistry 2017 |