 Open Access Article
Creative Commons Attribution 3.0 Unported Licence
Co-liquefaction of microalgae and polypropylene in sub-/super-critical water†
Xiuyun Wu‡
ab,
Junmei Liang‡a,
Yulong Wu *ac,
Husheng Hua,
Shaobin Huangde and
Kejing Wua
aInstitute of Nuclear and New Energy Technology, Tsinghua University, Beijing 100084, PR China. E-mail: wylong@tsinghua.edu.cn; Fax: +86-10-69771464; Tel: +86-10-89796163
bDongfeng Peugeot Citroen Automobile company LTD, Wuhan 430100, PR China
cBeijing Engineering Research Center for Biofuels, Beijing 100084, PR China
dSchool of Environment and Energy, Guangdong 510006, PR China
eGuangdong Provincial Key Laboratory of Atmospheric Environment and Pollution Control, Guangdong 510006, PR China
First published on 1st March 2017
Abstract
In the current study, Dunaliella tertiolecta (D. tertiolecta) and polypropylene (PP) were chosen to investigate the co-liquefaction process of microalgae and plastic. The results show that a maximum synergistic effect was found when the mass ratio of D. tertiolecta to PP was 8![[thin space (1/6-em)]](https://www.rsc.org/images/entities/char_2009.gif) :
:![[thin space (1/6-em)]](https://www.rsc.org/images/entities/char_2009.gif) 2. The addition of PP mainly impacts the composition of the bio-oil products, particularly reducing the acid content. When D. tertiolecta was liquefied individually, the relative content of acid in bio-oil could reach 18.73%, while for D. tertiolecta and PP co-liquefaction in a ratio of 8
2. The addition of PP mainly impacts the composition of the bio-oil products, particularly reducing the acid content. When D. tertiolecta was liquefied individually, the relative content of acid in bio-oil could reach 18.73%, while for D. tertiolecta and PP co-liquefaction in a ratio of 8![[thin space (1/6-em)]](https://www.rsc.org/images/entities/char_2009.gif) :
:![[thin space (1/6-em)]](https://www.rsc.org/images/entities/char_2009.gif) 2, the acid content of bio-oil was lower than the detection limit of GC-MS (lower than 100 ppm). The reaction mechanism for the co-liquefaction process of PP and the main components of microalgae has also been studied. The addition of PP has a significant effect on the transformation pathways of carbohydrates in microalgae, and this also promotes the Maillard reaction between carbohydrates and proteins or their hydrolysates.
2, the acid content of bio-oil was lower than the detection limit of GC-MS (lower than 100 ppm). The reaction mechanism for the co-liquefaction process of PP and the main components of microalgae has also been studied. The addition of PP has a significant effect on the transformation pathways of carbohydrates in microalgae, and this also promotes the Maillard reaction between carbohydrates and proteins or their hydrolysates.
1. Introduction
With the depletion of fossil fuel energy and the growing awareness about environmental protection, the development of new, environmentally friendly and renewable energy has become the focus of international energy research.1,2 Bio-oils produced from the thermochemical conversion of biomass resources are regarded as a potential substitute for petroleum.3,4 As an important type of biomass resource, microalgae are considered as potential feedstocks for bio-oil production due to their superior photosynthetic efficiency, higher growth rate, area-specific yield and efficient carbon dioxide fixation.5 Furthermore, microalgae can greatly reduce CO2 emissions since they can be cultivated using industrial waste gases that contain CO2.6However, bio-oil obtained from the thermochemical conversion of microalgae have some disadvantages, such as high oxygen content, low high-heating value (HHV), low volatility and delayed ignition time in an engine, which severely hinder its practical applications. Hence, it is necessary to explore how the quality of bio-oils can be improved. At present, there are two main pathways to improve the quality of bio-oil: (1) high-pressure hydrogenation processing and catalytic cracking7 and (2) co-processing (including co-pyrolysis and co-liquefaction processes) of biomass with other materials such as coal, domestic garbage and plastic.8 The latter has received increasing attention in recent years. Since plastics like polyethylene (PE) and polypropylene (PP) contain a large amount of hydrogen (approximately 14 wt%), its co-processing with biomass can provide hydrogen, which can lead to an increase of liquid yield and improvement in the oil quality.9 Moreover, high-pressure hydrogenation in the subsequent upgrading process can be avoided. In addition, co-processing can also handle waste plastic efficiently, which is the major source of white pollution. To this end, the co-processing has broad application prospects.
In recent years, some studies concerning the co-pyrolysis and co-liquefaction of plastic and terrestrial biomass materials (the main ingredients being cellulose, hemicellulose and lignin) have been published reporting the efforts to reduce the decomposition temperature of plastic. The results show that the key to the interaction between plastic and biomass was whether the decomposition temperature ranges of the co-processed materials could be overlapped.10 The decomposition temperature of plastic is generally higher than 400 °C, and the decomposition temperature of lignin is also about 400 °C.11 Sørum et al.12 confirmed that the co-pyrolysis of plastic and terrestrial biomass material can produce high quality fuel oil or high value chemicals. However, the co-processing of plastic and microalgae has been rarely investigated to date. Wu et al.13 found that the lipid compounds in microalgae undergo pyrolysis after 380 °C. This indicates that the decomposition temperatures of microalgae and plastic overlapped. Therefore, it is possible to improve the quality of bio-oil by adding plastic into the thermochemical conversion process of microalgae. In a previous study,14 we studied the kinetics of the co-pyrolysis of microalgae and plastic and found that their interaction can decrease the pyrolysis activation energy of microalgae. The two studies described above and by our group were carried out using thermogravimetric analysis (TGA), and the experimental conditions were very similar to those of the pyrolysis process. Due to extremely high water content in microalgae feedstocks, liquefaction is much better than pyrolysis for algal conversion. However, only limited studies on the co-liquefaction of microalgae and plastics have been published, compared to those on co-pyrolysis. Pei et al.15 and Duan et al.16 have studied the co-liquefaction of microalgae with high density PE and waste rubber tires in supercritical ethanol, respectively, and have found a positive synergistic effect with the two reactants. Considering that water is the cheapest and most environmentally friendly medium, and the fact that microalgae grow in water and contain a large amount of water, the co-liquefaction of microalgae with plastic in water, rather than an organic solvent, is potentially the most promising process and is yet to be reported.
The interaction between microalgae and plastics can increase the yield and quality of bio-oil, but there are only a few reports on the mechanism and process of the interaction between the two, particularly on the hydrothermal liquefaction (HTL) process. The objective of this study is to study the interaction between plastic (PP) and microalgae (D. tertiolecta) in the HTL process and probe the possible reaction mechanism through the analysis of the composition of bio-oil obtained with different operating conditions.
2. Materials and methods
2.1. Materials
D. tertiolecta (Xi'an Victory Biochemical Co. China) and PP (Shanghai Yangli Electromechanical Science and Technology LTD., China) were used in this study. The microalgae were dried at 105 °C for 24 h, ground and sieved to obtain a fraction under 120 mesh (<125 μm), while PP was dried at 80 °C for 24 h. The composition and analysis of the materials are listed in Table 1. In particular, D. Tertiolecta is made up of numerous lipids, carbohydrates and proteins, and the others components are chlorophyll and minerals.| Industrial analysis/% | Elemental analysis/% | Chemical composition analysis/% | |||||
|---|---|---|---|---|---|---|---|
| Material | D. tertiolecta | PP | Material | D. tertiolecta | PP | Material | D. tertiolecta |
| a Calculated by difference. | |||||||
| Moisture War | 1.60 | — | C | 43.31 | 84.55 | Lipids | 5.18 |
| Volatiles Var | 64.70 | 100 | H | 5.96 | 13.58 | Proteins | 30.63 |
| Ash Aar | 16.50 | — | Oa | 29.90 | — | Carbohydrates | 52.31 |
| Fixed carbon CFar | 17.20 | — | N | 4.33 | — | Othersa | 11.88 |
| Empirical formula | CH1.65O0.52N0.09 | (C3H6)n | |||||
| HHV/MJ·kg−1 | 17.81 | 45.52 | |||||
2.2. Co-liquefaction experiment
The hydrothermal liquefaction experiment was carried out in a stainless batch autoclave with 50 mL capacity. Similar to that in a typical liquefaction process, 3 g of a mixture of microalgae and plastic blended with 30 mL of deionized water was loaded into the reactor, which was then sealed. The reactor was heated to the target temperature using an electric heating jacket, kept at this temperature for a certain residence time between 0-40 min, and taken out and quickly cooled to room temperature using water.The separation of the liquefaction products is depicted in Fig. S1 (ESI†). The products of direct liquefaction include gas, liquid, and solid phases. The gas was vented after the autoclave had cooled. The liquid phase was filtered to separate the water-insoluble fraction. The water-insoluble fraction and the walls of the autoclave were washed with dichloromethane thrice and the contents were separated through filtration. The dichloromethane was removed in a rotary evaporator at 313 K under reduced pressure and the remaining dichloromethane phase was called “bio-oil”. The water-insoluble fraction remaining on the filter paper was dried at 378 K for more than 24 h, weighed, and designated as the “residue“. Each experiment was repeated 3 times and the average values were reported.
The liquefaction conversion and product yield were calculated as follows:
| Yield of bio-oil = (weight of bio-oil ÷ weight of feedstock) × 100% |
| Yield of residue = (weight of residue ÷ weight of feedstock) × 100% |
| Liquefaction conversion = 1 − Yield of residue. |
2.3. Product analysis
The character of the bio-oil obtained from the co-liquefaction experiment was analyzed using GC-MS. The analyses were conducted on a 5975C type GC-MS spectrometer (Aglient, USA) equipped with flame ionization detector and HP-5MS column (30 m × 250 μm × 0.25 μm). The carrier gas was helium (He) at a flow rate of 1 mL min−1, the injection volume was 0.1 μL, the diversion ratio was 50![[thin space (1/6-em)]](https://www.rsc.org/images/entities/char_2009.gif) :
:![[thin space (1/6-em)]](https://www.rsc.org/images/entities/char_2009.gif) 1 and the ionization method used was EI at an electron energy of 70 eV. Three minutes of solvent delay was set to protect the filament. The column was held at 60 °C for 1 min, and then the temperature was raised to 150 °C using a heating rate of 5 °C min and held for 5 min. Then, the temperature was increased to 300 °C at 10 °C min and held for 5 min. The total run-time was approximately 44 min. The main peaks of the bio-oil were identified using the NIST08 mass spectral library.
1 and the ionization method used was EI at an electron energy of 70 eV. Three minutes of solvent delay was set to protect the filament. The column was held at 60 °C for 1 min, and then the temperature was raised to 150 °C using a heating rate of 5 °C min and held for 5 min. Then, the temperature was increased to 300 °C at 10 °C min and held for 5 min. The total run-time was approximately 44 min. The main peaks of the bio-oil were identified using the NIST08 mass spectral library.
3. Results and discussion
3.1. The influence of the reactant proportion on the liquefaction process
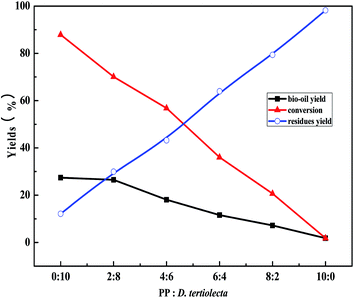
![[thin space (1/6-em)]](https://www.rsc.org/images/entities/char_2009.gif) :
:![[thin space (1/6-em)]](https://www.rsc.org/images/entities/char_2009.gif) 10 to 10
10 to 10![[thin space (1/6-em)]](https://www.rsc.org/images/entities/char_2009.gif) :
:![[thin space (1/6-em)]](https://www.rsc.org/images/entities/char_2009.gif) 0, the bio-oil yield and the conversion of reactants reduced almost linearly, while the residue yield rapidly increased. When PP
0, the bio-oil yield and the conversion of reactants reduced almost linearly, while the residue yield rapidly increased. When PP![[thin space (1/6-em)]](https://www.rsc.org/images/entities/char_2009.gif) :
:![[thin space (1/6-em)]](https://www.rsc.org/images/entities/char_2009.gif) D. tertiolecta = 10
D. tertiolecta = 10![[thin space (1/6-em)]](https://www.rsc.org/images/entities/char_2009.gif) :
:![[thin space (1/6-em)]](https://www.rsc.org/images/entities/char_2009.gif) 0, the yield of bio-oil was only 1.84%, and a large amount of white solid residue was found on the bottom of the reaction kettle after the liquefaction experiment. That is to say, under the current experimental conditions, PP almost does not breakdown. However, under the same reaction conditions, the conversion was as high as 87.87% when D. tertiolecta was liquefied alone (PP
0, the yield of bio-oil was only 1.84%, and a large amount of white solid residue was found on the bottom of the reaction kettle after the liquefaction experiment. That is to say, under the current experimental conditions, PP almost does not breakdown. However, under the same reaction conditions, the conversion was as high as 87.87% when D. tertiolecta was liquefied alone (PP![[thin space (1/6-em)]](https://www.rsc.org/images/entities/char_2009.gif) :
:![[thin space (1/6-em)]](https://www.rsc.org/images/entities/char_2009.gif) D. tertiolecta = 0
D. tertiolecta = 0![[thin space (1/6-em)]](https://www.rsc.org/images/entities/char_2009.gif) :
:![[thin space (1/6-em)]](https://www.rsc.org/images/entities/char_2009.gif) 10) and the yield of bio-oil was 27.42%.
10) and the yield of bio-oil was 27.42%.
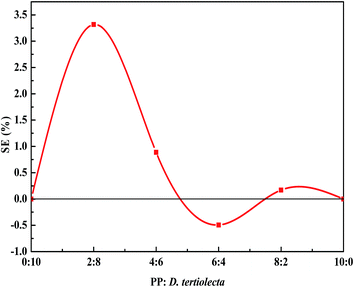
The synergistic effect (SE) was used to evaluate the interaction between the two different reactants and calculation formula was as follows:
| SE = YC − (XD × YD + (1 − XD) × YPP) |
The changing tendency of SE with the reactant proportion is shown in Fig. 2. It can be seen from the numerical SE that there exists some interaction between D. tertiolecta and PP, but the impact of the interaction on the yield of the target product is not very significant. Upon the addition of PP, the SE reached a maximum of 3.3% when the ratio of PP and D. tertiolecta was 2![[thin space (1/6-em)]](https://www.rsc.org/images/entities/char_2009.gif) :
:![[thin space (1/6-em)]](https://www.rsc.org/images/entities/char_2009.gif) 8, which demonstrated that the synergy effect between PP and D. tertiolecta was strongest at this ratio. When the ratio of PP and D. tertiolecta was 6
8, which demonstrated that the synergy effect between PP and D. tertiolecta was strongest at this ratio. When the ratio of PP and D. tertiolecta was 6![[thin space (1/6-em)]](https://www.rsc.org/images/entities/char_2009.gif) :
:![[thin space (1/6-em)]](https://www.rsc.org/images/entities/char_2009.gif) 4, the SE reached a negative value, which showed that at this proportion, the synergy effect is negative between PP and D. tertiolecta.
4, the SE reached a negative value, which showed that at this proportion, the synergy effect is negative between PP and D. tertiolecta.
| Name | Molecular formula | Structural formula | Time (RT/min) | Relative amount Δ (%) | ||||
|---|---|---|---|---|---|---|---|---|
0![[thin space (1/6-em)]](https://www.rsc.org/images/entities/char_2009.gif) : :![[thin space (1/6-em)]](https://www.rsc.org/images/entities/char_2009.gif) 10 10 |
2![[thin space (1/6-em)]](https://www.rsc.org/images/entities/char_2009.gif) : :![[thin space (1/6-em)]](https://www.rsc.org/images/entities/char_2009.gif) 8 8 |
4![[thin space (1/6-em)]](https://www.rsc.org/images/entities/char_2009.gif) : :![[thin space (1/6-em)]](https://www.rsc.org/images/entities/char_2009.gif) 6 6 |
6![[thin space (1/6-em)]](https://www.rsc.org/images/entities/char_2009.gif) : :![[thin space (1/6-em)]](https://www.rsc.org/images/entities/char_2009.gif) 4 4 |
8![[thin space (1/6-em)]](https://www.rsc.org/images/entities/char_2009.gif) : :![[thin space (1/6-em)]](https://www.rsc.org/images/entities/char_2009.gif) 2 2 |
||||
a Δ Only compounds with a confidence level higher than 80 were counted, the relative content of the compounds was calculated according to the peak area of the GC-MS ion flow diagram. The relative amount in the table refer to PP![[thin space (1/6-em)]](https://www.rsc.org/images/entities/char_2009.gif) : :![[thin space (1/6-em)]](https://www.rsc.org/images/entities/char_2009.gif) D. tertiolecta. D. tertiolecta. |
||||||||
| 2-Cyclopenten-1-one | C5H6O |  |
3.6 | — | — | 1.95 | 2.93 | 6.26 |
| Cyclopentanone, 2-methyl- | C6H10O |  |
3.7 | 1.54 | — | — | — | — |
| 2-Cyclopenten-1-one, 2-methyl- | C6H8O |  |
4.8 | 3.21 | 4.67 | 6.36 | 8.32 | 8.81 |
| 2-Cyclopenten-1-one, 3-methyl- | C6H8O |  |
6.0 | 3.25 | 4.49 | 5.60 | 7.01 | 9.11 |
| Phenol | C6H5OH |  |
6.3 | 2.86 | 3.47 | 3.29 | 3.31 | 3.51 |
| 2,3-Dimethyl-2-cyclopenten-1-one | C7H10O |  |
7.8 | 1.62 | 4.77 | 2.47 | 4.33 | 2.00 |
| Phenol, 4-methyl- | C7H8O |  |
8.7 | 2.43 | 4.85 | 4.70 | 4.64 | 4.70 |
| 2(4H)-Benzofuranone, 5,6,7,7a-tetrahydro-4,4,7a-trimethyl- | C11H16O2 |  |
20.9 | 7.63 | 7.00 | 7.73 | 9.55 | 9.94 |
| Cyclohexanone, 2,2,6-trimethyl- | C9H16O |  |
7.7 | — | 1.53 | — | — | — |
| Butyrolactone | C4H6O2 |  |
4.9 | — | — | — | 1.84 | 2.74 |
| 1,2-Cyclopentanedione, 3-methyl- | C6H8O2 |  |
7.5 | — | — | — | — | 4.55 |
| Pyrazine, methyl | C5H6N2 |  |
3.4 | — | — | 1.02 | 1.28 | — |
| 2-Pyrrolidinone | C4H7NO |  |
8.4 | 3.06 | 2.82 | 3.54 | 3.21 | 3.82 |
| 2,5-Pyrrolidinedione, 1-methyl- | C5H7NO2 |  |
9.1 | 2.26 | 2.06 | 2.67 | 3.28 | — |
| 3-Pyridinol, 6-methyl- | C6H7NO |  |
10.8 | 5.52 | 5.14 | — | 8.57 | 9.71 |
| 9H-Pyrido[3,4-b]indole, 1-methyl- | C12H10N2 |  |
31.0 | 3.60 | 3.22 | 3.32 | 1.79 | — |
| 9H-Pyrido[3,4-b]indole | C11H8N2 |  |
31.1 | 1.94 | 2.46 | 2.90 | 1.96 | 1.66 |
| 2,5-Piperazinedione, 3-benzyl-6-isopropyl- | C14H18N2O2 |  |
33.8 | 4.32 | 3.32 | 4.71 | 5.82 | 4.99 |
| Pyrrolo[1,2-a]pyrazine-1,4-dione, hexahydro-3-(phenylmethyl)- | C14H16N2O3 |  |
34.9 | 4.68 | 3.94 | 5.01 | 5.75 | 5.76 |
| Benzene, 1,2,3,5-tetramethyl- | C10H14 |  |
10.9 | 2.57 | 3.10 | 1.86 | — | — |
| Benzene, 1,3,5-trimethyl- | C9H12 |  |
7.4 | — | 1.39 | — | — | — |
| 1-Pentadecene | C15H30 |  |
19.7 | 3.45 | 5.28 | 6.32 | 6.38 | 6.47 |
| 2-Hexadecene, 3,7,11,15-tetramethyl-, [R-[R*,R*-(E)]]- | C20H40 |  |
29.3 | 18.07 | 15.60 | 15.68 | 10.18 | 13.18 |
| Hexadecanoic acid | C16H32O2 |  |
30.9 | 18.73 | 12.50 | 14.34 | 5.15 | — |
| Hexadecanamide | C16H33NO |  |
33.4 | 9.24 | 8.39 | 6.54 | 4.75 | 2.79 |
It can be seen that the bio-oil obtained from D. tertiolecta was mainly composed of oxygen containing compounds, such as ring ketones, lactones and phenols produced by the decomposition of sugars and fatty acids produced by lipid hydrolysis. Hexadecanoic acid is the most abundant component of the bio-oil obtained from D. tertiolecta, accounting for 18.73% of the total bio-oil. In addition, 2-hexadecene, 3,7,11,15-tetramethyl-, [R-[R*,R*-(E)]]- had the highest content of hydrocarbons, which accounted for 18.07% of the total bio-oil and originated from the decomposition of chlorophyll whose detailed reaction mechanism will be discussed in Section 3.4.
The distribution of the co-liquefaction bio-oil products was similar to the D. tertiolecta liquefaction products and indicated that PP still did not breakdown during the co-liquidation process. However, the addition of PP had a significant effect on the content of each bio-oil component. As can be seen in Table 2, the addition of PP can promote the formation of ketone compounds. Upon increasing the PP content in the reactants, the content of five-membered ring ketone compounds in the bio-oil products was significantly increased, which means that PP had a significant impact on the decomposition pathway of the sugars in the microalgae. In addition, it is worth noting that the addition of PP significantly decreased the content of hexadecanoic acid in the bio-oil product. This may indicate that PP interacts with hexadecanoic acid during the co-liquidation process, but products of hexadecanoic acid decarboxylation were not detected in the bio-oil product. In our previous study, we found that PP can react with carbonyl compounds in D. tertiolecta and reduce the output of CO2.16 The conclusion that can be made is that some hexadecanoic acid may have reacted with PP and produced macromolecular coking and water. However, this specific process needs further experimental research.
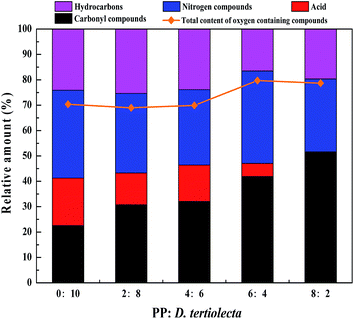
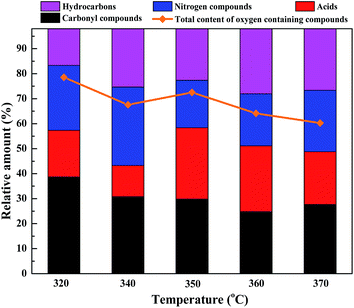
Similarly, the proportion of reactants has a great influence on the composition of bio-oil and the data in Table 2 were classified by the category of compounds such as carbonyl compounds, nitrogen compounds, hydrocarbons and acids in order for clarity. This classification was based on the source of each compound, such as carbonyl compounds (ketone, esters etc.) were mainly produced by the decomposition of sugar and nitrogen compounds were mainly produced from protein decomposition, acids resulted from lipid hydrolysis and hydrocarbons were produced by the deoxygenation of oxygen compounds or denitrification of nitrogen compounds. The classification results are shown in Fig. 3. It can be seen that the content of carbonyl compounds increased with the proportion of PP in the reactants, whereas the content of acid decreased. When the ratio of PP and D. tertiolecta was 8![[thin space (1/6-em)]](https://www.rsc.org/images/entities/char_2009.gif) :
:![[thin space (1/6-em)]](https://www.rsc.org/images/entities/char_2009.gif) 2, the acid content in the bio-oil products was lower than the detection limit of GC-MS (lower than 100 ppm).
2, the acid content in the bio-oil products was lower than the detection limit of GC-MS (lower than 100 ppm).
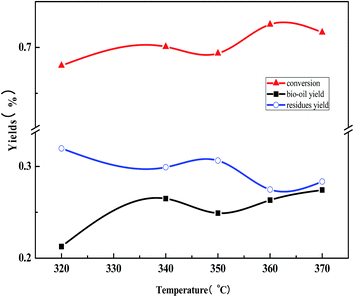
3.2. The influence of reaction temperature on the liquefaction process
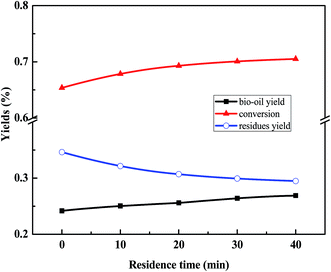
3.3. The influence of residence time on the liquefaction process
The main reactions, which occurred between 0 min and 10 min, are the conversion of furfural materials. It can be seen that when comparing the ion chromatograms, the product at 0 min contains a large amount of furfural and its derivatives, such as furfural (RT = 3.6), 2-furancarboxaldehyde, 5-methyl- (RT = 6.0), 2-cyclopenten-1-one, 2-hydroxy-3-methyl- (RT = 7.5), 2-furancarboxaldehyde, 5-(hydroxymethyl)-(5-HMF, RT = 12.8). However, no aldehydes existed in the product at 10 min; most aldehydes were turned into residues and a small proportion was transformed into ketones, lactones, and phenols or reacted with N-containing compounds and proteins, generating hydroxyl pyridine ring, pyrrolidone, and amide compounds.
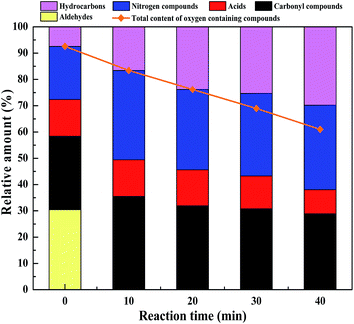
The changes in the contents of the bio-oil components are shown in Fig. 7. It can be seen that the total N-containing compounds increased after 10 min, corresponding to the decomposition of most of the proteins. Upon increasing the residence time the amount of acid in the bio-oil product reduced and the hydrocarbon content increased gradually. It is worth noting that the total amount of oxygenated chemicals was almost equal to the sum of aldehyde, ketones, acid, ester and N-containing compounds before 30 min and illustrated that all the N-containing compounds contained oxygen (called N&O compounds) at this time. After 30 min, N-containing compounds containing no oxygen, such as indole, began to be generated. Moreover, the total oxygenated chemicals in the bio-oil product decreased from 92.56% to 68.95% and the hydrocarbon content increased from 7.43% to 25.36%. It can be concluded that the main reason for the decrease in the oxygenated chemicals in bio-oil was the deoxygenation reaction of the oxygenated compounds, such as ketones, phenols and esters, leading to the formation of hydrocarbons before 30 min. In contrast, it was more difficult to deoxygenate the N and O compounds.
3.4. Analysis mechanism of the co-liquefaction process
It can be seen from Fig. S3† that lipid decomposition begins before 260 °C and produces hexadecanoic acid (RT = 30.97). Moreover, some methyl hexadecanoate (RT = 30.4) and triethyl citrate (RT = 25.6) existed in the reaction system, which may have come from esterification reaction of acid and alcohols (produced by the decomposition of glycerin or reduction of amino acids). Carbohydrate decomposition occurred in large amounts after 280 °C with the main product being 5-HMF (RT = 12.8). The content of 5-HMF reached a maximum (59.69%) at 300 °C. 5-HMF has a high activity for polymerization and easily cokes leading to a rapid reduction in the 5-HMF content as the temperature increases. The content of 5-HMF dropped to 13.40% when the temperature reached 340 °C and the content of hexadecanoic acid began to decrease at this temperature.
(1) Lipids. Lipids in microalgae usually refer to the triglyceride fatty acids, which have a poor thermal stability and are hydrolyzed to produce fatty acids and glycerin at low temperatures. It can be seen from Table S1† that tripalmitin was the main lipid composition in D. tertiolecta. The hydrolysate of tripalmitin is hexadecanoic acid, which has a high stability under hydrothermal conditions. However, the decarboxylation of hexadecanoic acid can still occur when the temperature is high enough and produces hydrocarbons.
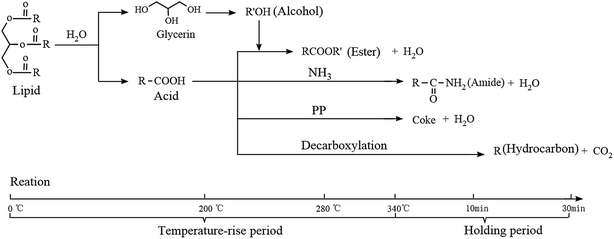
The main reaction route for lipids is shown in Fig. 8. During the temperature-rise period, lipid hydrolysis generated glycerol and fatty acids, while glycerol hydrolysis produced small molecules of alcohols, such as methanol, which then react with the fatty acids to produce fatty acid esters at 200 °C (methyl hexadecanoate, RT = 30.4). Ester hydrolyzed completely when the temperature reached 280 °C (Table S1†). When temperature increased to 340 °C, fatty acids started to react with NH3 (produced by decomposition of protein) and produced amides (hexadecanamide, RT = 33.4); at the same time, because of the existence of PP, a large amount of the acids reacted with PP and turned into residues (Table 2), while a part of the acids were decarboxylated during the holding time and produced CO2 and hydrocarbons with the loss of one carbon atom.
It is worth mentioning that the hydrocarbons in bio-oil are generally recognized as the decarboxylated products of acids. However, in this study, the main hydrocarbon ingredient (2-hexadecene, 3,7,11,15-tetramethyl-, [R-[R*,R*-(E)]]-), which accounted for more than 60% of the total hydrocarbons, originated from the decomposition of chlorophyll. Chlorophyll was esterified by a porphyrin ring and leaf alcohol (3,7,11,15-tetramethyl-2-hexadecen-1-ol) and hydrolyzed at a low temperature to produce leaf alcohol. However, the leaf alcohol began to dehydrate after 320 °C and generated 2-hexadecene, 3,7,11,15-tetramethyl-, [R-[R*,R*-(E)]]-. The specific reaction pathways are shown in Fig. S4 (ESI†).
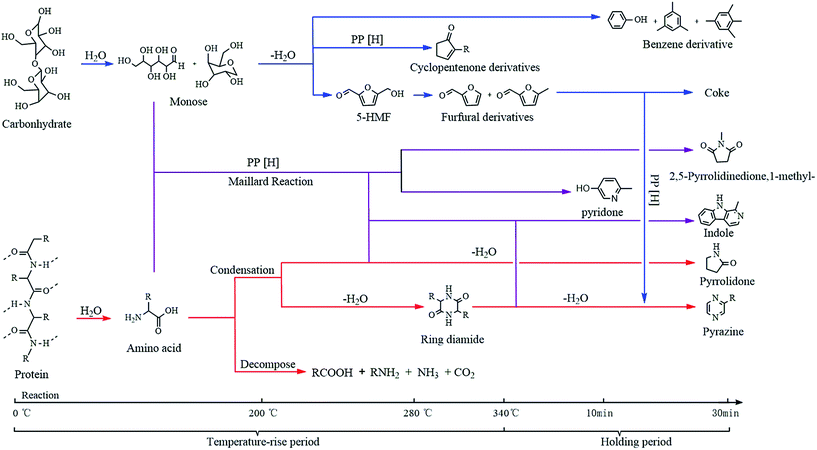
(2) Carbohydrates and proteins. Fig. 9 shows the reaction routes for carbohydrates and proteins. In the HTL process, the carbohydrates and proteins were hydrolyzed at a low temperature (before 200 °C) to produce monosaccharides and amino acids, respectively. Monosaccharides have two main reaction routes, one is the conversion into the furfural class materials and then in to residues. This particular process was discussed in Section 3.4.1. The other reaction route is the production of cyclopentenone derivatives. It can be seen from Table 2 that the content of cyclopentene derivatives in bio-oil increased upon increasing the proportion of PP and included 2-methyl-2-cyclopenten-1-one, the content of which ranged from 3.21 to 8.81 when the mass ratio of PP and D. tertiolecta increases from 0
![[thin space (1/6-em)]](https://www.rsc.org/images/entities/char_2009.gif) :
:![[thin space (1/6-em)]](https://www.rsc.org/images/entities/char_2009.gif) 10 to 8
10 to 8![[thin space (1/6-em)]](https://www.rsc.org/images/entities/char_2009.gif) :
:![[thin space (1/6-em)]](https://www.rsc.org/images/entities/char_2009.gif) 2, respectively. The addition of PP produced carbohydrate and further resulted in cyclopentenone derivatives, which reduced coking indirectly.
2, respectively. The addition of PP produced carbohydrate and further resulted in cyclopentenone derivatives, which reduced coking indirectly.
Amino acids produced by protein hydrolysis can be decomposed to NH3, CO2, carboxylic acids and amines, or produce an annular amide (e.g. 2,5-piperazinedione, 3-benzyl-6-isopropyl-, RT = 33.8) via condensation. Carbohydrates and proteins and their hydrolysates can react to generate N&O compounds such as pyridine and pyrazine. This type of reaction is called the Maillard reaction. From the perspective of product composition (see Table 2), the addition of PP has a certain role in promoting the Maillard reaction, which has not been reported in literature.
Generally speaking, in the co-liquefaction process, PP is not directly involved in the conversion of carbohydrates and proteins, but the existence of PP can have a significant effect on the decomposition route of carbohydrates and promote the Maillard reaction. This may be attributed to the hydrogen donating ability of PP and the specific effect of PP will be investigated in further studies.
4. Conclusion
The co-liquefaction process of D. tertiolecta and PP was investigated in this study, the main results show that the addition of PP mainly impacts the composition of bio-oil, which significantly improves the bio-oil quality. At the same time, the reaction mechanism of the co-liquefaction process was investigated, which showed that PP can affect the liquefaction mechanism of D. tertiolecta.The influence of PP is mainly in (1) greatly reducing the acid content in bio-oil, (2) significantly affecting the transformation pathways of carbohydrates to produce more cyclopentenone derivatives and (3) promoting the Maillard reaction between carbohydrates and proteins or their hydrolysates.
Acknowledgements
This study was supported by the National Natural Science Foundation of China (No. 21576155, 21376140 and 21176142), the Research Project of Guangdong Provincial Department of Science and Technology Department (No. 2015B020215004), the Program for Changjiang Scholars and the Innovative Research Team in University (IRT13026) and the Program for New Century Excellent Talents in University (No. NCET-12-0308).References
- A. A. Upadhye, W. Qi and G. W. Huber, AIChE J., 2011, 57, 2292–2301 CrossRef CAS.
- C. C. Zhang, P. G. Duan, Y. P. Xu, B. Wang, F. Wang and L. Zhang, Bioresour. Technol., 2014, 166, 37–44 CrossRef CAS PubMed.
- Y. Chen, Y. L. Wu, P. L. Zhang, D. R. Hua, M. D. Yang, C. Li, Z. Chen and J. Liu, Bioresour. Technol., 2012, 124, 190–198 CrossRef CAS PubMed.
- Y. Guo, Z. Yuanhui, G. Bin, T. Funk and L. Schideman, BioEnergy Res., 2014, 7, 1317–1328 CrossRef.
- S. P. Zou, Y. L. Wu, M. D. Yang, C. Li and J. M. Tong, Bioresour. Technol., 2010, 101, 359–365 CrossRef CAS PubMed.
- M. Negoro, A. Hamasaki, Y. Ikuta, T. Makita, K. Hirayama and S. Suzuki, Appl. Biochem. Biotechnol., 1993, 39, 643–653 CrossRef.
- N. Marin, S. Collura, V. I. Sharypov, N. G. Beregovtsova, S. V. Baryshnikov, B. N. Kutnetzov, V. Cebolla and J. V. Weber, J. Anal. Appl. Pyrolysis, 2002, 65, 41–55 CrossRef CAS.
- B. Han, Y. Chen, Y. L. Wu, D. R. Hua, Z. Chen, W. Feng, M. D. Yang and Q. H. Xie, J. Therm. Anal. Calorim., 2014, 115, 227–235 CrossRef CAS.
- P. Bhattacharya, P. H. Steele, E. B. M. Hassan, B. Mitchell, L. Ingram and C. U. Pittman, Fuel, 2009, 88, 1251–1260 CrossRef CAS.
- E. Jakab, G. Varhegyi and O. Faix, J. Anal. Appl. Pyrolysis, 2000, 56, 273–285 CrossRef CAS.
- M. Brebu, S. Ucar, C. Vasile and J. Yanik, Fuel, 2010, 89, 1911–1918 CrossRef CAS.
- L. Sorum, M. G. Gronli and J. E. Hustad, Fuel, 2001, 80, 1217–1227 CrossRef CAS.
- K. J. Wu, J. Liu, Y. L. Wu, Y. Chen, Q. H. Li, X. Xiao and M. D. Yang, Bioresour. Technol., 2014, 163, 18–25 CrossRef CAS PubMed.
- X. Y. Wu, Y. L. Wu, K. J. Wu, Y. Chen, H. S. Hu and M. D. Yang, Bioresour. Technol., 2015, 192, 522–528 CrossRef CAS PubMed.
- X. K. Pei, X. Z. Yuan, G. M. Zeng, H. J. Huang, J. Y. Wang, H. Li and H. N. Zhu, Fuel Process. Technol., 2012, 93, 35–44 CrossRef CAS.
- P. G. Duan, B. B. Jin, Y. P. Xu and F. Wang, Chem. Eng. J., 2015, 269, 262–271 CrossRef CAS.
- C. Gai, Y. Li, N. N. Peng, A. N. Fan and Z. G. Liu, Bioresour. Technol., 2015, 185, 240–245 CrossRef CAS PubMed.
- C. Gai, Y. H. Zhang, W. T. Chen, P. Zhang and Y. P. Dong, Energy Convers. Manage., 2015, 96, 330–339 CrossRef CAS.
Footnotes |
| † Electronic supplementary information (ESI) available: Supplementary data associated with this article can be found. See DOI: 10.1039/c7ra01030c |
| ‡ Xiuyun Wu and Junmei Liang contributed equally to this work. |
| This journal is © The Royal Society of Chemistry 2017 |

