 Open Access Article
CdTe/CdS quantum dot-labeled fluorescent immunochromatography test strips for rapid detection of Escherichia coli O157:H7
Jinlu Yu†
 a,
Jing Su†c,
Jing Zhangb,
Xuetuan Weib and
Ailing Guo*ab
aNational Research and Development Center for Egg Processing, Huazhong Agricultural University, No. 1, Shizishan Street, Hongshan District, Wuhan 430070, Hubei Province, China. E-mail: 2690307424@qq.com; 593085753@qq.com; 418228848@qq.com; 258090391@qq.com; ailingguo234@163.com; Tel: +8615342241896
bKey Laboratory of Environment Correlative Dietology (Huazhong Agricultural University), Ministry of Education, Wuhan 430070, China
cFood and Drug Administration Center, Anyang 455000, China
First published on 23rd March 2017
Abstract
Immunochromatography test strips have been widely used to detect foodborne pathogens due to their high sensitivity, stability and specificity, and the selection of the label is an important factor. In this study, CdTe/CdS quantum dots with a high fluorescence were synthesized as a fluorescence label to conjugate with antibodies to prepare an immunochromatography test strip for the detection of Escherichia coli O157:H7 (E. coli O157:H7). Antibody-quantum dot conjugation was coated onto a glass fiber membrane, which played the role of the conjugate pad. E. coli O157:H7 polyclonal antibodies and goat anti-rabbit immunoglobulin G (Ig G) were used to create the test line and the control line, respectively. The detection limit was determined as 104 CFU mL−1 and no cross-reactions were discovered with other Escherichia coli and other strains. In addition, the strips detected effectively after storing at room temperature in the dark for 35 d. The detection was easy to perform, rapidly and sensitively, and the total detection time was less than 12 min to obtain accurate results, and this method has the potential to be a powerful tool to detect bacteria quantitatively.
Introduction
Escherichia coli O157:H7 (E. coli O157:H7) is a serious foodborne pathogen that can result in paroxysmal and life-threatening diseases, such as acute bloody diarrhea, abdominal spasm, and hemorrhagic enteritis.1 This pathogen, since first discovered in the stools of infected people in Oregon and Michigan in 1982, is responsible for many outbreaks, cases and deaths around the world.2 Considering the thoroughly imperfect therapeutic measures and the limit of valid vaccines, as well as no internationally accepted method, the most probable number (MPN), which is labor-intensive and often requires 3–4 days to obtain confirmed results, rapid, simple and sensitive methods are urgently needed to protect public from infection. In recent years, many methods have been established for detecting E. coli O157:H7, such as enzyme-linked immunosorbent assay (ELISA), gene chip, polymerase chain reaction (PCR) and biosensor techniques.3,4 Although these methods make it possible to gain a rapid and sensitive analysis, the cost of expensive reagents and instruments in some ways limits out-of laboratory applications for fast screening.Quantum dots (QDs), known as semiconductor nanocrystals, possess unique luminescence and photo-physical properties, including broadband excitation, narrow and tunable emission spectra, high fluorescence and stability.5 Furthermore, it has been testified that the photoluminescence properties of core/shell QDs are better than those of the bare core ones because of the presence of a shell, which reduces surface defects and renders protection to the core from photo-initiated degradation.6 Recently, a huge research interest in QDs has been garnered in biological and biomedical fields as cell imaging and biological labeling to detect the influenza virus,7 cancer cells,8 heart attacks,9 organophosphate pesticides,10,11 mycotoxins12 and polyphenols.13 Although the applications of QDs have made great progress, less attention and effort are concentrated on the determination of pathogenic microorganisms.
Immunochromatography test strips have been widely used to detect pathogenic microorganisms and toxic contaminants in food and drinks, because the technique is simple, rapid, sensitive, and has no requirements for special reagents and instruments, ideally suitable for one-site testing by untrained personnel. The results can be judged by the naked eye and readily preserved. A colloidal gold-labeled test strip is regarded publicly as the most frequently-used for the quick diagnosis of infectious diseases and fast examination of biological antiterrorism with a detection limit (LOD) of 105–106 CFU mL−1, but sensitivity sometimes is seriously limited.14,15
In our study, CdTe/CdS QDs were synthesized as the fluorescence label to conjugate with polyclonal antibodies to prepare immunochromatography test strips for the quantitative detection of E. coli O157:H7, taking advantage of the specificity and sensitivity of antigen-antibody reactions and the accuracy of optics. The detection limit was 104 CFU mL−1. Besides, to assess the effectiveness of the test strip, we used the strips to detect milk samples with different concentrations of E. coli O157:H7. The detection was performed easily and rapidly within 12 min. The strips showed good specificity and stability at room temperature in the dark.
Experimental
Materials and reagents
The microorganisms used in this study were E. coli O157:H7 (ATCC 51659), Candida albicans (ATCC 90028), Staphylococcus aureus (ATCC 25923), Vibrio parahaemolyticus (ATCC 17802), Listeria monocytogenes (ATCC 15313), Enterobacter sakazakii (ATCC 51329), Enterobacter aerogenes (CMCC 45103), Proteus mirabilis (CMCC 49005), Salmonella paratyphi A (ATCC 50001), Shigella boydii (ATCC 51315), E. coli (ATCC 25922), E. coli (ATCC 35218), and E. coli (ATCC 8099). All the strains and colloidal gold-labeled test strips (Romer Labs Inc. Newark. DE. USA) were provided by the Center for Disease Control and Prevention of HuBei. In the preparation of the antigens, these strains were heat-inactivated for 2 h in boiling water, then centrifuged under 10![[thin space (1/6-em)]](https://www.rsc.org/images/entities/char_2009.gif) 000 rpm, 5 min for three times, washed with sterile saline and stored at −20 °C with an adjusted concentration of 109 CFU mL−1. New Zealand female rabbits were also supplied by the Center for Disease Control and Prevention of HuBei with an average weight 2.5 kg. The total amount of rabbit diets was 150 g twice a day and enough pure water was provided. Common reagents and solvents were of analytical grade, and mostly obtained from Sinopharm Chemical Reagent Co., Ltd (Shanghai, China).
000 rpm, 5 min for three times, washed with sterile saline and stored at −20 °C with an adjusted concentration of 109 CFU mL−1. New Zealand female rabbits were also supplied by the Center for Disease Control and Prevention of HuBei with an average weight 2.5 kg. The total amount of rabbit diets was 150 g twice a day and enough pure water was provided. Common reagents and solvents were of analytical grade, and mostly obtained from Sinopharm Chemical Reagent Co., Ltd (Shanghai, China).
Preparation of water-soluble CdTe/CdS QDs
CdTe/CdS QDs was synthesized via an aqueous phase synthesis method with some modification.16 Briefly, 100 mg of sodium borohydride and 63.8 mg of tellurium powder were rapidly added in reaction bulbs with 3 mL of high purity water at 40 °C with magnetic stirring until the solutions turned to purple with a white sediment, which indicated the sodium hydrogen telluride precursor was successfully prepared. Cadmium chloride (91.34 mg) was dissolved in high purity water (100.0 mL) in a round bottom flask with four necks, with mercaptopropionic acid (MPA, 104 μL) as stabilizer and then adjusting the pH value to 10. After aerating with nitrogen for 30 min, sodium hydrogen telluride (0.6 mL) was added and heated at 95 °C for 1 h. Then thioacetamide (1 mL, 0.05 M) was added slowly and reaction was continued at 95 °C for 1 h, and so CdTe/CdS QDs were prepared.Preparation of E. coli O157:H7 polyclonal antibodies
The E. coli O157:H7 polyclonal antibodies were prepared by our own laboratory. We injected heat-inactivated E. coli O157:H7, namely antigens, into the New Zealand female rabbits through multiple-site subcutaneous injection. The initial immune dose was 107 CFU mL−1 (1 mL), changed to 108 CFU mL−1 (1 mL) in the following immunization. The interval of immunization was 2 weeks for 6 times. The titer of antibodies was 1![[thin space (1/6-em)]](https://www.rsc.org/images/entities/char_2009.gif) :
:![[thin space (1/6-em)]](https://www.rsc.org/images/entities/char_2009.gif) 25
25![[thin space (1/6-em)]](https://www.rsc.org/images/entities/char_2009.gif) 600 through ELISA. The molecular weight of the final purified antibodies was 152 kDa by sodium dodecyl sulfate polyacrylamide gel electrophoresis. All the animal work was carried out in strict compliance with the guidelines of the China Experimental Animal Welfare Ethics Committee, and the Scientific Ethics Committee for experimental animals at Huazhong Agricultural University approved all the studies.
600 through ELISA. The molecular weight of the final purified antibodies was 152 kDa by sodium dodecyl sulfate polyacrylamide gel electrophoresis. All the animal work was carried out in strict compliance with the guidelines of the China Experimental Animal Welfare Ethics Committee, and the Scientific Ethics Committee for experimental animals at Huazhong Agricultural University approved all the studies.
Conjugation of QDs with antibodies
A modified amino acid-thiol covalent method was adopted to conjugate QDs with the antibodies.17 100 μL of purified CdTe/CdS QDs were mixed with 700 μL of reconstituted fluid (40 μL 0.1 M 1-ethyl-(3-dimethyl aminopropyl) carbodiimide hydrochloride, 20 μL 0.1 M N-hydroxysuccinimide and 640 μL, pH 7.4, 0.01 M phosphate buffer). Subsequently, antibodies (100 μL, 1 mg mL−1) were added at 37 °C in the dark. After shaking for 2 h, glycine (100 μL) was added to terminate the reactions. Then uncoupled QDs were removed through 100 kDa ultra-filtrated membranes and the precipitates were stored in 0.01 M phosphate buffer (pH 7.4) at 4 °C in the dark.Fabrication of fluorescent test strips
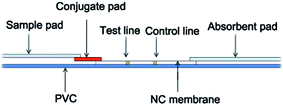
The test strip included a sample pad, conjugate pad, nitrocellulose membrane (NC membrane), absorbent pad, and polyvinyl chloride (PVC), schematically shown in Fig. 1. Among these components, a glass fiber membrane (0.6 cm × 0.7 cm) was used as conjugate pad with 1 mL QD-antibody conjugations. E. coli O157:H7 polyclonal antibodies (1 μL) and goat anti-rabbit Ig G (1 μL) were dotted onto the NC membrane (0.6 cm × 3.5 cm) as the test line (T line) and control line (C line), respectively, with 1 cm distance kept between two lines. No treatments were required for both the sample pad (0.6 cm × 2.9 cm) and the absorbent pad (0.6 cm × 3.2 cm). During the assembly, a 2 mm overlapped was used to ensure the performance of immunochromatography.Results and discussion
Fluorescence of water-soluble CdTe/CdS QDs
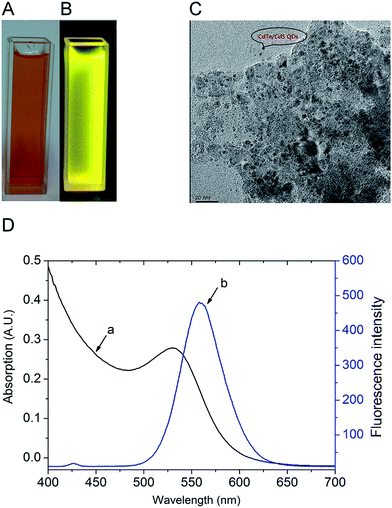
As shown in Fig. 2A and B, CdTe/CdS QDs gave a clearly orange and yellow fluorescence under the visible and ultraviolet light (UV light), respectively. Fig. 2C presents the transmission electron microscope image of CdTe/CdS QDs, the average diameter was about 3 nm and the QDs were spherical particles with an even dispersion. Ultraviolet-visible (UV-vis) absorption and fluorescence emission spectra of the QDs were recorded at room temperature with a Shimadzu UV-1077 ultraviolet spectrometer (scanning wavelength was from 300 to 800 nm) and a Shimadzu RF-5301pc fluorescence spectrometer (scanning range: 400–800 nm, excitation wavelength: 370 nm), respectively. Fig. 2D shows the UV-vis absorption (curve a) and fluorescence emission spectra (curve b) of the QDs. It was concluded that the optical absorption had a feature at 530 nm and the narrow and symmetric emission peak was at 556 nm. Furthermore, from the fluorescence emission spectra, the full width at half-maximum was about 50 nm, indicating that during the growth of the QDs, the electronic defect sites had been mostly reduced.Bio-activity of antibodies after conjugation
A dot blotting assay was carried to evaluate the bio-activity of antibodies after conjugating with the QDs. The bio-activity was defined as the fluorescence on the NC membrane under UV light and the intensity was related to the concentration of heat-inactivated E. coli O157:H7; phosphate buffer (pH 7.4) was used as negative control. Fig. 3 demonstrated that the bio-activity of the antibodies remained after coupling with the QDs and the fluorescence intensity weakened as the concentration of heat-inactivated E. coli O157:H7 decreased. | ||
| Fig. 3 Photo of dot blots for detecting the bio-activity of antibodies under UV light. Phosphate buffer was selected as the blank control. | ||
Properties of fluorescent test strips
The detection limit, specificity and stability of the fluorescent test strips were tested for three times to characterize the prepared fluorescent test strips. The positive result was that the control lines and test lines showed yellow-green fluorescence and a negative result was that only the control line showed fluorescence. If no fluorescence was emitted at the control line and test line or only at the test line, this indicated that the prepared test strips were useless.Detection limit (LOD) of strips
In order to determine the detection limit (LOD) of strips, different concentrations of the heat-inactivated E. coli O157:H7 (109 CFU mL−1, 108 CFU mL−1, 107 CFU mL−1, 106 CFU mL−1, 105 CFU mL−1, 104 CFU mL−1, 103 CFU mL−1 and 102 CFU mL−1) were dropped onto the sample pad to perform the chromatography reactions. Sample solutions would transfer to the conjugate pad due to capillary action and the immunoreactions would complete on the test line (Fig. 1B). As shown in Fig. 4, the visual LOD of the strips was 104 CFU mL−1; compared with conventional colloidal gold-labeled test strips, the visual LOD was 10–100 times lower (105–106 CFU mL−1).14,15 In recent years, some development of gold-labeled test strips has been reported, such as Zhang et al.18 demonstrated a kind of hierarchical tipped flowerlike gold nanoparticles to label immunochromatography test strips to detect E. coli O157:H7 with a visual LOD of 104–106 CFU mL−1 at different sizes. Cui et al.19 also reported that the LOD could be highly improved via optimizing the size and uniformity of gold nanoparticles with a bioassay reader. Wang et al.20 studied LOD improvement by adding enhancers and the LOD was 5 × 10³ CFU mL−1 by a strip reader, but whether the addition of enhancers had some influence on the stability of the strips is unknown and the detection time was 20 min, which is quite long. Besides, for other test strips, such as immunomagnetic bead-labeled and fluorescent microsphere-labeled ones, to our knowledge, the LOD of test strips based on immunomagnetic beads to detect E. coli O157:H7 was about 105 CFU mL−1;21 moreover, immunomagnetic beads required conjugated antibodies with a high affinity while QDs could couple with a variety of molecules, such as proteins and streptavidin, as well as antibodies, easily after some chemical modifications due to its good biocompatibility. Fluorescent microspheres are a kind of solid particle that fluorescent materials, such as QDs, are covered by polymeric substances which emit fluorescence when stimulated by external energies, and the LOD of E. coli O157:H7 was 104 CFU mL−1.14 In our study, the LOD of test strips based on only QDs was also up to 104 CFU mL−1. So, we thought the sensitivity of our test strips was ideal to apply to the detection E. coli O157:H7 in real lives. | ||
| Fig. 4 Detection limit of fluorescence test strips for E. coli O157:H7 (1 × 10² to 1 × 10⁹ CFU mL−1). | ||
Specificity of strips
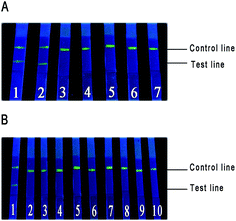
We studied the specificity of strips by using isolated strains of E. coli O157:H7, as well as other E. coli (E. coli ATCC 25922, E. coli ATCC 35218 and E. coli ATCC 8099) with 108 CFU mL−1. The results were shown in Fig. 5A; except for E. coli O157:H7 and its isolated strains, no response was found for other E. coli, which meant that the strips were unable to determine other E. coli. Then, we continued to choose another nine standard strains to evaluate the cross-reactivity. Only the strip that detected E. coli O157:H7 exhibited fluorescence in the test line (Fig. 5B), which further proved that the strips had a high specificity in our study.Stability of strips
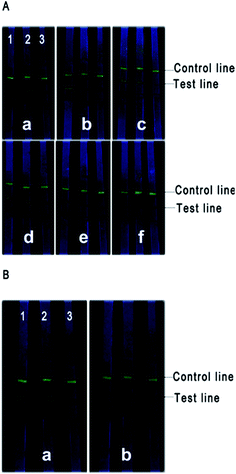
The stability of test strips was determined to detect different concentrations of heat-inactivated E. coli O157:H7 (106 CFU mL−1, 105 CFU mL−1 and 104 CFU mL−1) after storing for 0 d, 7 d, 14 d, 21 d, 28 d and 35 d. The results were shown in Fig. 6A. The strips, after storing for 35 d, were still able to realize detection. However, the fluorescence of the strips that detected 104 CFU mL−1 E. coli O157:H7 became faint after storing for 21 d and completely disappeared in the subsequent week. Furthermore, we happened to determine that the used strips had no changes after storing for 20 d at room temperature in the dark for reviewing at a certain time (Fig. 6B).Detection of E. coli O157:H7 in real samples
To evaluate the potential application of our test strips, cultured E. coli O157:H7 were inoculated in milk with concentrations of 0 CFU mL−1, 103 CFU mL−1, 104 CFU mL−1, 105 CFU mL−1 and 106 CFU mL−1. Every concentration corresponded to three samples. The samples were detected by our CdTe/CdS QD-labeled test strips and colloidal gold-labeled test strips (Romer Labs Inc. Newark. DE. USA), respectively. The results were shown in Fig. 7; when the concentration of E. coli O157:H7 was 104 CFU mL−1, there were no red line in the test line of the colloidal gold-labeled test strips while weak fluorescence could be observed in the test line of QD-labeled test strips, which further determined the results of the LOD test.Conclusions
Immunochromatographic test strips labeled by nanoparticles have been applied widely in many fields to meet the requirements of simplicity, sensitivity and rapidity, especially for those localities lacking instruments and technical detectors. In this work, we developed core/shell QDs with a high fluorescence as a novel label to conjugate with E. coli O157:H7 polyclonal antibodies to rapidly detect E. coli O157:H7. The visual LOD of the strips was 104 CFU mL−1. Furthermore, the strips could be placed at room temperature in the dark for 35 d. The whole detection time was less than 12 min and this method would be a useful and novel protocol for performing immunoassays.Acknowledgements
This research is supported by the Special Fund for Agro-scientific Research in the Public Interest (Program No. 201303084).References
- S. M. Chekabab, V. J. Paquin, C. M. Dozois and J. Harel, FEMS Microbiol. Lett., 2013, 341, 1–12 CrossRef CAS PubMed.
- H. Pennington, Lancet, 2010, 376, 1428–1435 CrossRef CAS.
- Y. Li, R. Afrasiabi, F. Fathi, N. Wang, C. Xiang, R. Love, Z. She and H. B. Kraatz, Biosens. Bioelectron., 2014, 58, 193–199 CrossRef CAS PubMed.
- Y. H. Lin, S. H. Chen, Y. C. Chuang, Y. C. Lu, T. Y. Shen, C. A. Chang and C. S. Lin, Biosens. Bioelectron., 2008, 23, 1832–1837 CrossRef CAS PubMed.
- Q. Ma, Y. Nakane, Y. Mori, M. Hasegawa, Y. Yoshioka, T. M. Watanabe, K. Gonda, N. Ohuchi and T. Jin, Biomaterials, 2012, 33, 8486–8494 CrossRef CAS PubMed.
- X. Fu, K. Huang and S. Liu, J. Microbiol. Methods, 2009, 79, 367–370 CrossRef CAS PubMed.
- O. Adegoke, T. Kato and E. Y. Park, Biosens. Bioelectron., 2016, 80, 483–490 CrossRef CAS PubMed.
- Q. Wu, L. Chen, L. Huang, J. Wang, J. Liu, C. Hu and H. Han, Biosens. Bioelectron., 2015, 74, 16–23 CrossRef CAS PubMed.
- D. Bhatnagar, V. Kumar, A. Kumar and I. Kaur, Biosens. Bioelectron., 2016, 79, 495–499 CrossRef CAS PubMed.
- H. Liang, D. Song and J. Gong, Biosens. Bioelectron., 2014, 53, 363–369 CrossRef CAS PubMed.
- X. Yan, H. Li, X. Han and X. Su, Biosens. Bioelectron., 2015, 74, 277–283 CrossRef CAS PubMed.
- V. V. Goftman, T. Aubert, D. V. Ginste, R. D. Van, N. V. Beloglazova, Z. Hens, S. S. De and I. Y. Goryacheva, Biosens. Bioelectron., 2016, 79, 476–481 CrossRef CAS PubMed.
- U. S. Akshath, L. R. Shubha, P. Bhatt and M. S. Thakur, Biosens. Bioelectron., 2014, 57, 317–323 CrossRef CAS PubMed.
- Q. Y. Xie, Y. H. Wu, Q. R. Xiong, H. Y. Xu, Y. H. Xiong, K. Liu, Y. Jin and W. H. Lai, Biosens. Bioelectron., 2014, 54, 262–265 CrossRef CAS PubMed.
- Y. Ju, H. J. Hao, G. H. Xiong, H. R. Geng, Y. L. Zheng, J. Wang, Y. Cao, Y. H. Yang, X. H. Cai and Y. Jiang, Vet. Immunol. Immunopathol., 2010, 133, 207–211 CrossRef CAS PubMed.
- Y. L. Yu, L. R. Xu, J. Chen, H. Y. Gao, S. Wang, J. Fang and S. K. Xu, Colloids Surf., B, 2012, 95, 247–253 CrossRef CAS PubMed.
- C. Shi, X. Y. Huang, C. Q. Dong, H. J. Chen and J. C. Ren, Chin. Chem. Lett., 2009, 20, 1119–1122 CrossRef CAS.
- L. Zhang, Y. J. Huang, J. Y. Wang, Y. Rong, W. H. Lai, J. W. Zhang and T. Chen, Langmuir, 2015, 31, 5537–5544 CrossRef CAS PubMed.
- X. Cui, Y. J. Huang, J. Y. Wang, L. Zhang, Y. Rong, W. H. Lai and T. Chen, RSC Adv., 2015, 5, 45092–45097 RSC.
- J. Y. Wang, M. H. Chen, Z. C. Sheng, D. F. Liu, S. S. Wua and W. H. Lai, RSC Adv., 2015, 5, 62300–62305 RSC.
- H. Qi, Z. Zhong, H. X. Zhou, C. Y. Deng, H. Zhu, J. F. Li, X. L. Wang and F. R. Li, Int. J. Nanomed., 2011, 6, 3033–3039 CAS.
Footnote |
| † Jinlu Yu and Jing Su equally contributed to this study. |
| This journal is © The Royal Society of Chemistry 2017 |


