
 Open Access Article
 This Open Access Article is licensed under a Creative Commons Attribution-Non Commercial 3.0 Unported Licence
Synthesis and magnetic properties of nanostructured metallic Co, Mn and Ni oxide materials obtained from solid-state metal-macromolecular complex precursors†
C. Díaz*a,
M. L. Valenzuelab,
M. A. Laguna-Bercero *c,
A. Orerac,
D. Bobadillaa,
S. Abarcaa and
O. Peñad
*c,
A. Orerac,
D. Bobadillaa,
S. Abarcaa and
O. Peñad
aDepartamento de Química, Facultad de Química, Universidad de Chile, Las Palmeras 3425, Ñunoa, Casilla 653, Santiago de Chile, Chile. E-mail: cdiaz@uchile.cl
bUniversidad Autónoma de Chile, Instituto de Ciencias Químicas Aplicadas, Inorganic Chemistry and Molecular Material Center, Av. El Llano Subercaseaux 2801, San Miguel, Santiago de Chile, Chile
cInstituto de Ciencia de Materiales de Aragón (ICMA), CSIC – Universidad de Zaragoza, C/Pedro Cerbuna 12, E-50009, Zaragoza, Spain. E-mail: malaguna@unizar.es
dSciences Chimiques de Rennes, UMR-CNRS 6226, Université de Rennes 1, 35042 Rennes Cedex, France
First published on 24th May 2017
Abstract
The simple reaction of chitosan with metallic salts yields (chitosan) (MLn)x, MLn = MnCl2, CoCl2, NiCl2, macromolecular complexes which, after a thermal treatment at 800 °C under air, give nanostructured Mn2O3, Co3O4 and NiO. The polymer acts as a template in the solid state, which is eliminated after the combustion process. At an intermediate stage, a layered graphitic carbon matrix was observed by HRTEM over the grown metal oxides. A mechanism for the growth of nanostructured oxides is discussed, including Raman studies. The nanostructured Mn2O3, Co3O4 and NiO particles grow over graphite layers and the solid-state role of chitosan is crucial for the formation of this graphite substrate. An antiferromagnetic transition was observed in Co3O4 nanoparticles, with TN = 38 K, whereas NiO nanoparticles behave as a superparamagnetic material with a blocking temperature above 300 K.
1. Introduction
Metal oxide nanoparticles are important for their wide use in modern science and technology.1–5 The development and innovation of new synthetic strategies for high-quality size- and shape-controlled metal oxide nanostructures are among the most important topics at the Frontier of scientific research. Also important is the development of new and reliable methods for the incorporation of the as-synthesized metal oxide nanoparticles into solid-state devices. The majority of the methods used for the preparation of metal oxide nanoparticles are solution-based.6–9 Although a solid-state method may allow the incorporation of nanoparticles to a solid-state device more easily (in a one-step process), few solid-state methods to produce metal oxide nanostructures have been reported.10,11 The reason for developing solid-state methods to prepare nanoparticles stems mainly from their possible application in solid-state materials and powder-oriented applications, such as thin film metal deposition of noble metal nanoparticle-carbon catalysts, oxide growth, photonic and dielectric materials, or new materials for Li-ion rechargeable batteries.12,13 The ability to rationally prepare metallic and metal oxide nanoparticles stems from the exploration of methods for alternative nanoscale metal deposition in solid-state nanoelectronics and nanotechnology.14–16 Furthermore, the production of metal nanoparticles from solutions by evaporation of the solvent often leads to 3D network materials where the nanostructured property is lost.17–19 Thus, the development of new solid-state methods to obtain metal oxide nanoparticles is a continuing challenge.In the present work, we show how the chitosan polymer can be used as a solid-state template for the formation of metal oxides in the field of nanoscience with potential application in photonics, sensing, electrochromics, and environmental applications including photoelectrolysis of water and catalytic applications. According to previously reported solid-state methods using polymers as “templates“, the probable mechanism operative in this method could be:
(i) The chitosan allows an orderly and uniform distribution of the metal centers through the polymeric chain.
(ii) The organic matter between the metal centers is removed as CO2 and H2O after the pyrolysis process, creating holes which nucleate the metal centers, subsequently forming nanoparticles.20
(iii) At intermediate temperatures of the pyrolysis process, a graphite surface is formed from the organic polymer which acts as a solid-state template where the nanoparticles begin to grow.20
(iv) By comparison, pyrolysis of the metallic salts without the polymer present usually yields big agglomerated particles.21,22 In this paper, we present the preparation of Mn2O3, Co2O3 and NiO nanoparticles from coordination metal-polymer complexes which grow over graphite.
Chitin is the second most abundant natural polymer after cellulose, being extracted mainly from shrimp and krill.23–25 Chitosan is derived from chitin by deacetylation with strong alkali. Its structure has been determined from molecular and crystal structure characterization of both the hydrated as well as dehydrated forms.26 Chitosan is a biodegradable, biocompatible and non-toxic polysaccharide that, owing to its interesting properties, has received considerable attention for environmental, agricultural and biomedical applications.27–29 One of the most interesting properties is its high capacity to form metal macromolecular complexes and its high efficiency for metal uptake from aqueous solutions.30–32 Chitosan metal complexes can be described in the so-called bridge model (I) by two or more amino groups.33 According to this bridge model, intra- or inter-molecular complexation may occur between the metal ion and amine and hydroxyl groups from the same or different chain models. Model (II) – the pendant model – involves only one amine or hydroxyl group as pendant group. In spite of these two models, the structure of macromolecular metal complexes is not yet known.34,35 Some IR35,36 studies support coordination model (I), and other X-ray33 studies support model (II). We present herein the preparation of the macromolecular metal complexes (chitosan) (MLn)x, MLn = MnCl2, CoCl2, NiCl2, and their thermal conversion to nanostructured Mn2O3, Co3O4 and NiO by annealing treatment at 800 °C under air.37 In this process the chitosan acts as a “solid-state” template which is subsequently eliminated by the combustion of the organic matter. Several examples of the use of chitosan as stabilizer of metallic nanoparticles in solution have been reported,34,38–45 but not its use as a “solid-state” template.37
2. Experimental
2.1 Materials and common procedures
MnCl2·2H2O, CoCl2·6H2O and NiCl2·6H2O, from Aldrich, were used as received. Chitosan (Aldrich) of low molecular weight was also used as received. An estimation of the molecular weight (MW) was obtained by viscosity measurements following the Mark–Houwink equation. Using parameters [h] previously reported by Brugnerotto et al.39 and an aqueous solution of acetic acid, NaCl and urea as a solvent, a value of MW = 61![[thin space (1/6-em)]](https://www.rsc.org/images/entities/char_2009.gif) 000 was estimated. All the reactions were performed in CH2Cl2 as solvent.
000 was estimated. All the reactions were performed in CH2Cl2 as solvent.
2.2 Synthesis of the precursors
Mn2O3, Co3O4 and NiO nanocrystals were synthesized by a two-step solution-solid method according to our previous work.37 During the preparation of these transition metal (TM) oxides, two reactions occur: (i) the formation of the macromolecular complex, (chitosan)TMClx, through a simple substitution coordination process and (ii) a solid-state combustion (under air) reaction of the (chitosan)TMClx complex to give the metal oxide, CO2 and H2O. Following a typical synthesis route, the metallic salt was added in a Schlenk tube over the CH2Cl2 solvent under magnetic stirring, followed by the addition of the appropriate chitosan amount according to a 1:1 molar ratio. Reaction time and additional details for each metallic salt reaction are given in Table 1 of S1 ESI.† After this, the supernatant solution (if the solid decanted) was extracted with a syringe and the solid was dried under reduced pressure to give a solid with diverse colors (see Table 1 and Fig. 2 of ESI S2†). Due to their insolubility, the characterization of the precursors was performed only by elemental analysis, IR spectroscopy and TG/DSC analysis. Coordination was confirmed by the behavior of the broad ν(OH) in chitosan, which becomes unfolded upon coordination, a new band appearing around 3100 cm−1. Approximate metal content was estimated from the elemental analysis as well as from the TG analysis.
2.3 Pyrolysis of the precursors
The pyrolysis of the precursors was carried out by pouring small portions (0.05–0.15 g) into alumina boats that were placed in a furnace (Daihan oven model Wise Therm FHP-12) under a flow of air. Heating temperatures were limited to 200 °C in a first step, and then to 800 °C, followed by a 2–4 h annealing in each case. The heating rate was consistently maintained at 10 °C min−1 for all the experiments.2.4 Characterization of the pyrolytic products
Solid samples obtained from the pyrolysis process were characterized by powder X-ray diffraction (XRD), scanning electron microscopy (SEM), transmission electron microscopy (TEM), high resolution transmission electron microscopy (HRTEM), Fourier transform infra-red (FTIR) spectroscopy, and thermogravimetric (TG) and differential scanning calorimetric (DSC) analyses. SEM images were acquired with a Philips EM 300 scanning electron microscope. Energy dispersive X-ray analysis (EDS) was performed with a NORAN Instrument micro-probe attached to a JEOL 5410 scanning electron microscope. TEM data were acquired using a JEOL SX100 and a JEOL 2011 transmission electron microscope. HRTEM observations were performed using a JEOL 2000FX microscope at 200 kV. TEM samples were prepared by dispersing pyrolyzed material onto copper grids and dried at room temperature. For high-resolution examination of graphitic carbons, flakes of sonicated carbons were dispersed on grids and examined using SEM to determine their thickness. XRD was conducted at room temperature using a Siemens D-5000 diffractometer with θ–2θ geometry. XRD data were collected using Cu-Kα radiation (40 kV, 30 mA). FTIR measurements were performed with a PerkinElmer FTIR spectrophotometer (model Spectrum BXII). Magnetic properties were recorded as a function of temperature (2 ≤ T ≤ 300 K) and field (0 ≤ H ≤ 5 T) using an MPMS-XL5 magnetometer from Quantum Design equipped with a SQUID detector. Powder samples were placed inside a gelatin capsule whose diamagnetic contribution was acquired under the same experimental conditions used to measure the nanostructured materials. Raman dispersion measurements were performed using a DILOR XY spectrometer with a CCD detector and at a spectral resolution of 1.4 cm−1. The 514.53 nm line of an Ar+ ion laser was used as the excitation source, and the scattered light was collected through a ×50 microscope objective lens. The output power of the laser was kept to 15 mW in order to avoid significant local heating of the sample.3. Results and discussion
3.1 Preparation of the macromolecular precursors
The direct reaction of the metallic salts MnCl2, CoCl2 and NiCl2 with chitosan in CH2Cl2 as solvent yields very stable solids where the coordination of the metal ion to the polymer gives rise to different colors (see Table S1, ESI and Fig. S2, ESI†). For instance, white color was observed for (chitosan) (MnCl2)x, blue for (chitosan) (CoCl2)x and green for (chitosan) (NiCl2)x precursors (see Fig. S2, ESI†). The reaction occurs in a partially soluble chitosan//insoluble metallic salt phase, and thus the equilibrium reaction slowly moves toward the formation of the respective product. Due to this, the reactions are slow and take about 2 weeks. The case of the (chitosan) (CoCl2)x precursor is interesting, since the initially pink color of the starting hydrated CoCl2·6H2O salt changes on coordination to blue, indicating a loss of the hydration water molecules and concomitant coordination to the polymeric chain (see Fig. S2, ESI†). Metal content of the precursors, estimated from elemental analysis as well as from the TG curve analysis, varies from 45% to 92% (see Table S3, ESI†). The estimated degree of coordination from both characterization techniques is, in general, in good agreement. On the other hand, the broad ν(OH) + ν(NH) observed at 3448 cm−1 for free chitosan becomes unfolded upon coordination, shifting in the range of 3345–3393 cm−1 for the macromolecular complexes37,39 (see Table S4, ESI†).3.2 Nanostructured metal oxides
Nanostructured Mn2O3, Co3O4 and NiO are obtained by the pyrolysis of the macromolecular metal complexes (chitosan) (MnCl2)x (I) (chitosan) (CoCl2)x (II) and (chitosan) (NiCl2)x (III), respectively. The XRD patterns of the as obtained metal oxides are displayed in Fig. A–C in S5, ESI.† All the diffraction peaks can be indexed as cubic Mn2O3 (201-071-0636),46,47 cubic Co3O4 (00-043-1003)48 and cubic NiO (00-047-1049),49 respectively.SEM images of the as-obtained Mn2O3 are shown in Fig. 1. The morphology can be viewed as a set of arrangements of deformed and sometimes fused together cubohedral shapes. Consistent with this observation, TEM images show the presence of agglomerates of primary particles (see Fig. 2a) and HRTEM images (Fig. 2b and c) confirm that Mn2O3 nanoparticles present typical particle size ranging from 10 to 50 nm. The measured spacing corresponds to the inter-plane distance (200) of cubic α-Mn2O3 (Fig. 2c). On the other hand, SAED (selected area electron diffraction) shows the pattern of two Mn2O3 particles along the [211] direction (see Fig. 2d). In addition, Fig. 2f confirmed the presence of graphite adjacent to a Mn2O3 particle (Fig. 2e), even after the calcination process, possibly avoiding nanoparticle agglomeration during growth. This formation behavior has been previously observed for Mn2P2O7 from pyrolysis of the precursor {NP(OC8H12)2(OC6H4PPh2-Mn(CO)2(η5-C5H4Me))2}n.20 It was evidenced by different experimental techniques that carbon forms and subsequently graphitizes, with the formation and eventual elimination of C–O, C![[double bond, length as m-dash]](https://www.rsc.org/images/entities/char_e001.gif) O, and other chemical groups. Subsequently, this carbon converts to a thermally conductive polycrystalline graphite matrix in which individual crystals can be formed. The graphitic matrix essentially acts as a solid-state template to form a one-step composite, and its thermal conductivity could prevent phase sublimation.
O, and other chemical groups. Subsequently, this carbon converts to a thermally conductive polycrystalline graphite matrix in which individual crystals can be formed. The graphitic matrix essentially acts as a solid-state template to form a one-step composite, and its thermal conductivity could prevent phase sublimation.
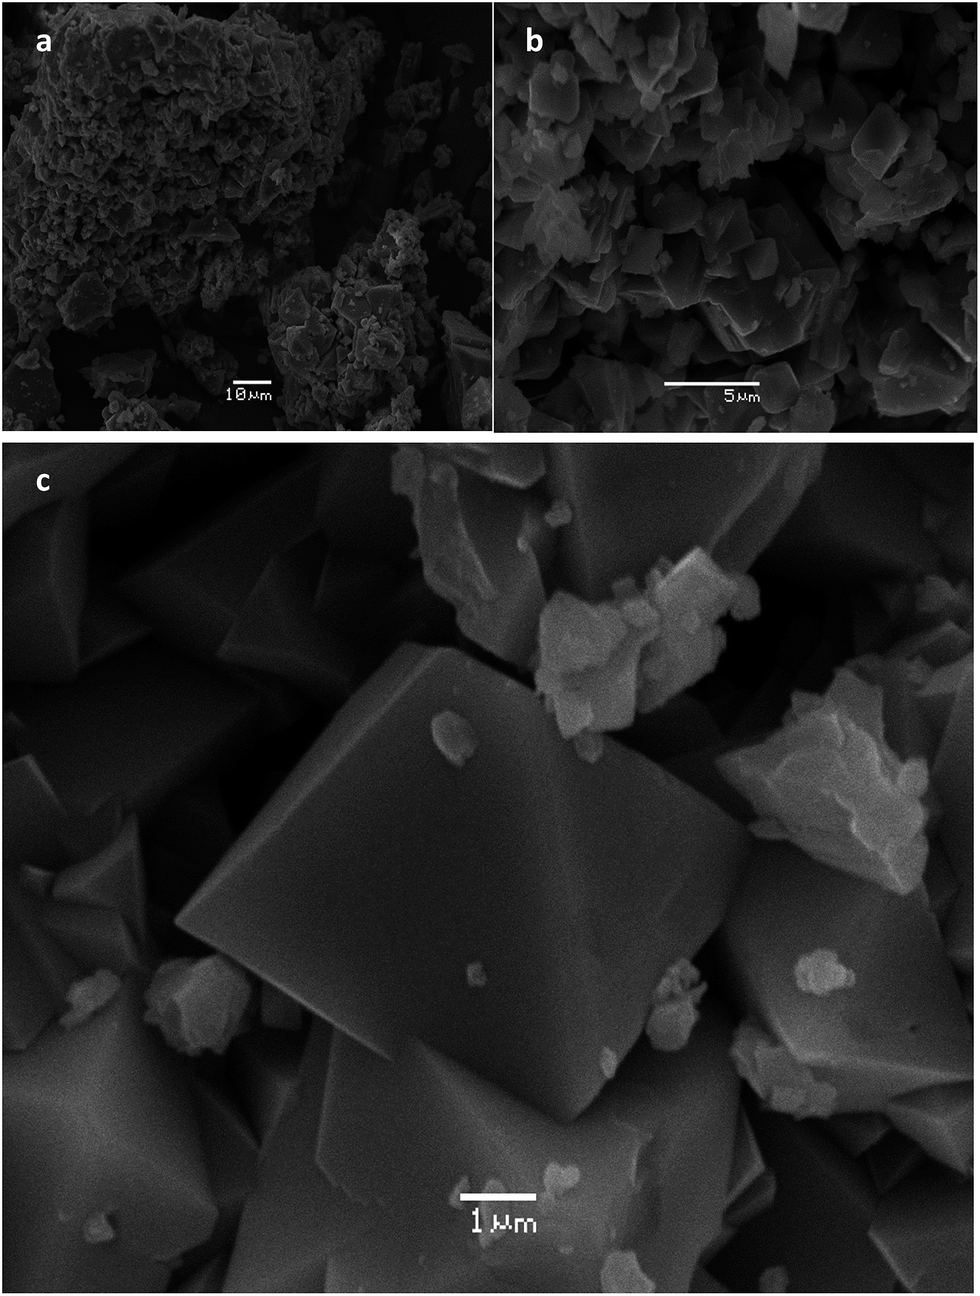 | ||
| Fig. 1 Mn2O3 particles as observed by (a) 10 μm, (b) 5 μm and (c) 1 μm SEM analysis. | ||
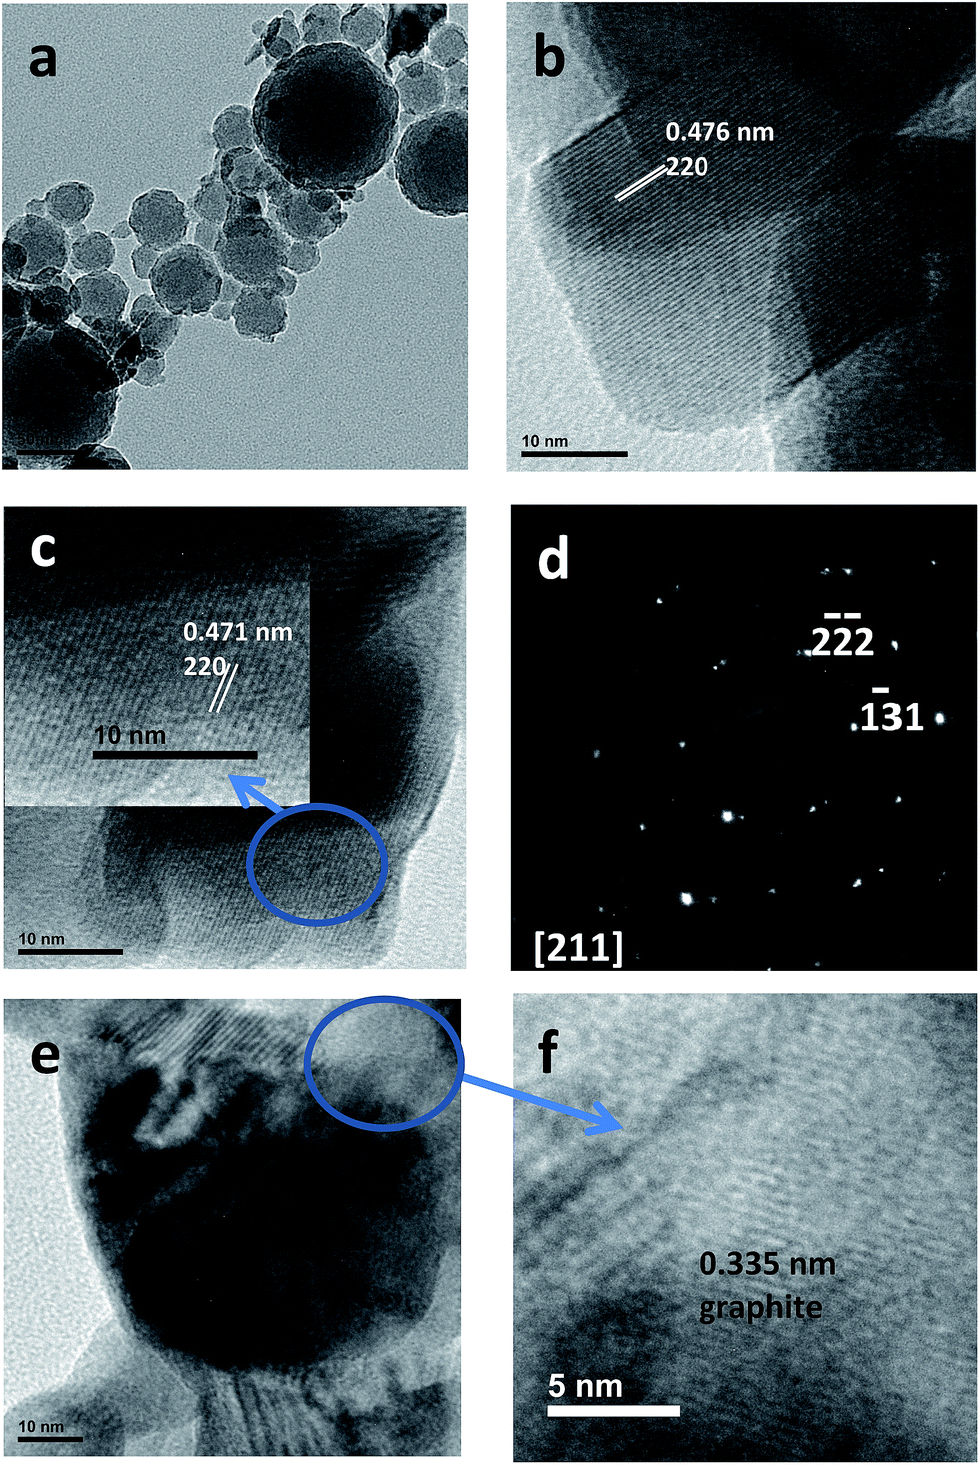 | ||
| Fig. 2 TEM images of Mn2O3 nanoparticles: (a) agglomerates; (b and c) individual nanoparticles; (d) SAED pattern; (e and f) Mn2O3 particle surrounded by graphite. | ||
Although nanostructured Mn2O3 has been obtained using solution methods and solution thermal procedures,46,47 to our knowledge this is the first successful example of Mn2O3 nanoparticle production from a solid-state macromolecular metal complex pyrolysis.
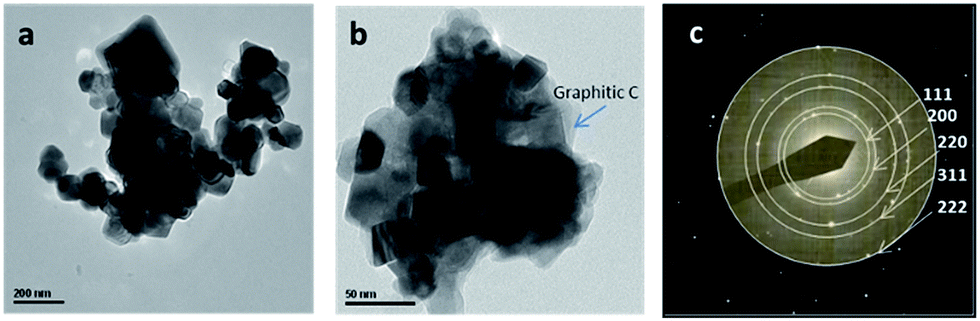
TEM images of the as obtained Co3O4 product are shown in Fig. 3. They exhibit an agglomerated morphology, similar to that obtained using different methods as reported previously.50,51 As found in those studies, TEM images showed bigger agglomerated particles (see Fig. 3(a)). The performed EDS analysis also confirmed the presence of Co and O atoms consistent with the formation of Co3O4 (41.44 ± 0.79 of Co and 58.56 ± 2.46 of O, in wt%). However, a close inspection (see Fig. 3b and c) suggests the presence of zones where small nanoparticles (the smallest in the range of 8–10 nm) can be observed supported on carbon or some organic residue after the pyrolysis step.
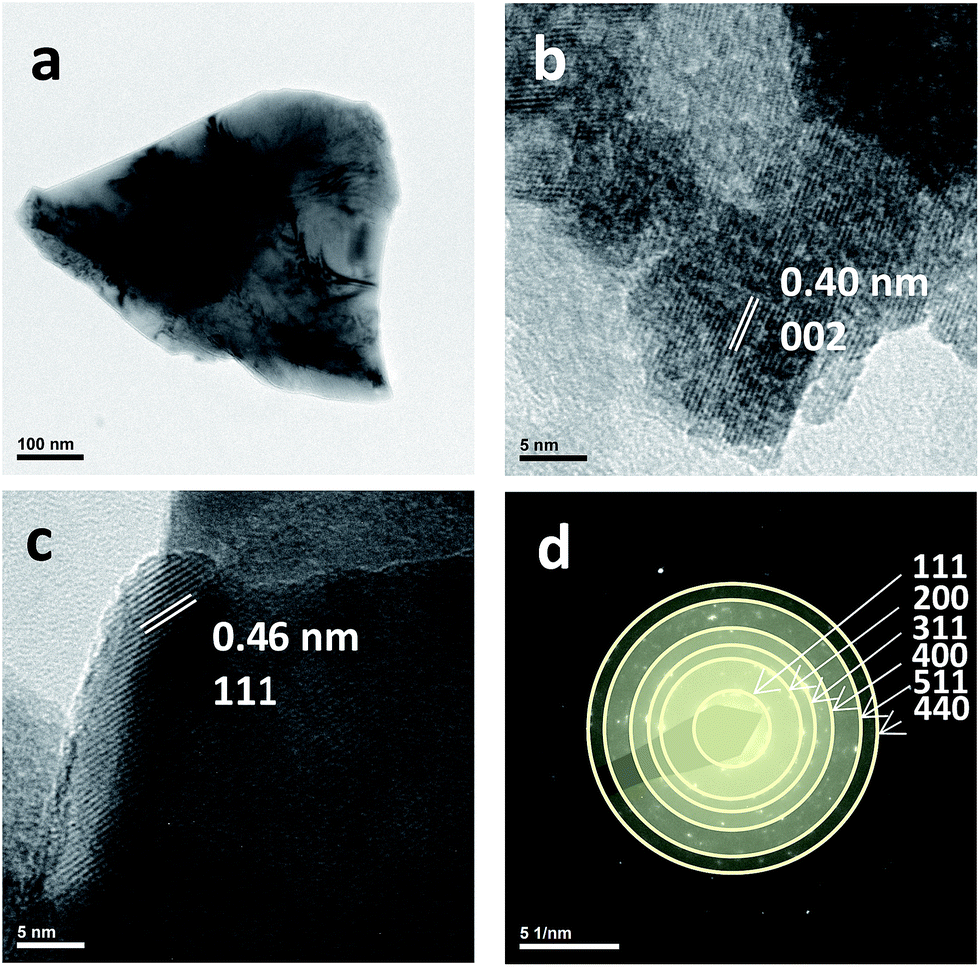 | ||
| Fig. 3 Co3O4 particles as observed by HRTEM: (a) polycrystal; (b and c) nanoparticles; and (d) SAED pattern analysis. | ||
In the case study of NiO, the as-obtained nanostructures exhibit metallic foam-like morphology in the SEM images of Fig. 4a–c. A few SEM studies on NiO have been reported showing this sponge-like morphology52 although mixed with some cuboidal shapes. EDS analysis confirmed the presence of Ni and O atoms, as observed in Fig. 4e. Further characterization by TEM showed isolated small aggregates (shown in Fig. 5), also consistent with results reported by other authors.49,52 As also observed, graphitic carbon formed during pyrolysis is possibly favoring the presence of aggregates. Finally, the SAED pattern (Fig. 5c) of the aggregate shown in Fig. 5b confirmed the crystallinity of the cubic NiO particles. Typical particle sizes vary from 10 to about 100 nm. The wide solid-state size distribution is typical of that of annealing methods for preparing nanostructured materials.10,11
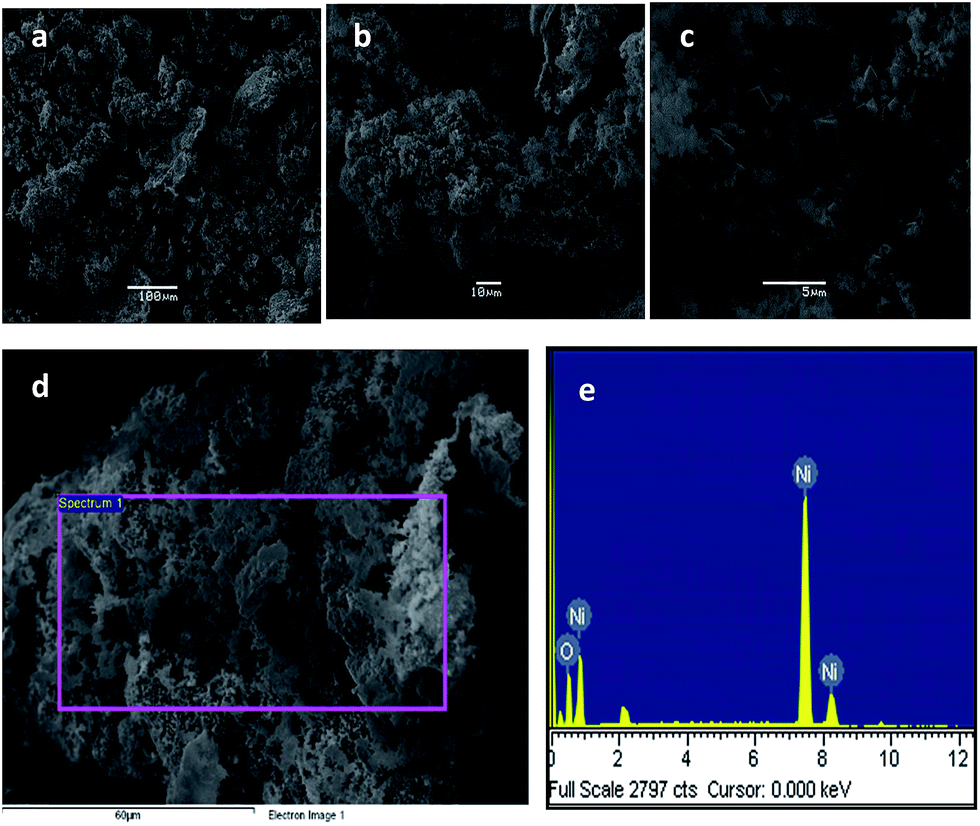 | ||
| Fig. 4 NiO particles as observed by (a–d) SEM; and (e) EDS analysis. | ||
 | ||
| Fig. 5 NiO particles as observed by (a and b) TEM; and (c) SAED pattern analysis. | ||
Metal oxides of Mn, Co and Ni form an interesting trio of magnetic materials.53 Syntheses of these metal oxide nanomaterials is usually done through solution methods. The majority of applications of these materials (as batteries, catalysts, and nanoelectronics devices) require the incorporation of the as-synthesized nanoparticles into solid-state devices. The magnetic properties of both Co3O4 and NiO nanostructured oxides were studied through magnetization cycles as a function of temperature and field.
Fig. 6 shows the behavior of Co3O4 nanoparticles measured under an applied field of 500 Oe in zero-field-cooled (ZFC)/field-cooled (FC) cycles. For this purpose, the sample is cooled down to 2 K under no magnetic field; an external field of 500 Oe is then applied and the response of the sample is recorded while warming between 2 K and 300 K. The sample is then cooled down under the same applied field. The main panel of Fig. 6 shows only the data below 100 K since the magnetization was fully reversible and did not show any anomaly above this temperature. A maximum is observed at TN = 38 K which corresponds to a magnetic transition from a paramagnetic state at T > TN toward an antiferromagnetic state at lower temperature. This value agrees with the one reported by Zhu et al., TN = 37 K, for particles of about 30 nm in size.54 Lima et al. reported different values of TN, depending on the preparation method, from 20 K for particles of 54 nm in size, down to 9 K for particles of 19 nm in size when using sucrose as chelating agent. Other authors also report varying values of TN, depending on the particle sizes: 25 K for 20 nm particles,56 30 K for 35 nm size57 or 15 K for 4 nm nanoparticles, all values below the one reported for bulk data (40 K).58 The analysis made by Zhu et al.54 considers finite-size scaling, that is a deviation of the transition temperature TN with respect to the one of the bulk depending on the dimension of the nanostructured material. In our case, the estimated size of the smallest Co3O4 nanoparticles (forming agglomerates) is of the order of 8–10 nm, and confirms the size dependence of the Néel transition temperature, consistent with previous literature data. On the other hand, no sign of a ferromagnetic component was observed in our case, contrary to the results reported by Zhu and Lima,54,55 for which marked divergences were observed between the ZFC and FC modes. Our result is confirmed by the magnetization measurements as a function of the applied field performed at 5 K and 300 K (inset, Fig. 6): data were fully reversible during increasing and decreasing applied fields, just an upward deviation appearing at 5 K suggesting a reorientation of the magnetic moment toward a ferromagnetic state at much higher fields. This observation may also explain the slight difference in ZFC and FC magnetizations and their increase below 8 K (Fig. 6, main panel).
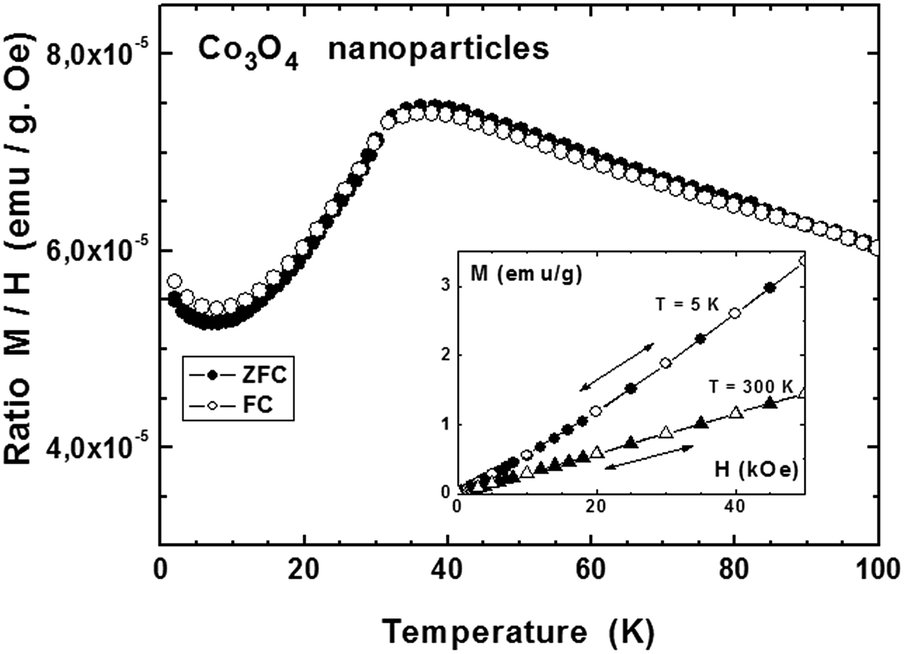 | ||
| Fig. 6 Magnetization of Co3O4 nanoparticles measured under an applied field of 500 Oe during a ZFC–FC cycle (main panel) and as a function of the applied field at 5 K and 300 K (inset). | ||
A different behavior was observed in the case of the obtained NiO nanoparticles. Fig. 7, main panel, shows the ZFC/FC cycle measured under an applied field of 500 Oe, while the inset shows the up-down variation of the magnetization measured as a function of the applied field at T = 5 K and T = 300 K. The overall behavior suggests a superparamagnetic state similar to the one observed in NiO obtained by a solution method59 and also to our previous observations on CuO nanostructured materials,37 with a blocking temperature above room temperature, reminiscent of the antiferromagnetic ordering temperature of 530 K or above for bulk NiO.60 A ferromagnetic component apparently exists in this nanostructured material since a slight hysteresis, hardly visible in the M vs. H curves, occurs at both 5 and 300 K (inset), that is, below the blocking temperature. This ferromagnetic component also explains the difference in the ZFC and FC modes. A slight anomaly occurs around 25 K, which may be an indication of an antiferromagnetic component of similar nature as the one observed for the Co3O4 nanoparticles. The quite linear variation of M vs. H (inset) at T = 5 K may be a confirmation of an antiferromagnetic component within the otherwise superparamagnetic matrix. Finite size effects have been suggested for nickel oxide obtained by different methods, with monodisperse nanoparticles ranging from 2 to 9 nm,59–61 with an antiferromagnetic ordered core and magnetically disordered shells. In our case, the smallest particles are also in the range of 10 nm, reinforcing the idea of interplay between antiferromagnetic interactions and a superparamagnetic state.
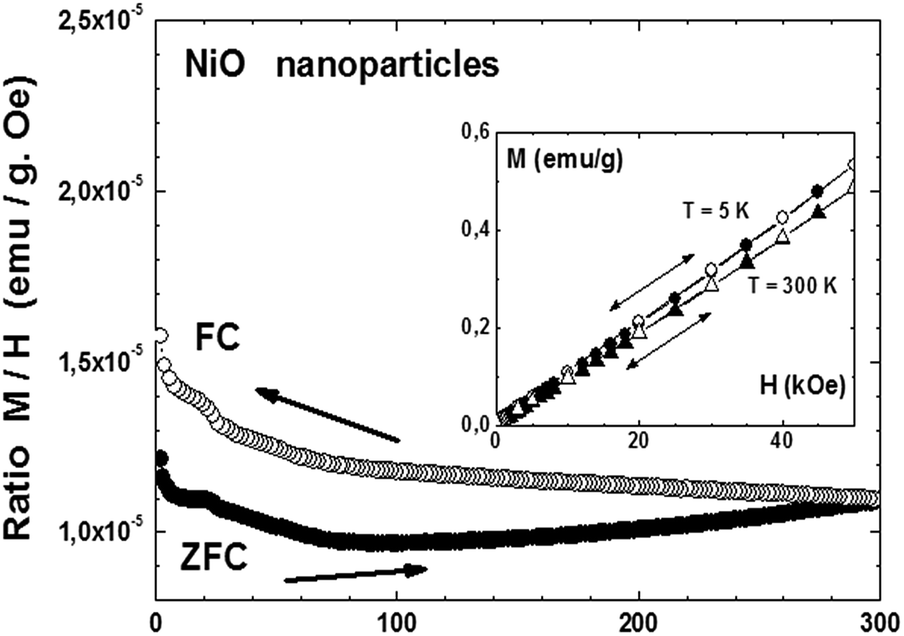 | ||
| Fig. 7 Magnetization of NiO nanoparticles measured under an applied field of 500 Oe during a ZFC–FC cycle (main panel) and as a function of the applied field at 5 K and 300 K (inset). | ||
3.3 Formation mechanism
Some insight into the formation mechanism of the nanostructured materials from the precursor chitosan·MXn can be obtained using the mechanism of formation of nanostructured metallic materials from the oligomer precursor {NP(OC8H12)2(OC6H4PPh2-Mn(CO)2(η5-C5H4Me)2}n.20The first step on heating involves the formation of a 3D network to produce a thermally stable matrix.62 This step is crucial because it offsets the sublimation. The first heating step could involve a cross-linking of the chitosan giving a 3D matrix containing O–M–O and H2N–M–NH2 links. The following steps involve the starting of the organic carbonization, producing holes where the nanoparticles begin to nucleate. According to TG/DSC analysis, this occurs at ∼400 °C for the molecular precursors. In this intermediate stage, a layered graphitic carbon host, detected in our previous work,20 was also detected for the formation of the Mn2O3, Co3O4 and NiO nanostructured oxides as shown in Fig. 8. The characteristic D and G bands of graphite in the 1300–1600 cm−1 range are clearly observed.63–65 However, the widths and relative intensities of the D and G bands, together with the probable presence of the D′ band, are indicators of some disorder in the monocrystalline graphite. This is a somewhat expected behavior, since the Raman measurements were performed after a 400 °C treatment, which is an intermediate step in the overall thermal process.
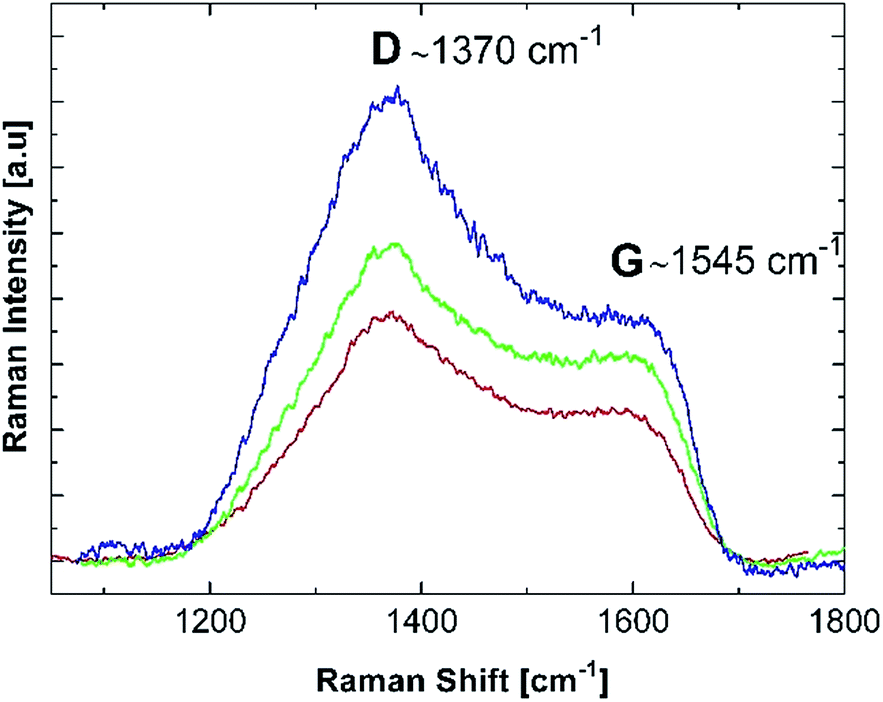 | ||
| Fig. 8 Room temperature Raman spectra of the (blue) Mn2O3, (green) Co3O4 and (red) NiO molecular precursors previously pyrolyzed at 400 °C. | ||
By comparison to other proposed solid-state mechanisms where related macromolecular complexes lead to nanostructured metal pyrophosphates,20 the observation of the D and G bands is a direct evidence of the formation of carbonaceous intermediate materials forming a layered surface where the Mn2O3, Co3O4 and NiO nanostructured oxides grow. More specifically the ID/IG ratio (ID and IG being the integrated areas of the D and G bands respectively) vs. the laser power, that is a measure of the graphitization degree, follows the expected trend as is shown in Fig. 9. The values observed for the measurements at the lower laser power would correspond to the carbonization degree obtained from the pyrolysis step at 400 °C. As laser power is increased, some graphitic carbon residues undergo additional combustion to CO2 and H2O and the ID/IG ratio rapidly decreases. On subsequent laser power increase, the ID/IG ratio decreases slowly. Due to the high degree of disorder, G and D′ bands are considered as a single G band66 for the ID/IG ratio calculations. It is well known that solid nanoparticles are stabilized by carbon in their different allotropic forms (amorphous C, graphite or graphene).67–69 Additionally in agreement with the proposed mechanism, see steps 2 and 3, the Raman measurements in several zones of the samples give some different ID/IG ratios as is shown in Table S6, ESI,† pointing to the presence of an irregular graphitic surface where the metal oxides are formed. This is consistent with the fact that thermal solid-state processes give non-regular products.
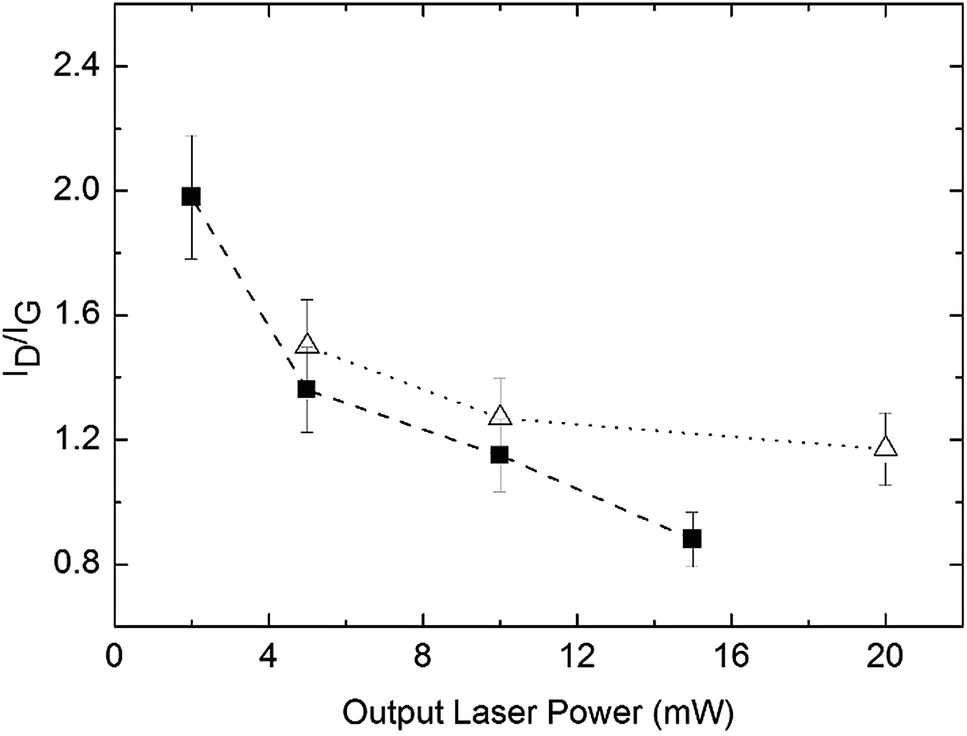 | ||
| Fig. 9 ID/IG as a function of laser power for the samples from precursors 1 (triangles) and 3 (squares) previously pyrolyzed at 400 °C. | ||
The graphitic layer acts as a template where the nanoparticles grow. After complete combustion this template disappears, with some carbon residues remaining as an ultrathin carbon shell around the nanoparticles.20
4. Conclusion
A solid-state method was used to obtain nanostructured metal oxides Mn2O3, Co3O4 and NiO by pyrolysis of the macromolecular precursors (chitosan) (MLn)x, yielding pure products with interesting magnetic properties. The formation of graphite in an intermediate step was corroborated by Raman measurements and also by HRTEM measurements, confirming the previously suggested formation mechanism in which this carbon phase acts as support for the growth and stabilization of the metal oxide nanoparticles. This carbon phase is crucial for the formation of the metal oxide nanoparticles in the solid state, and appears after the carbonization of the chitosan, confirming the important role of this polymer in stabilizing the solid Mn2O3, Co3O4 and NiO nanoparticles. This procedure could be a reliable and easy method to prepare metallic oxide nanoparticles with a variety of different metals.Acknowledgements
The authors would like to acknowledge Project Fondecyt 1120179 and 1160241, and grant 2015CD0013 (iCOOP-Light Program, CSIC) for funding the project. The use of Servicio General de Apoyo a la Investigation (SAI, University of Zaragoza) is also acknowledged.Notes and references
- H. Goesmann and C. Feldsmann, Angew. Chem., 2010, 49, 1362–1395 CrossRef CAS PubMed.
- R. K. Joshi and J. Schneider, Chem. Soc. Rev., 2012, 41, 5285–5312 RSC.
- Ch. Yan and D. Xue, J. Phys. Chem. B, 2006, 110, 1581–1586 CrossRef CAS PubMed.
- C. Zhang, J. Chen, Y. Zeng, X. Rui, J. Zhu, W. Zhang, C. Xu, T. M. Lim, H. H. Hng and Q. Yan, Nanoscale, 2012, 4, 3718–3724 RSC.
- Z. Y. Zhou, N. Tian, J. T. Li, I. Broadwell and S. G. Sun, Chem. Soc. Rev., 2011, 40, 4167–4185 RSC.
- M. Fernandez-Garcia, A. Martinez-Arias, J. C. Hanson and J. A. Rodriguez, Chem. Rev., 2004, 104, 4063–4104 CrossRef CAS PubMed.
- J. P. Jolivet, S. Cassignon, C. Chanéac, D. Chiche, D. Durupthy and D. Portehault, C. R. Chim., 2010, 13, 40–51 CrossRef CAS.
- M. L. Khan, A. Glaria, C. Pages, M. Monge, L. S. Macary, A. Maisonnat and B. Chaudret, J. Mater. Chem., 2009, 19, 4044–4060 RSC.
- N. Pinna and M. Niederberger, Angew. Chem., 2008, 47, 5292–5304 CrossRef CAS PubMed.
- C. Díaz and M. L. Valenzuela, in Metallic Nanostructures Using Oligo and Polyphosphazenes as Template or Stabilizer in Solid State in Encyclopedia of Nanoscience and Nanotechnology, ed. H. S. Nalwa, American Scientific Publishers, 2010, vol. 16, pp. 239–256 Search PubMed.
- A. Orlov, A. Roy, M. Lehmann, M. Driess and S. Polarz, J. Am. Chem. Soc., 2007, 129, 371–375 CrossRef CAS PubMed.
- M. Meilikhov, K. Yusenko, D. Esken, S. A. Turner, G. Van Tendoloo and R. A. Fischer, Eur. J. Inorg. Chem., 2010, 3701–3714 CrossRef CAS.
- G. Walkers and I. P. Parkin, J. Mater. Chem., 2009, 19, 574–590 RSC.
- G. B. Khomutov, V. V. Kislov, M. N. Antipirina, R. V. Gainutdinov, S. P. Gubin, A. Y. Obydenov, S. A. Pavlov, A. A. Rakhnyanskaya, A. N. Sergeev-Cherenkov, E. S. Soldatov, D. B. Suyatin, A. L. Toltikhina, A. S. Trifonov and T. V. Yurova, Microelectron. Eng., 2003, 69, 373–383 CrossRef CAS.
- B. Teo and X. Sun, Chem. Rev., 2007, 107, 1454–1532 CrossRef CAS PubMed.
- S. Adewuyi, K. T. Kareem, A. O. Atayese, S. A. Amolegbe and C. A. Akinremi, Int. J. Biol. Macromol., 2007, 48, 301–303 CrossRef PubMed.
- M. P. Pileni, Acc. Chem. Res., 2007, 40, 685–693 CrossRef CAS PubMed.
- M. P. Pileni, J. Mater. Chem., 2011, 21, 16748–16758 RSC.
- Y. F. Wan, N. Goubet, P. A. Albouy and M. P. Pileni, Langmuir, 2013, 29, 7456–7463 CrossRef CAS PubMed.
- C. Díaz, M. L. Valenzuela, V. Lavayen and C. O'Dwyer, Inorg. Chem., 2012, 51, 6228–6236 CrossRef PubMed.
- C. Díaz and M. L. Valenzuela, unpublished results.
- C. Li, Z. Zhong and W. K. Leong, Langmuir, 2008, 24, 10427–10431 CrossRef CAS PubMed.
- I. Aranaz, M. Mengibar, R. Harris, I. Paños, B. Miralles, N. Acosta, G. Galed and A. Heras, Curr. Chem. Biol., 2009, 3, 203–230 CAS.
- K. Okuyama, K. Noguchi, T. Miyazawa, T. Yui and K. Ogawa, Macromolecules, 1997, 30, 5849–5855 CrossRef CAS.
- W. S. Wan Ngah, L. C. Teong and K. A. Hanafiah, Carbohydr. Polym., 2011, 83, 1446–1456 CrossRef CAS.
- K. Mazeau, W. T. Winter and J. H. Chanzy, Macromolecules, 1994, 27, 7606–7612 CrossRef CAS.
- M. Kong, X. G. Chen, K. Xing and H. J. Park, Int. J. Food Microbiol., 2010, 144, 51–63 CrossRef CAS PubMed.
- N. V. Majeti and R. Kumar, React. Funct. Polym., 2000, 46, 1–27 CrossRef.
- A. Muzzarelli, Chitin, Pergamon Press, New York, 1973 Search PubMed.
- G. Crini and P. M. Badot, Prog. Polym. Sci., 2008, 33, 399–447 CrossRef CAS.
- A. A. Emara, M. A. Tawad, M. A. El-ghamry and M. Z. Elsabee, Carbohydr. Polym., 2011, 83, 192–202 CrossRef CAS.
- F. G. Wu, R. L. Tseng and R. S. Juang, J. Environ. Manage., 2010, 91, 798–806 CrossRef CAS PubMed.
- K. Ozawa and K. Oka, Chem. Mater., 1993, 5, 726–728 CrossRef.
- Y. C. Chang and D. H. Chen, J. Colloid Interface Sci., 2005, 283, 446–451 CrossRef CAS PubMed.
- S. Schlick, Macromolecules, 1986, 19, 192–195 CrossRef CAS.
- R. B. Hernández, O. Reyes and A. L. Merce, J. Braz. Chem. Soc., 2007, 18, 1388–1396 CrossRef.
- C. Díaz, M. L. Valenzuela, V. Lavayen, K. Mendoza and O. Peña, Inorg. Chim. Acta, 2011, 377, 5–13 CrossRef.
- M. Adlim, M. A. Bakar, Y. Kong and J. Ismail, J. Mol. Catal. A: Chem., 2004, 212, 141–149 CrossRef CAS.
- J. Brugnerotto, J. Lizardi, F. M. Goycoolea, W. Arguelles-Monal, J. Desbrieres and M. Rinaudo, Polymer, 2001, 42, 3569–3580 CrossRef CAS.
- Y. Ding, X. H. Xia and C. Zhang, Nanotechnology, 2006, 17, 4156–4162 CrossRef CAS PubMed.
- H. Huang, Q. Yuan and X. Yang, Colloids Surf., B, 2004, 39, 31–37 CrossRef CAS PubMed.
- H. Huang and X. Yang, Carbohydr. Res., 2004, 339, 2627–2631 CrossRef CAS PubMed.
- K. Okitsu, Y. Mizukoshi, T. A. Yamamoto, Y. Maeda and Y. Nagata, Mater. Lett., 2007, 61, 3429–3431 CrossRef CAS.
- K. H. Yang, Y. Liu, T. Hsu and H. I. Tsai, Mater. Res. Bull., 2010, 45, 63–68 CrossRef CAS.
- I. Zhitomirsky and A. Hashambhoy, J. Mater. Process. Technol., 2007, 191, 68–72 CrossRef CAS.
- J. Cao, Y. Zhu, K. Bao, L. Shi, S. Liu and Y. Qian, J. Phys. Chem. C, 2009, 113, 17755–17760 CAS.
- M. Salavati-Niasari, F. Mohades, F. Davar and K. Saberyan, Appl. Surf. Sci., 2009, 256, 1476–1480 CrossRef CAS.
- J. Zhao, Y. Zou, X. Zou, T. Bai, Y. Liu, R. Gao, D. Wang and G. D. Li, Nanoscale, 2014, 6, 7255–7262 RSC.
- Q. Li, L. S. Wang, B. Y. Hu, C. Yang, L. Zhou and L. Zhang, Mater. Lett., 2007, 61, 1615–1618 CrossRef CAS.
- S. Farhadi and J. Safabakhsh, J. Alloys Compd., 2012, 515, 180–185 CrossRef CAS.
- M. Y. Nassar and I. S. Ahmed, Polyhedron, 2011, 30, 2431–52437 CrossRef CAS.
- V. S. Reddy, R. Holze and B. Rambabu, Colloids Surf., A, 2012, 414, 204–208 CrossRef.
- N. R. Jana and X. Peng, Chem. Mater., 2004, 16, 3931–3935 CrossRef CAS.
- H. T. Zhu, J. Luo, J. K. Liang, G. H. Rao, J. B. Li, J. Y. Zhang and Z. M. Du, Phys. B, 2008, 403, 3141–3145 CrossRef CAS.
- R. J. Lima, K. O. Moura, P. P. Pedra, J. G. Duque and C. T. Meneses, Phys. B, 2012, 407, 3196–3198 CrossRef CAS.
- S. A. Makhlouf, J. Magn. Magn. Mater., 2003, 46, 184–190 Search PubMed.
- C. Nethravathi, S. Sen, N. Ravishankar, M. Rajamathi, C. Pietzonka and J. Harbrecht, J. Phys. Chem. B, 2005, 109, 11468–11472 CrossRef CAS PubMed.
- W. L. Roth, J. Phys. Chem. Solids, 1964, 2, 1–10 CrossRef.
- N. Rinaldi-Montes, P. Gorria, D. Martinez-Blanco, A. B. Fuertes, L. Fernandez-Barquin, J. Rodriguez Fernandez, I. Pedro, M. L. Fernandez-Gubieda, J. Alonso, L. Olivi, G. Aquilanti and J. A. Blanco, Nanoscale, 2014, 6, 457–465 RSC.
- J. Park, E. Kang, S. Seung, M. Park, M. K. Lee, J. Kim, K. W. Kim, H. J. Noh, J. H. Park, C. Bae, J. G. Park and T. Hyeon, Adv. Mater., 2005, 17, 429–437 CrossRef CAS.
- E. Winkler, R. D. Zysler, M. Vasquez, D. Fiorani, D. Rinaldi, M. Vasilakaki and K. N. Trohidoku, Nanotechnology, 2008, 19, 185702 CrossRef CAS PubMed.
- C. Díaz, M. L. Valenzuela, L. Zuñiga and C. O'Dwyer, J. Inorg. Organomet. Polym. Mater., 2009, 19, 507–520 CrossRef.
- J. Campos-Delgado, H. Farhat, Y. A. Kim, A. Reina, J. Kong, M. Endo, H. Muramatsu, T. Hayashi, H. Terrones, M. Terrones and M. S. Dresselhaus, Small, 2009, 5, 2698–2702 CrossRef CAS PubMed.
- M. Endo, K. Nishimura, Y. A. Kim, K. Hakamada, T. Matushita, M. S. Dresselhaus and G. Dresselhaus, J. Mater. Res., 1999, 14, 4474–4477 CrossRef CAS.
- J. R. Nemanich and S. A. Solin, Phys. Rev. B: Condens. Matter Mater. Phys., 1979, 20, 392–401 CrossRef.
- A. C. Ferrari, Solid State Commun., 2007, 143, 47–57 CrossRef CAS.
- S. Gao, Y. Song, M. Ling and F. Cui, Nanoscale, 2015, 7, 14254–14263 RSC.
- Y. Jang, S. Kochuveedu, Y. Jang, S. Yoon, M. Steinhat and D. Kim, Carbon, 2011, 49, 2120–2126 CrossRef CAS.
- X. Chen and Y. Xing, Langmuir, 2005, 21, 9334–9338 CrossRef PubMed.
Footnote |
| † Electronic supplementary information (ESI) available. See DOI: 10.1039/c7ra00782e |
| This journal is © The Royal Society of Chemistry 2017 |