 Open Access Article
Enhanced thermal conductivity in immiscible polyimide blend composites with needle-shaped ZnO particles†
Shoya Uchida a,
Tomoya Murakamia,
Takeru Iwamura
 b,
Ryohei Ishige
 a and
Shinji Ando
 *a
*a
aDepartment of Chemical Science and Engineering, Tokyo Institute of Technology, Ookayama, Meguro-ku, Tokyo 152-8552, Japan. E-mail: sando@polymer.titech.ac.jp
bDepartment of Chemistry and Energy Engineering, Faculty of Engineering, Tokyo City University, 1-28-1 Tamazutsumi, Setagaya-ku, Tokyo 158-8557, Japan
First published on 8th March 2017
Abstract
Novel blend composite films were prepared by mixing two kinds of immiscible polyimides (PIs), one containing sulfur (SD) and one containing fluorine (TF), with needle-shaped zinc oxide (n-ZnO) particles. Optical microscopy and cross-sectional SEM images revealed that vertical double percolation (VDP) structures were successfully formed in the PI blend films by spontaneous macro-phase separation. In the VDP structures, each phase is separately aligned along the out-of-plane direction, and the n-ZnO particles were selectively incorporated in the TF-rich phase. These blend composite films exhibited significantly higher thermal conductivity (TC) in the out-of-plane direction than blend composite films containing pyramidal ZnO (p-ZnO) particles. The wide-angle X-ray diffraction (WAXD) results revealed that the n-ZnO particles were more randomly oriented in the blend films than those in homopolymer films, in which the particles were preferentially aligned parallel to the film. The n-ZnO particles confined in the VDP structures and partially oriented along the out-of-plane direction contributed to the enhancement of the out-of-plane TC.
Introduction
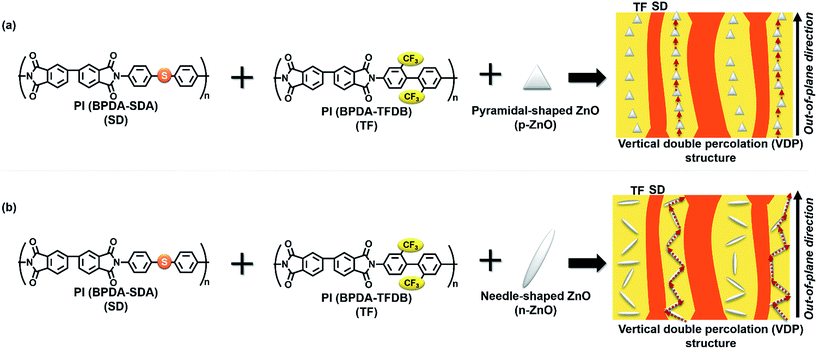
Polyimides (PIs) are a type of super-engineering plastics containing imide groups in the main chain of the repeating unit. PI films have been widely used for flexible printed circuit (FPC) boards, thermal control films for artificial satellites, and orientation films for liquid crystalline displays (LCDs) because of their excellent physical properties, including good heat resistance and mechanical properties and a potentially wide range of molecular designs. Recently, increasing the thermal conductivity (TC) along the out-of-plane direction to efficiently dissipate heat, which is necessary for the miniaturization and functionalization of electronic devices, has become an active research area. Different types of thermally conductive fillers have been incorporated into polymer matrices in order to fabricate composites with high TCs.1–6 The most effective method to produce highly thermally conductive composites is forming a continuous network of the filler throughout the polymeric matrix (percolation). The concentration must be higher than a certain critical concentration of the filler, which is called the percolation threshold. However, high filler concentrations can reduce the processability, flexibility, and toughness and increase the weight of the composites. Hence, the percolation threshold and the filler loading should be minimized as long as the required properties are attained.7–12Recently, we reported immiscible PI blend films consisting of fluorine-containing poly(amic acid) (PAA) (TF) and sulfur-containing PAA (SD), which formed characteristic phase-separated structures wherein the two phases were separated in the horizontal, in-plane direction and aligned along the out-of-plane direction.13,14 The phase-separated structure is called ‘vertical double percolation (VDP) structure’. In these blend composite films, pyramidal ZnO (p-ZnO) particles were selectively incorporated into the TF-rich domains (Fig. 1(a)), and the composite film showed significantly higher TC than the monophase PI film in which p-ZnO particles were homogenously dispersed. In that system, higher TC was achieved with a smaller amount of filler because the filler was accommodated in a smaller volume (i.e., the volume of TF-rich domains) than in the homopolymer, thus reducing the percolation threshold. On the other hand, we recently investigated the relationship between the orientation of hexagonal boron nitride (h-BN) platelets in PI/h-BN composite films and the anisotropy of the composite film's TC. In that study, h-BN aggregates induced the h-BN platelets to arrange in a more isotropic, random orientation in the composite film, thus effectively enhancing the TC in the out-of-plane direction. This is because separated h-BN particles preferentially orient along the in-plane direction, which significantly reduces the TC in the out-of-plane direction.15 Therefore, a significant enhancement in TC is expected when anisotropic particles incorporated in the VDP structure have isotropic or preferential out-of-plane orientations in PI blend films.
In this study, we chose needle-shaped ZnO (n-ZnO) particles as the inorganic filler to fabricate novel PI/ZnO composites exhibiting higher TC in the out-of-plane direction. Since n-ZnO particles are highly anisotropic in shape and can attain uniaxial orientations, thereby reducing the percolation concentration, we investigated the relationship between the orientation of n-ZnO particles in PI composite films prepared from two types of immiscible PAA solutions and the out-of-plane TC of the PI composite film (Fig. 1(b)).
Experimental
Materials
The n-ZnO particles were synthesized according to the literature.16 Briefly, oleylamine and zinc acetate dehydrate (Zn(Ac)2·2H2O) purchased from TCI Co., Ltd. were mixed by stirring in a Teflon beaker at 80 °C on a hot plate. The obtained slurry mixture was irradiated in a microwave reactor twice at 200 W for 8 min. The obtained brown solid was washed with ethanol and centrifuged six times. Aggregated n-ZnO particles in the precipitate were dispersed in ethanol and separated by a planetary mixing machine (ARE-300, Thinky Corp.) at 2000 rpm for 7 min. The filtered solid was dried at 60 °C for 2 h in vacuum condition, followed by calcination at 600 °C for 3 h in a muffle furnace to eliminate residual organic matter on the surface. The pale brown solid turned into a white powder after the calcination. The obtained n-ZnO powder was dispersed in ethanol and treated again using the planetary mixer. The yield for preparation of n-ZnO particles was 66%.3,3′,4,4′-Biphenyltetracarboxylic dianhydride (BPDA, Ube industries, Ltd.) was dried under reduced pressure at 180 °C for 8 h prior to use. 4,4′-Thiodianiline (SDA) purchased from Wako Pure Chemical Industries Ltd. was purified by sublimation under reduced pressure. 2,2′-Bis(trifluoromethyl)-4,4′-diaminobiphenyl (TFDB) supplied by Central Glass Co. Ltd. was used as received. N,N-Dimethylacetamide (DMAc, anhydride) purchased from Sigma-Aldrich was used as received. PAA solutions of BPDA–SDA (SD) and BPDA–TFDB (TF) without ZnO particles were prepared using the conventional method.13,14
The PAA solution containing n-ZnO particles was prepared according to the following procedure. First, n-ZnO particles were dispersed in DMAc using an ultrasonic homogenizer (US-50, Nissei Corp.), and then, equimolar amounts of dianhydride and diamine were dissolved in the DMAc solution and stirred for 3 days. The solid content of SD in the DMAc solution was fixed at 10 wt%, and that of TF containing n-ZnO particles was varied between 12 wt% and 15 wt%.
PAA blend solutions were prepared by blending the SD and TF PAA solutions with n-ZnO content 0–23 vol%. The molar ratio of SD and TF was set to 50![[thin space (1/6-em)]](https://www.rsc.org/images/entities/char_2009.gif) :
:![[thin space (1/6-em)]](https://www.rsc.org/images/entities/char_2009.gif) 50. The solution was spin-coated onto a silicon substrate, followed by soft-baking at 70 °C. Then, the PAA films were peeled from the substrate and pasted onto aluminium foil covering the silicon substrate in order to prevent the silicon substrate from constraining the films. Finally, the films were thermally cured at 350 °C for 1.5 h under a nitrogen atmosphere. The FT-IR and UV-vis spectra measured for SD and TF PI films were shown in Fig. S5 and S6.† From these spectra, it was confirmed that the thermal imidization of SD and TF films was completed.
50. The solution was spin-coated onto a silicon substrate, followed by soft-baking at 70 °C. Then, the PAA films were peeled from the substrate and pasted onto aluminium foil covering the silicon substrate in order to prevent the silicon substrate from constraining the films. Finally, the films were thermally cured at 350 °C for 1.5 h under a nitrogen atmosphere. The FT-IR and UV-vis spectra measured for SD and TF PI films were shown in Fig. S5 and S6.† From these spectra, it was confirmed that the thermal imidization of SD and TF films was completed.
Measurements
Surface images of PI blend composite films with n-ZnO were taken with an Olympus SZX12 microscope. Cross-sectional images of the films were observed by FE-SEM (7500F and S-5500, Hitachi) and a desktop SEM (TM3000, Hitachi) in the back-scattering electron mode. Cross-sections of the composite films were prepared using a cross-section polisher (SM-09020CP, JEOL). Wide-angle X-ray diffraction (WAXD) patterns were obtained using Cu-Kα radiation (50 kV, 100 mA) using a Bruker D8 DISCOVER equipped with a Vantec 500 detector. The detector was tilted 40° from the direction of the X-ray irradiation direction to detect wide-angle diffraction. The thermal diffusivities along the out-of-plane direction (D⊥) of the PI composite films were measured with an AC temperature wave analyzer (ai-Phase mobile-1u, ai-Phase Co., Ltd.) at room temperature.17,18 Each film was measured at ten different positions to calculate an average value. The IR absorption spectrum of each phase-separated domain in the PI blend film was measured with a FT-IR microscope using the attenuated total reflection (ATR) method. The orientation angle distribution of n-ZnO particles in the composite films was estimated by fibre orientation analysis software.19–21 This software calculates azimuthal angle distribution of mean amplitude in radial direction from two-dimensional fast Fourier transformation (2D-FFT) power spectrum of an image. Then, the orientation direction of fillers can be estimated based on the anisotropy of the obtained mean amplitude-intensity. The mean amplitude was calculated by following equation.21where
 is mean amplitude, and r and θ are the distance and the angle in polar coordinates, respectively. The detailed theory used in the fibre orientation analysis is explained in ref. 21.
Results and discussion
Characterization of n-ZnO and PI blend films
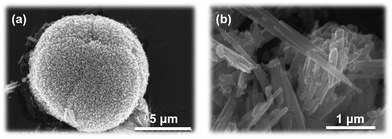
Fig. 2(a) and (b) show the appearance of aggregated and separated n-ZnO particles, respectively. The needle-like shapes of the isolated n-ZnO particles are significantly different from those of the previously prepared pyramidal ZnO particles (p-ZnO), whose diameters were ca. 500 nm. The length along the longer axis and the diameter of the p-ZnO crystallites were 2–5 μm and 100–300 nm, respectively. Polymerized, reacted, or degraded compounds from the oleylamine, which is used as the solvent, cause the generated n-ZnO particles to adhere to each other because of the reactive C![[double bond, length as m-dash]](https://www.rsc.org/images/entities/char_e001.gif) C bond at the center of the oleylamine molecule.16
C bond at the center of the oleylamine molecule.16
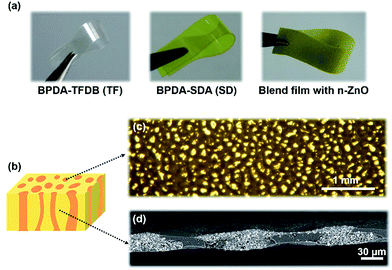
PI blend films containing n-ZnO particles were prepared by spin-coating the PAA solution onto silicon substrates followed by drying at 70 °C for 1 h and thermal curing at 350 °C for 1.5 h. The temperature was gradually raised to 350 °C at a heating rate of 5 °C min−1. Fig. 3(a) presents photographs of the obtained films. The blend composite film (filler content: 21 vol%) is as flexible as SD and TF homopolymer films. This flexibility is mainly attributed to filler-free SD component in the blend composite films. The photographs taken by an optical microscope and a cross-sectional SEM image of the obtained PI blend film (filler content: 21 vol%) are presented in Fig. 3(c) and (d). In the surface images taken by an optical microscope, dark and bright regions are clearly separated, indicating that the phases separated in the blend film, wherein the introduced n-ZnO was suitably incorporated into one phase. The cross-sectional SEM image also shows bright and dark regions indicating phase-separated structures, which are aligned along the out-of-plane direction. Thus, the surface microscopic images and SEM micrographs confirmed that the VDP structure was successfully formed in the blend film.
Furthermore, the components of each domain in the PI blend film were analyzed using micro-FT-IR ATR spectroscopy in the reflection mode. Infrared light was irradiated against the phase-separated ZnO-poor (the circle dotted-line in Fig. 4(a)) and ZnO-rich domains (same in Fig. 4(b)) of the blend film surface, and the FT-IR spectra thus obtained are shown in Fig. 4(c). Strong absorption bands (1050–1200 cm−1) assignable to C–F stretching from the TF component revealed that the ZnO-rich phase mainly consists of TF.13 This result indicated that n-ZnO particles were selectively incorporated into the TF-rich phase of the PI blend film because the filler was first mixed into the TF solution, which has a higher viscosity.
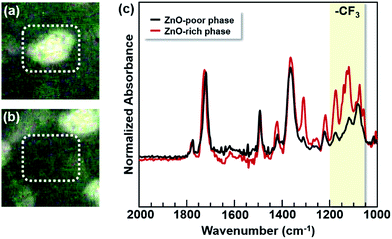 | ||
| Fig. 4 Optical microscopic images of (a) ZnO-poor and (b) ZnO-rich phases, and (c) micro-FT-IR ATR spectra of the ZnO-poor and ZnO-rich phases in the blend films. The colored band corresponds to absorption band (1050–1200 cm−1) of C–F stretching vibration. Photos of (a) and (b) correspond to the magnifications of the image of Fig. 3(c), and the circle dotted-lines in (a) and (b) are the infrared-irradiated regions. | ||
TCs of PI blend composite films
To evaluate the TC, the out-of-plane thermal diffusivity (D⊥) was measured by a temperature wave analysis (TWA) at room temperature.17,18 D⊥ value can be transformed into the out-of-plane TC by the following equation:| λ = ρCpD⊥, | (1) |
| ρc = ρpϕp + ρm(1 − ϕp) | (2) |
| Cpc = Cppϕp + Cpm(1 − ϕp), | (3) |
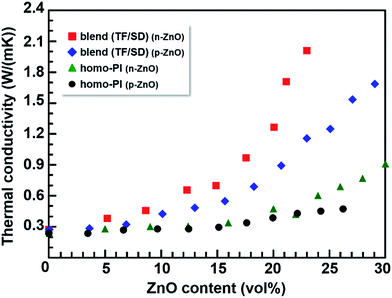
The out-of-plane TCs of homogenously dispersed TF-PI (homo-PI) and PI blend films containing n-ZnO particles are summarized in Fig. 5 and Table S1.† For comparison, the TCs of TF-PI and PI blend films containing p-ZnO particles are also incorporated into Fig. 5.14 Firstly, the TF-PI homopolymer composites containing p-ZnO particles and those containing n-ZnO particles do not exhibit obvious differences in their TC values at low loadings (ZnO content < 20 vol%), whereas the TF-PI composites containing n-ZnO demonstrate slightly higher TC values than those containing p-ZnO at higher loadings (>20 vol%). Since both filler particles are homogeneously dispersed in the homo-PI films, neighboring filler particles do not adequately come into contact with each other, even at higher loadings, and thermal conductive pathways were not successfully formed in the films, especially for p-ZnO particles with isotropic shapes. In the case of n-ZnO in homo-PI films, the needle-shaped particles were preferentially oriented in the in-plane direction due to the shear force induced by spin-coating. Hence, the out-of-plane TC of homo-PI composites containing both p-ZnO and n-ZnO was hardly enhanced. The slight enhancement in TC observed for the homo-PI with n-ZnO can be ascribed to the anisotropic shape of n-ZnO, which can enhance contact among particles at high loadings, thus partially forming a percolation pathway in the homo-PI film.
On the other hand, the blend composite films containing p-ZnO and n-ZnO particles exhibit markedly more enhanced TCs than the homo-PI composite films. Furthermore, the effect of the particle morphology on the TC (i.e., the difference between the effects of the pyramidal and needle-shaped particles) is significantly higher in the blend films than in the homo-PI films. In addition, the relation between the TC and ‘effective ZnO content’ of the composite films is shown in Fig. 6, and the data are summarized in Table S1.† Here, the effective ZnO content indicates a percentage of the ZnO particles incorporated in the matrices (i.e., TF-rich phase in the blend composite films or homo-PI). The TC values for the blend composite films containing n-ZnO particles are slightly higher than those for the homo-PI films in the whole region. In case of the blend composites containing p-ZnO particles, the effective volume fraction of p-ZnO is significantly increased (almost doubled) with the formation of the VDP structure due to the appearance of the TF-poor regions. Thus, the out-of-plane TC was significantly enhanced, which is called ‘the confinement effect’.13 Furthermore, for the TC values in the composite films containing p-ZnO particles, we have reported that the theoretical curve originating from the Bruggeman equation agrees well with the experimental TC values when the effective volume fraction was adopted.14 However, the TC values observed for the blend composite films containing n-ZnO particles are obviously larger than those for the homo-PI composite films. This fact clearly indicates that the enhancement of the TC in the blend composite films containing n-ZnO particles arises not only from the confinement effect but also from the anisotropy in shapes and the preferential orientations of the fillers.
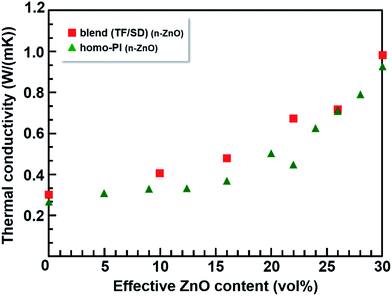 | ||
| Fig. 6 The relationship between the thermal conductivity of the PI composite films containing n-ZnO particles and effective ZnO content: PI blend films (■) and homo-PI films (▲). | ||
Based on these results, the significant enhancement in TC observed for the blend film containing n-ZnO can be explained as follows: the n-ZnO particles dispersed in homo-PI films are preferentially oriented in the in-plane direction due to the spin-coating process. In the blend composites containing p-ZnO particles, the confinement effect of p-ZnO particles with the formation of the VDP structure leads to a significant enhancement of the out-of-plane TC. Moreover, when PI blend films are prepared with n-ZnO particles, the effective volume fraction of n-ZnO is not only increased, but also the in-plane orientation of n-ZnO particles is effectively obstructed by boundaries between the TF-rich and TF-poor phases, which induce the relatively isotropic orientation of the n-ZnO particles within the TF-rich phases. This is another beneficial effect of particle confinement (Fig. S1†), and thus, the out-of-plane TC of the blend films containing n-ZnO was significantly enhanced.
The orientation analysis of n-ZnO in PI composite films by XRD
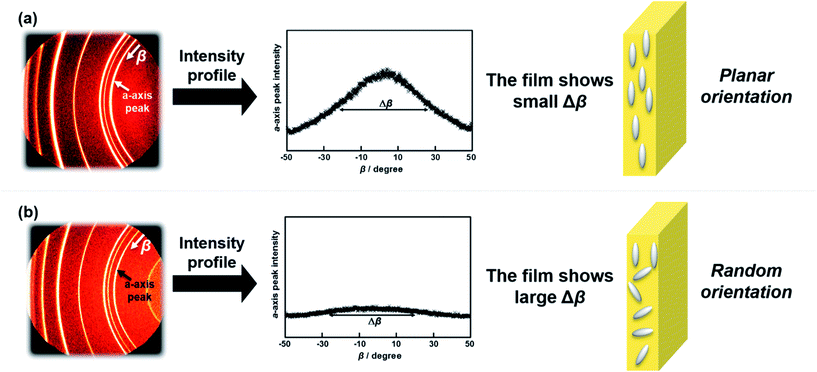
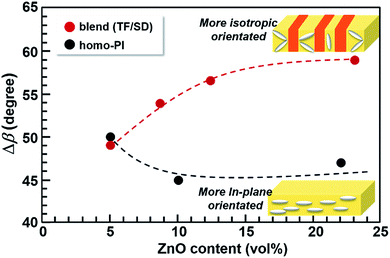
The orientation of n-ZnO particles incorporated into the homo-PI and PI blend composite films was analyzed using the WAXD technique. The recognizable WAXD patterns of ZnO crystalline have been reported to appear from 2θ = 30° to 80°.23 The X-ray beam was irradiated perpendicular to the edge-plane of a rectangular piece of film (Fig. 7(b)).24 The diffraction images of the composite films are presented in Fig. 7(c), which shows diffraction peaks assignable to (100), (002), (101), (102), (110) and (103) diffraction.23 It has been proposed that ZnO crystals grow along the c-axis,25 which corresponds to the longer axis of the n-ZnO particles (Fig. 7(a)), while the a-axis corresponds to the short axis of the n-ZnO particle. Thus, the orientation of the dispersed n-ZnO particles in the matrix can be analyzed by the azimuthal intensity distribution of the (100) direction. The azimuthal intensity profiles were fitted to a Gaussian function expressed as eqn (4), and the full-width at half-maximum (FWHM) Δβ was estimated by eqn (5).
 | (4) |
| Δβ = 2.35d | (5) |
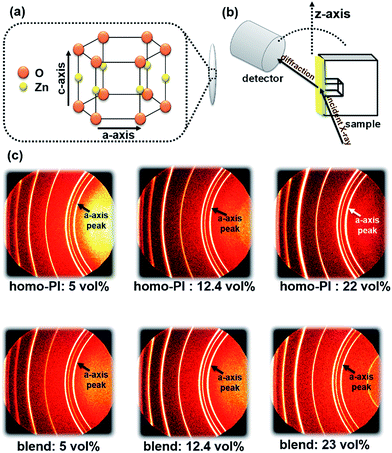 | ||
| Fig. 7 (a) Crystal axes of the n-ZnO particle, (b) setup for the XRD measurement of composite films, and (c) the XRD patterns of n-ZnO particles incorporated in the PI composite films. | ||
Direct analysis of orientation distribution of n-ZnO particles in composite films
To directly estimate the orientation of the n-ZnO particles in the composite films, cross-sectional FE-SEM images were obtained, as shown in Fig. 10. The cross-section was prepared using a cross-section polisher. The needle-shaped white particles in these images correspond to n-ZnO. In both the PI composite films with lower n-ZnO contents ((a) and (c)), n-ZnO particles with highly anisotropic shapes are in-plane oriented. In contrast, with higher n-ZnO contents ((b) and (d)), the n-ZnO particles are still in-plane oriented in the homo-PI film, but in the PI blend composite films, the n-ZnO particles are more randomly oriented. These observations agree well with the results of the WAXD analysis.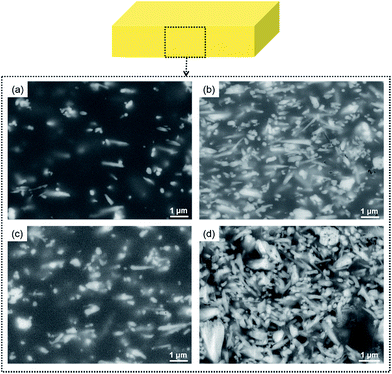 | ||
| Fig. 10 Cross-sectional FE-SEM images of (a) homo-PI 5 vol%, (b) homo-PI 22 vol%, (c) blend 5 vol%, and (d) blend 23 vol%. | ||
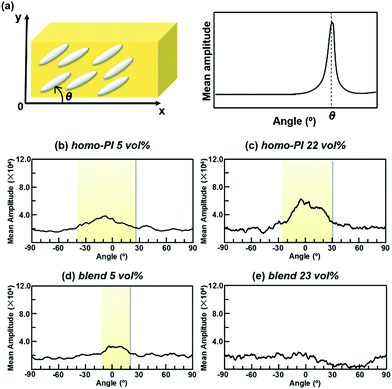
The orientation distribution of the n-ZnO particles in the PI composite films was also analyzed using a fibre orientation analysis. The FE-SEM images in Fig. 10 were processed by a 2D-FFT, and the azimuthal distribution of the mean amplitude was then estimated from the power spectra. When the n-ZnO particles are uniaxially oriented, the direction of periodicity is formed in the periodic structures orthogonal to the orientation direction of the n-ZnO particles. Therefore, the orientation distribution of the fillers can be estimated from the distribution of the directions of periodicity.
The results of the orientation analyses are illustrated in Fig. 11. As shown in Fig. 11(a), ‘angle’ in Fig. 11(b)–(e) indicates the inclination of the longer axes of n-ZnO particles from the in-plane x-direction. In case that n-ZnO particles are preferentially aligned along the x-direction, a peak appears around 0° in the angle distribution. The orientation distributions were obtained by averaging the data of homo-PI 5 vol%, homo-PI 22 vol%, blend 5 vol%, and blend 23 vol%. In the homo-PI composite films, n-ZnO particles were preferentially in-plane oriented, both at low and high loadings, which agrees well with the results of the WAXD analysis. On the other hand, in the PI blend films, the fillers are in-plane oriented at a low loading due to the low filler content, which is similar to the case of homo-PI film. In contrast, the peak of the mean amplitude is less distinct at the high loading, wherein the n-ZnO particles were isotropically oriented in the TF-rich phase of the VDP structures on average. The significant enhancement in the TC observed for the PI blend films at higher filler loadings can therefore be attributed to the partial out-of-plane orientation of n-ZnO particles, which leads to more random orientations. This phenomenon originates from the confinement effect and the interfaces formed along the out-of-plane direction in the VDP structure.
Conclusion
The enhancement of the out-of-plane thermal conductivities (λ⊥s) was investigated with homo-PI and immiscible PI blend films containing needle-shaped n-ZnO particles. The vertical double percolation (VDP) structures were successfully formed in the PI blend composite films consisting of sulfur- and fluorine-containing PIs (i.e., SD and TF, respectively) with n-ZnO particles. The PI blend composite films at higher filler loadings demonstrated significantly higher λ⊥ values than the other homo-PI and PI blend films. Moreover, the λ⊥ values are higher than those of the PI blend films with the VDP structures containing pyramidal p-ZnO particles. The analyses of the n-ZnO particle orientation by FE-SEM and WAXD confirmed that the particle orientation gradually changed from in-plane to relatively isotropic in the PI blend composite films with the increasing n-ZnO content, whereas the fillers are in-plane oriented in the homo-PI films. Therefore, the significant enhancement in TC observed in the PI blend composite films is attributable to the increase in the content of vertically oriented n-ZnO particles, which are confined in the TF-rich domains in the VDP structure. Hence, the formation of the VDP structures and the selective incorporation of thermally conductive highly anisotropic inorganic fillers is a very effective strategy for enhancing the thermal conductivity of polymer composite films in the out-of-plane direction.Note added after first publication
This article replaces the version published on 08th March 2017, in which the wrong symbol was included in the caption of Fig. 11.Acknowledgements
The authors thank Dr M. Tokita and Mr T. Wakabayashi of Tokyo Institute of Technology for the help of WAXD measurements, Dr J. Koki of Division of Materials Analysis Ookayama, Tokyo Institute of Technology, and Dr M. Tanimoto of Tokyo Institute of Technology for support of cross-section polisher, and Dr T. Enomae of University of Tsukuba for advice of fibre orientation analysis software. This work is partly supported by Grants-in-Aid for Scientific Research, Japan Society for the Promotion of Science (25288096, 15K13782, and 15K20992). The synchrotron radiation experiments were performed at BL-10C of High Energy Accelerator Research Organization with the approval of the Photon Factory Program Advisory Committee (Proposal No. 2014G708 and 2016G544).Notes and references
- K. Sato, H. Horibe, T. Shirai, Y. Hotta, H. Nakano, H. Nagai, K. Mitsuishi and K. Watari, J. Mater. Chem., 2010, 20, 2749 RSC.
- D. H. Kuo, C. Y. Lin, Y. C. Jhou, J. Y. Cheng and G. S. Liou, Polym. Compos., 2013, 34, 252 CrossRef CAS.
- Q. Jiang, X. Wang, Y. Zhu, D. Hui and Y. Qiu, Composites, Part B, 2014, 56, 408 CrossRef CAS.
- S. Imaizumi, H. Matsumoto, Y. Konosu, K. Tsuboi, M. Minagawa, A. Tanioka, K. Koziol and A. Windle, ACS Appl. Mater. Interfaces, 2011, 3, 469 CAS.
- S. Chandrasekaran, C. Seidel and K. Schulte, Eur. Polym. J., 2013, 49, 3878 CrossRef CAS.
- S. Yu, P. Hing and X. Hu, Composites, Part A, 2002, 33, 289 CrossRef.
- H. B. Cho, Y. Tokoi, S. Tanaka, H. Suematsu, T. Suzuki, W. Jiang, K. Niihara and T. Nakayama, Compos. Sci. Technol., 2011, 71, 1046 CrossRef CAS.
- Z. Lin, Y. Lin, S. Raghavan, K. S. Moon, S. K. Sitaraman and C. P. Wong, ACS Appl. Mater. Interfaces, 2013, 5, 7633 CAS.
- C. Yuan, B. Duan, L. Li, B. Xie, M. Huang and X. Luo, ACS Appl. Mater. Interfaces, 2015, 7, 13000 CAS.
- H. B. Cho, T. Nakayama, Y. Tokoi, S. Endo, S. Tanaka, T. Suzuki, W. Jiang, H. Suematsu and H. Niihara, Compos. Sci. Technol., 2010, 70, 1681 CrossRef CAS.
- X. Li, Y. Chen, S. M. L. Jia and X. Shao, Thermochim. Acta, 2014, 595, 6 CrossRef CAS.
- M. H. Tsai, I. H. Tseng, J. C. Chiang and J. J. Li, ACS Appl. Mater. Interfaces, 2014, 6, 8639 CAS.
- D. Yorifuji and S. Ando, Macromol. Chem. Phys., 2010, 211, 2118 CrossRef CAS.
- D. Yorifuji and S. Ando, J. Mater. Chem., 2011, 21, 4402 RSC.
- M. Tanimoto, T. Yamagata, K. Miyata and S. Ando, ACS Appl. Mater. Interfaces, 2013, 5, 4374 CAS.
- T. Iwamura, S. Goto, M. Sakaguchi and Y. Chujo, Chem. Lett., 2016, 45, 508 CrossRef CAS.
- T. Hashimoto, J. Morikawa, T. Kurihara and T. Tsuji, Thermochim. Acta, 1997, 304/305, 151 CrossRef CAS.
- J. Morikawa and T. Hashimoto, J. Appl. Phys., 2009, 105, 113506 CrossRef.
- T. Enomae, Y. H. Han and A. Isogai, J. Wood Sci., 2008, 54, 300 CrossRef.
- Y. H. Han, T. Enomae, A. Isogai, H. Yamamoto, S. Hasegawa, J. J. Song and S. W. Jang, Stud. Conserv., 2006, 51, 267 CrossRef.
- T. Enomae, Y. H. Han and A. Isogai, Nord. Pulp Pap. Res. J., 2006, 21, 253 CAS.
- K. Murakami, K. Yamada, K. Deguchi, T. Shimizu and S. Ando, J. Photopolym. Sci. Technol., 2010, 23, 501 CrossRef CAS.
- Powder Diffraction Files, Joint Committee on Powder Diffraction Standards, ASTM, Philadelphia, PA, 1967, Card 36-1451.
- Y. Shoji, T. Higashihara, M. Tokita, J. Morikawa, J. Watanabe and M. Ueda, ACS Appl. Mater. Interfaces, 2013, 5, 3417 CAS.
- L. Znaidi, G. J. A. A. S. Illia, S. Benyahia, C. Sanchez and A. V. Kanaev, Thin Solid Films, 2003, 428, 257 CrossRef CAS.
Footnote |
| † Electronic supplementary information (ESI) available. See DOI: 10.1039/c7ra00760d |
| This journal is © The Royal Society of Chemistry 2017 |

