
 Open Access Article
 This Open Access Article is licensed under a Creative Commons Attribution-Non Commercial 3.0 Unported Licence
Enhancement of the magnetoresistive property by introducing disorder in the (La1−xYx)0.7Ca0.3MnO3 compound
Sanjib Banik *a,
Kalipada Dasb and
I. Dasa
*a,
Kalipada Dasb and
I. Dasa
aSaha Institute of Nuclear Physics, HBNI, 1/AF, Bidhannagar, Kolkata 700064, India. E-mail: sanjib.banik@saha.ac.in
bIndian Association for the Cultivation of Science, 2A & 2B Raja S. C. Mullick Road, Jadavpur, Kolkata 700032, India
First published on 15th March 2017
Abstract
An extraordinarily large magnetoresistance (MR) has been achieved in La0.7Ca0.3MnO3 by optimal substitution. To explore the origin of this giant enhancement of MR, we have carried out magnetic and magnetotransport measurements of (La1−xYx)0.7Ca0.3MnO3 (x = 0, 0.4, 0.5, 0.6, and 1) compounds in detail. Our analysis indicates that the disorder introduced by yttrium substitution plays the crucial role in the magnetoresistive properties in this series. A large MR has been observed in optimally doped (La0.5Y0.5)0.7Ca0.3MnO3 (x = 0.5). In this compound, an MR value as high as 1.5 × 10⁷% at a temperature of 50 K and 3.6 × 10⁴% at 80 K has been achieved for an external magnetic field of 90 kOe. Moreover at 80 K, for the x = 0.5 compound, the MR is reversible in nature. The extraordinarily enhanced and large MR value has been described using a phenomenological model of percolation via ferromagnetic clusters.
1 Introduction
Doped perovskite manganites R1−xAxMnO3 (R = rare earth element, A = divalent element) have always been an attractive field of research over the last two decades from both a fundamental and applications point of view.1 The strong interplay between different degrees of freedom like charge, spin ordering, and orbital ordering makes manganite systems extremely sensitive to different external perturbations like chemical doping, temperature, pressure, magnetic field etc. Among the various intriguing properties, colossal magnetoresistance (CMR),2–7 which is the change in the electrical resistance by several orders of magnitude due to the application of an external magnetic field, is a fascinating property primarily because of its potential application in magnetic field sensors.8–10Usually, CMR occurs near first order magnetic transitions. In 1994, Jin et al.11 observed a huge MR of about 1400% around 200 K for a magnetic field of 60 kOe in a La0.67Ca0.33MnO3 thin film near the paramagnetic to ferromagnetic transition temperature. In a review article, Ramirez12 also discussed CMR near the paramagnetic to ferromagnetic transition. Recently Das et al. have shown the enhancement of MR, in charge ordered nanoparticles because of the appearance of surface ferromagnetism13 and in core–shell nanostructure because of the influence of ferromagnetism on antiferromagnetic charge ordered clusters.14
The motivation of the present study is to find out whether MR can be enhanced by introducing disorder in a system, in contrast to generally observed facts. According to Rodríguez-Martínez and Attfield,15 disorder can be quantified by the variance of the A-site ionic radii distribution, σ2 = ∑yiri2 − 〈ri〉2, where 〈ri〉 is the average A-site ionic radius, and yi is the fractional occupancies of the ith ion on the A-site. Dong et al.16 have shown that A-site cation size disorder puts the ferromagnetic system into a short-range cluster glass state. Rivas et al.17 have also shown that quenched disorder arising from A-site ionic disorder suppresses the first order magnetic phase transition. In another report, Hwang et al.18 described a universal behavior of R0.7A0.3MnO3 compounds which showed the transition of the ferromagnetic system to a spin glass state below a particular A-site ionic radius 〈rA〉. Reduction of 〈rA〉 leads to a decrease of the Mn–O–Mn bond angle which enhances lattice distortion. Following their work, Teresa et al.19 also showed the evolution from a long range ferromagnetic (FM) to spin glass (SG) insulator state in (La1−xTbx)2/3A1/3MnO3. Therefore, by tuning the lattice distortion by changing the A-site ionic radius together with quenched disorder one can change the transition from first order to second order. This enhances disorder resistivity because of the magnetic disorder. This enhanced magnetic disorder can be suppressed by applying an external magnetic field and may lead to the enhancement of MR.
Among the different manganite families of materials, one of the most well known CMR compounds is La0.7Ca0.3MnO3 which has a first order ferromagnetic transition20 around the Curie temperature TC ∼ 223 K. It is a strongly correlated system having strong electron–phonon coupling and shows strong Jahn–Teller (JT) distortion.21 This correlation can be modified by introducing Y3+ ions in the place of La3+ ions. In spite of being a CMR material, La0.7Ca0.3MnO3 has only 3.7 × 10²% MR at 233 K for a magnetic field of 60 kOe.22 To increase the MR value we have prepared and studied in detail transport and magnetotransport properties in (La1−xYx)0.7Ca0.3MnO3 compounds with different Y concentrations.
2 Sample preparation and characterization
All of the polycrystalline bulk samples, (La1−xYx)0.7Ca0.3MnO3 (x = 0, 0.4, 0.5, 0.6, and 1), have been prepared by the well known sol–gel method.4 To prepare the samples, high purity (>99.9%) La2O3, Y2O3 and CaCO3 were used as raw materials. An appropriate amount of pre-heated oxides and carbonate was converted to their nitrates by adding nitric acid and aqueous solutions of them were prepared. After this, all of the solutions were mixed together with the required amount of citric acid and were heated at 80–90 °C in a heat bath until a gel was formed. After decomposing the gels, black porous powders were obtained which after preheating at 400 °C were pelletized and heated finally at 1300 °C for 36 hours to make bulk polycrystalline samples.The phase purity of all the samples was verified by performing room temperature X-ray diffraction (Cu-Kα radiation of wavelength λ = 1.54 Å) measurements. Scanning electron microscopy (SEM) measurements were performed to identify the morphology and grain size of the samples. Magnetic measurements were carried out using SQUID VSM. Electrical transport and magnetotransport measurements were performed using a four probe technique in a longitudinal geometry on the bar-shaped samples.
3 Results and discussion
Room temperature X-ray diffraction studies confirm the single phase nature of the polycrystalline compounds (La1−xYx)0.7Ca0.3MnO3 (x = 0, 0.4, 0.5, 0.6, and 1). All these compounds belong to the ‘Pnma’ space group. The lattice parameters of the compounds were determined by profile fitting the XRD data using FULLPROF software. For a representative X-ray diffraction pattern, an XRD pattern of the x = 0.5 compound along with simulated data is shown in Fig. 1(A). Using the lattice parameters, orthorhombic distortion defined by and the unit cell volume were calculated and their corresponding variations are indicated in Fig. 1(B). An enhancement of the lattice distortion and decrease of the unit cell volume have been observed with the increase of Y concentration. SEM images show the well-connected micron-sized grains of the compounds and a representative figure for the x = 0.5 compound is shown in the inset of Fig. 1(A).
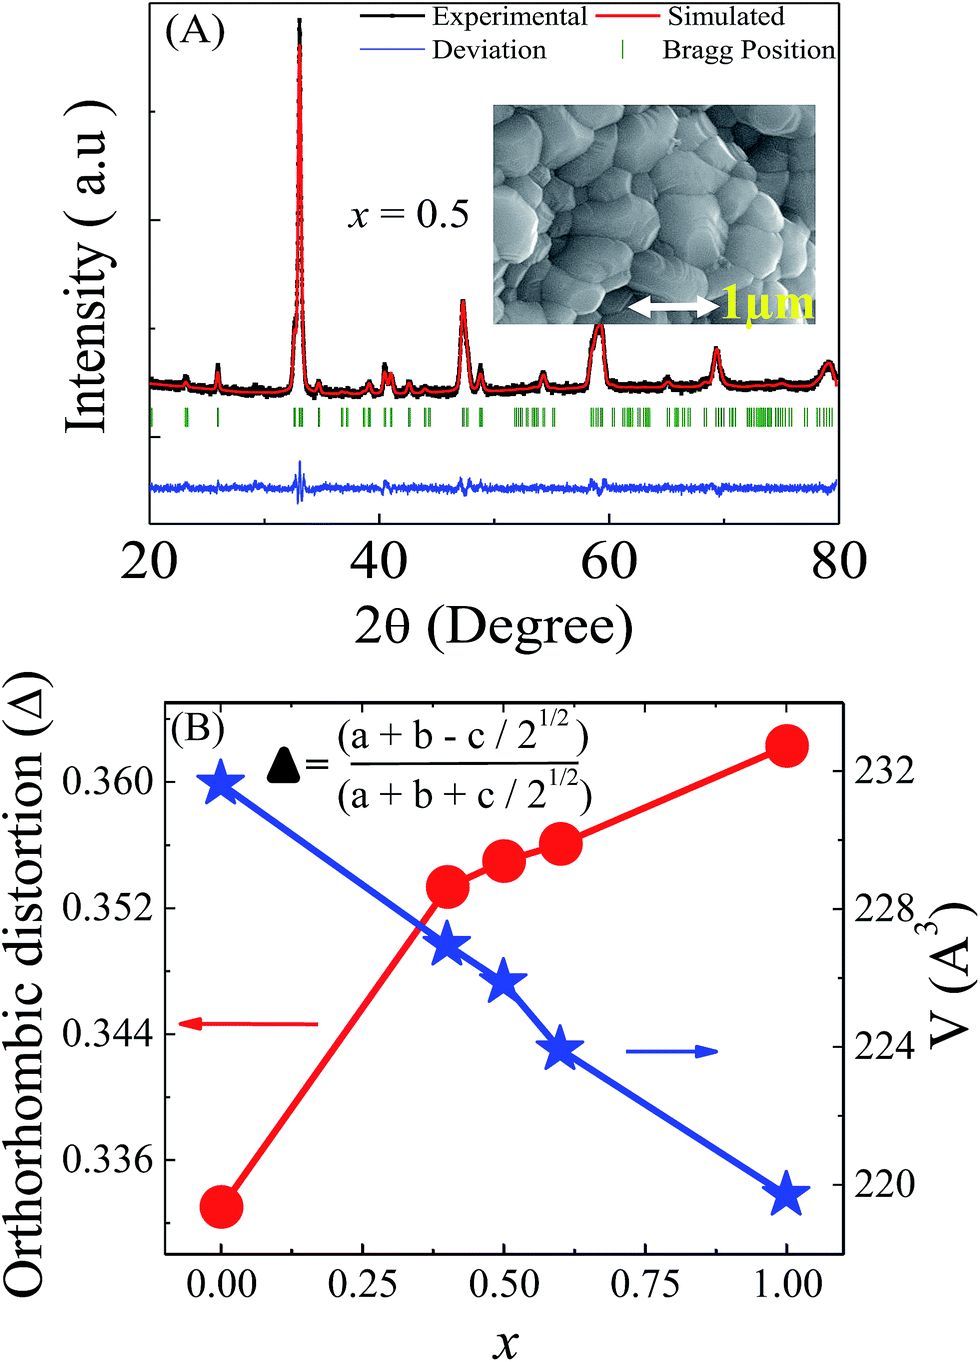 | ||
| Fig. 1 (A) X-ray diffraction pattern with profile fitted data of the (La1−xYx)0.7Ca0.3MnO3 (x = 0.5) compound and its SEM image in the inset. (B) Orthorhombic distortion and unit cell volume with different Y concentrations. | ||
Electrical transport and magnetotransport properties in perovskite manganite materials are greatly influenced by lattice distortion. Measurements of the resistivity as a function of temperature ρ(T) of all the polycrystalline bulk samples were performed in the absence and presence of a 90 kOe external magnetic field (Fig. 2). All of these measurements were carried out during a warming cycle from low temperature (2 K) to room temperature after cooling in zero field. From the zero field data, it can be seen that with an increase of the Y concentration from x = 0 to x = 0.4, the metal to insulator transition temperature (TMI) decreases from 220 K to 100 K. With a further increase of the Y concentration, x = 0.5 and above, the metal–insulator transition vanishes. Such a modification from a metallic to insulator state corresponds to the conversion of the system from a ferromagnetic to glassy state.23 As a result, with increasing x from x = 0.5, the length over which magnetic moments are correlated ferromagnetically decreases significantly which causes the insulating nature of the compounds. On application of a 90 kOe external magnetic field, ρ values do not change significantly in the spontaneously melted samples. This field value affects only TMI and changes it from 220 K to 250 K in the x = 0 sample and 100 K to 150 K in the x = 0.4 sample. Surprisingly a huge suppression of the resistivity of 106 order has been observed in the x = 0.5 sample on the application of the 90 kOe magnetic field at around 50 K. However, the magnetic field has a lower impact on ρ(T) for the x = 0.6 sample. Thus, here x = 0.5 is the optimum composition where correlated ferromagnetic regions do not create a sufficient percolation path in the absence of a magnetic field at low temperature (T < 100 K) and the metal–insulator transition does not take place. On application of a magnetic field, these correlated ferromagnetic regions connect and create a path for conduction. On the other hand, in the x = 0.6 sample, a 90 kOe magnetic field is not enough to create a percolation path for conduction.
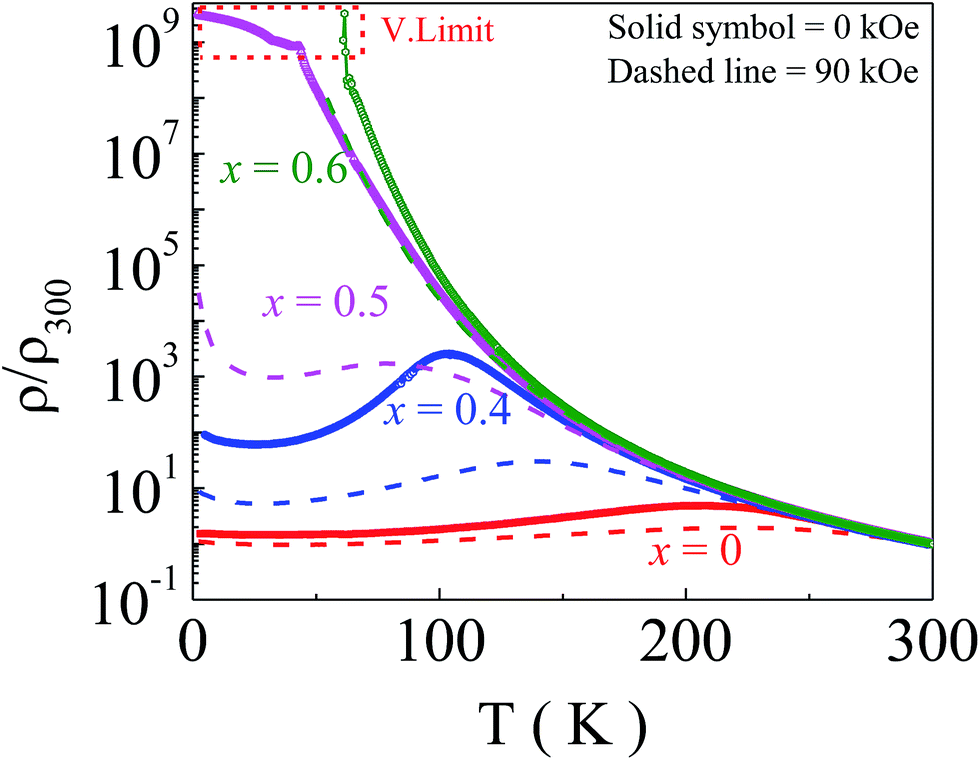 | ||
| Fig. 2 Temperature variation of reduced resistivity of the polycrystalline compounds with x = 0, 0.4, 0.5, and 0.6 in the absence of a magnetic field (solid symbol) and in the presence of a 90 kOe magnetic field (dotted line). Here, resistivity data for the x = 1 composition has not been shown since the 90 kOe magnetic field causes no significant modification in resistivity. | ||
Magnetization measurements as a function of temperature [M(T)] and also as a function of magnetic field [M(H)] were performed for all of the samples. Fig. 3(A) shows the zero field cooled warming (ZFCW) and field cooled warming (FCW) magnetization as a function of temperature in the presence of a 1 kOe external magnetic field for the samples with x = 0, 0.4, 0.5, 0.6, and 1. An increased bifurcation between ZFCW and FCW with increasing ‘x’ has been observed which is one of the signatures of glassy behavior. Reduction of the Curie temperature (TC) and suppression of the magnetization are observed for the FCW magnetization with increasing Y concentration. With the increase of ‘x’, the A-site ionic radius decreases which results in the decrease of the Mn–O–Mn bond angle and an increase of MnO6 octahedra distortion. This distortion diminishes the strength of double exchange (DE) interactions between Mn ions around the octahedra and hence favors an antiferromagnetic insulator state as the ground state rather than a ferromagnetic metallic state. At the same time, with an increase of the Y concentration σ2 increases from 2.7 × 10⁻⁴ when x = 0 to 3.7 × 10⁻³ when x = 0.5. This enhanced σ2 when x = 0.5 randomizes the distribution of Mn–O–Mn bond angles, which results in the decrease of the length over which ferromagnetic metallic correlation exists. These correlated regions are ferromagnetic clusters which interact with each other by a dipolar interaction. The anisotropic nature of this dipolar interaction randomizes the clusters’ orientations, which suppresses the magnetization and enhances the electrical resistivity.
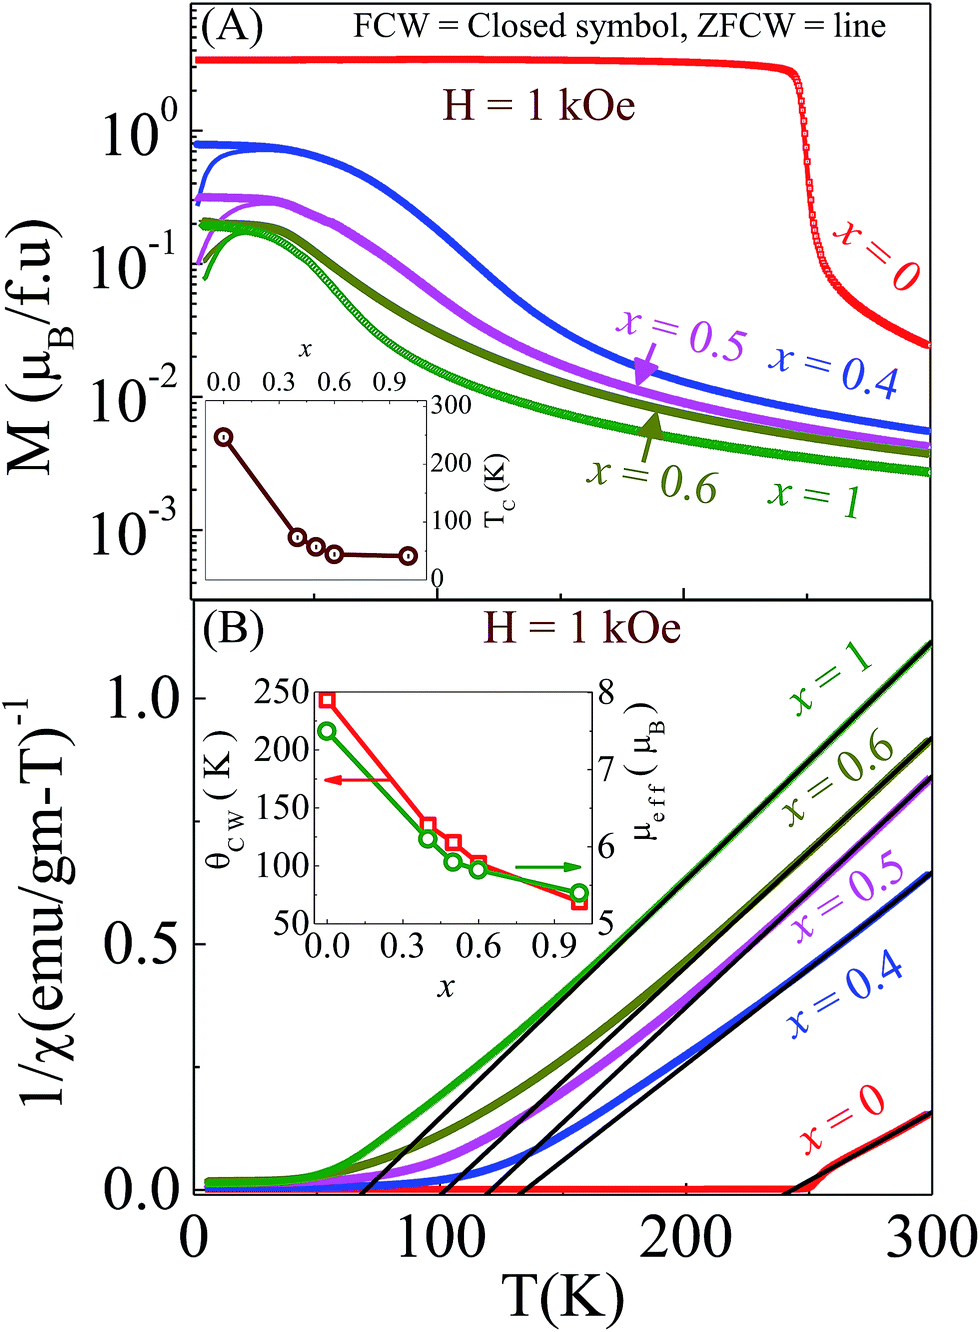 | ||
| Fig. 3 (A) Zero field cooled warming (ZFCW) and field cooled warming (FCW) magnetisation data as a function of temperature for the (La1−xYx)0.7Ca0.3MnO3 (x = 0, 0.4, 0.5, 0.6, and 1) samples. Inset in the figure indicates the modification of TC with Y concentration. (B) Variation of the inverse susceptibility with temperature for the samples and their corresponding Curie–Weiss fitted data. Black lines are the Curie–Weiss fitted curves. Variation of the Curie–Weiss temperature and effective paramagnetic moment with Y concentration is shown in the inset. | ||
To understand more clearly the magnetic interaction between Mn moments, the paramagnetic region of the inverse dc susceptibility (H/M) with temperature data was fitted with the Curie–Weiss law of the form χ = C/(T − θCW) and C = μeff2/3kB where μeff is the effective magnetic moment in Bohr magnetons and θCW is the paramagnetic Curie temperature. Fig. 3(B) shows the linear fitting of 1/χ vs. T data with the Curie–Weiss law for all the samples. From the fitting, the Curie–Weiss temperature (θCW) and effective paramagnetic moment (μeff) have been calculated, which is shown in the inset of Fig. 3(B). For the parent compound (x = 0) θCW ∼ TC, but for other concentrations larger values of θCW compared to their corresponding TC values were observed. These larger values of θCW in the Y doped samples compared with their corresponding TC imply the formation of short range magnetic ordering before the Curie temperature. The calculated μeff values show a gradual decreasing nature with x. Another point to be noted here is that the μeff values of the samples are higher than the theoretical value of 4.62 μB for an effective Mn ion. This result indicates that the high-temperature paramagnetism comes from the individual magnetic entities containing more than one Mn ion. These results imply that the samples consist of FM clusters which form at higher temperatures (>TC).24,25
To determine the low-temperature ground state of the samples, isothermal magnetization measurements (Fig. 4) were performed at T = 5 K and the external magnetic field was up to 70 kOe. Nearly saturation tendency has been observed up to the composition x = 0.4 but at and above x = 0.5 there is a gradually increasing tendency in the magnetization even at 70 kOe field. A huge enhancement of coercivity and a reduction of the magnetisation value at H = 70 kOe with increasing ‘x’ were observed, which are signatures of enhanced magnetic disorder.
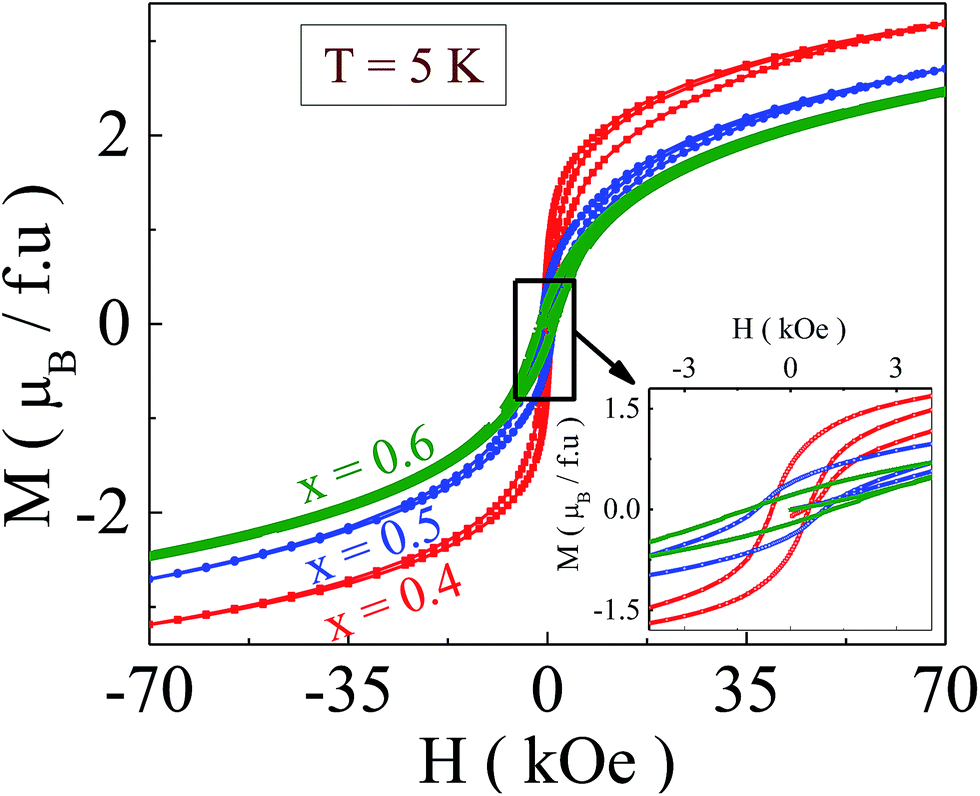 | ||
| Fig. 4 Magnetisation as a function of magnetic field at a temperature of 5 K for the samples with x = 0.4, 0.5 and 0.6. The inset shows a zoomed portion near the origin to show the enhancement of coercivity with an increase of x. | ||
Finally, magnetotransport studies were carried out by performing magnetoresistance MR (%) calculations. Since in the present case with the conventional definition of magnetoresistance,  , MR saturates at 100% in the low temperature and high field region, here another useful definition,26 generally used for CMR materials, has been considered i.e.
 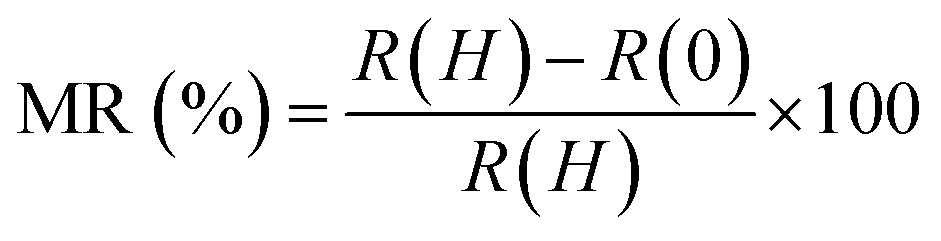 , where R(H) is the resistance of a magnetic field and R(0) is the resistance in the absence of a magnetic field. Fig. 5 shows the temperature variation of MR, calculated from zero field and 90 kOe external field resistivity data, for the samples. Compared to the x = 0 compound, an enhancement of MR occurs for all the other samples in the entire temperature range. At low temperature (below 80 K), especially for the x = 0.5 compound, the MR value supersedes the value of all the other samples and it becomes very large, 107%, at 50 K.
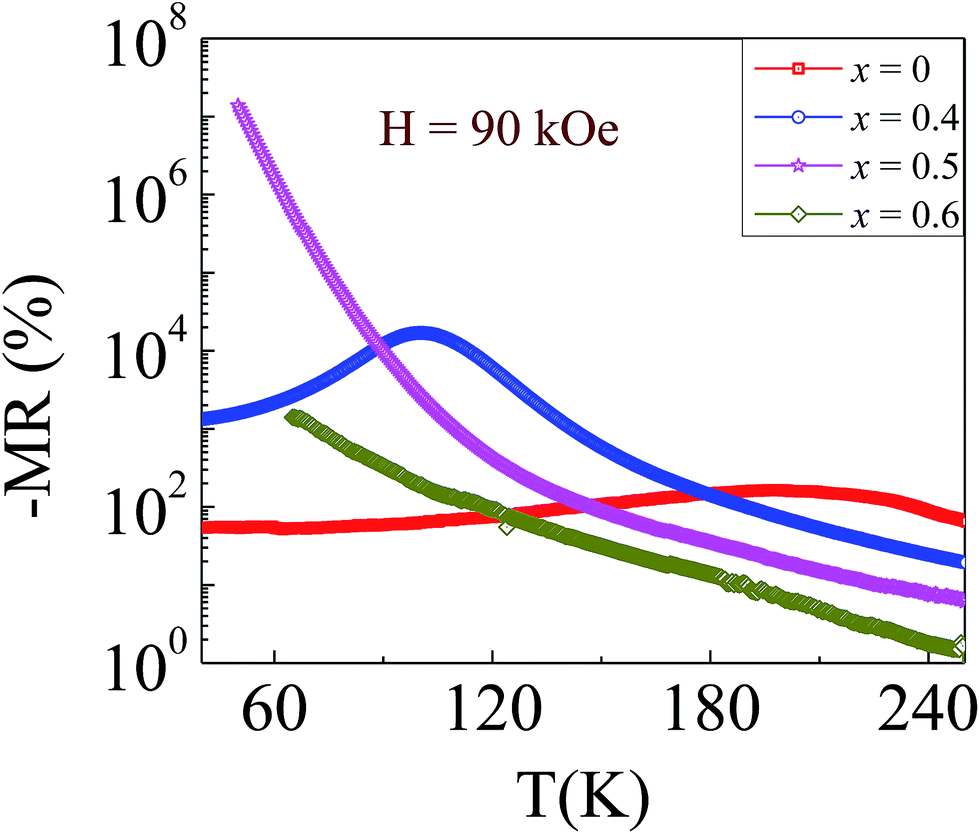 | ||
| Fig. 5 Variation of the magnetoresistance with temperature for the samples with x = 0, 0.4, 0.5, and 0.6. | ||
The field variation of MR at 80 K (Fig. 6) has also been studied for the x = 0.4, 0.5 and 0.6 compounds. The MR value at a magnetic field of 90 kOe increases from 6 × 10³% in the x = 0.4 compound to 3.6 × 10⁴% in the x = 0.5 compound, whereas it reduces when x = 0.6 to 7 × 10²%. In the inset of Fig. 6 the resistance as well as the magnetization at 80 K with an external magnetic field is shown. The values of the resistance and magnetization remain almost unchanged even after field cycling, which shows the reversible nature of the compound.
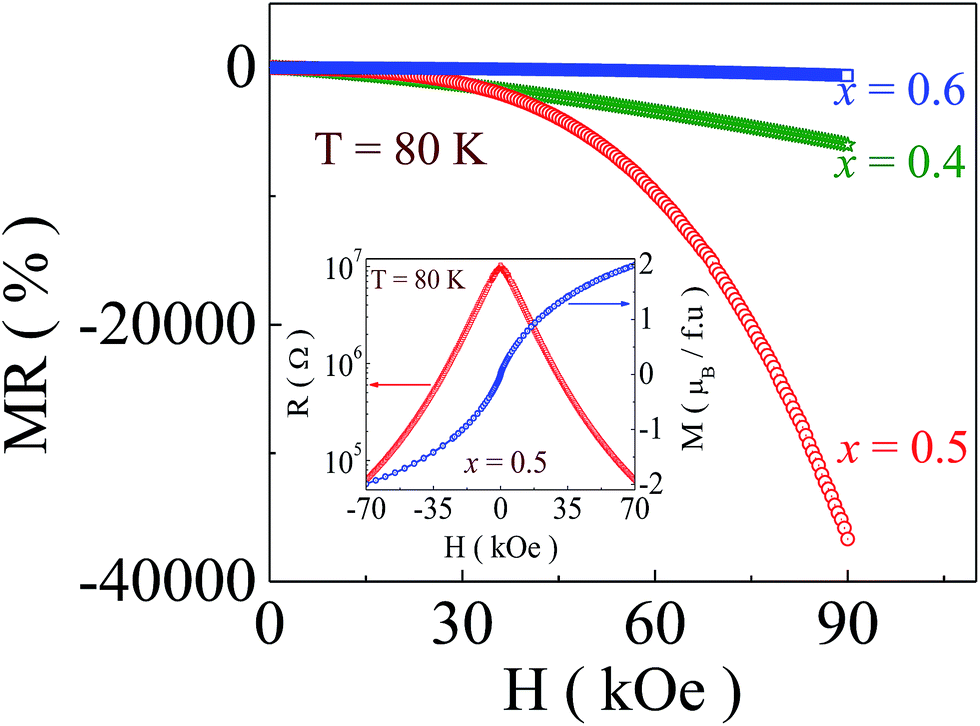 | ||
| Fig. 6 MR as a function of magnetic field at 80 K for the x = 0.4, 0.5, and 0.6 compounds and in the inset, the variation of resistance and magnetisation for the x = 0.5 compound with magnetic field is shown. | ||
To know the origin of this extraordinary enhancement of MR in the x = 0.5 compound compared with the other samples, isothermal magnetization measurements of the x = 0.4, 0.5 and 0.6 compounds were carried out. As it was discussed earlier from the susceptibility data that all the samples consist of ferromagnetic clusters above TC, M(H) at various temperatures above TC was measured. Considering these magnetic clusters to be nearly non-interacting much above the transition temperature, M(H) data were fitted with a modified Langevin function of the form  , where “L(x)” is the Langevin function, “μ” is the average magnetic moment of the clusters and “N” is the number density of the clusters. The magnetization data fitted well with this modified Langevin function. From the fitting of the M(H) data, the average cluster moment μ and cluster density N at different temperatures have been estimated and are shown in Fig. 7(A) and a representative plot fitting M(H) data at 150 K for the x = 0.4, 0.5 and 0.6 samples is shown in Fig. 7(B).
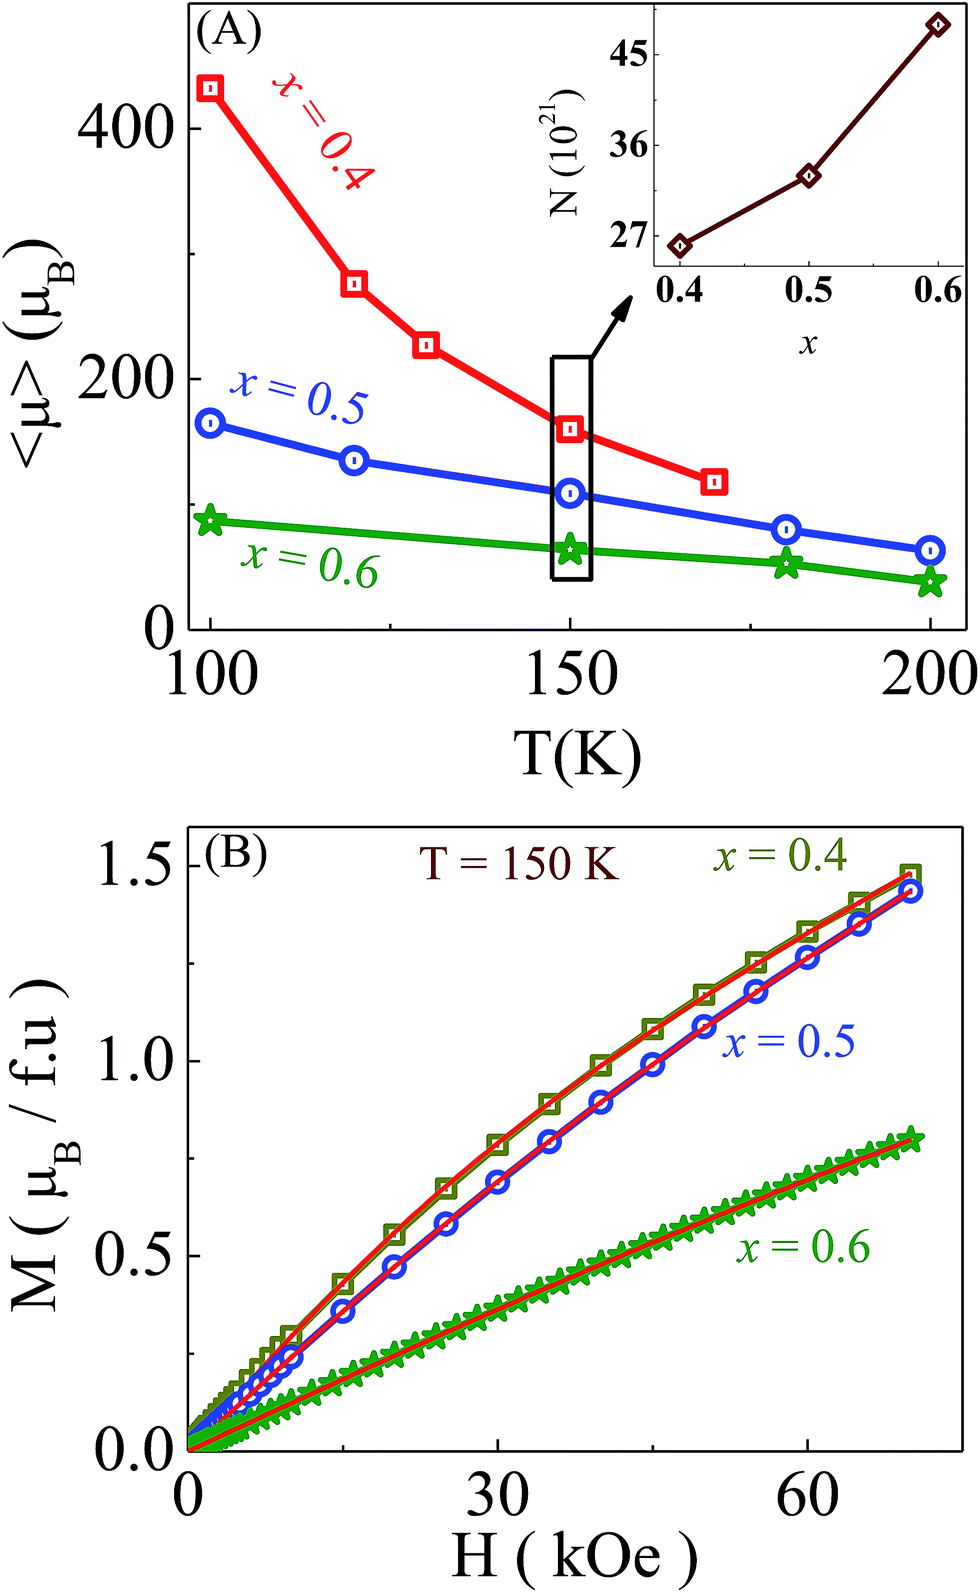 | ||
| Fig. 7 (A) Variation of the magnetic cluster size with temperature for the x = 0.4, 0.5 and 0.6 compounds and in the inset, the variation of cluster density at 150 K for the x = 0.4, 0.5 and 0.6 compounds is shown. (B) Fitting of M(H) data with a modified Langevin function at 150 K for the x = 0.4, 0.5 and 0.6 samples, where solid red lines are the fitted curves. | ||
From the temperature dependence of the average cluster moments (Fig. 7(A)) for different Y compositions, it is observed that the cluster size reduces with increasing temperature as well as with the increase of Y concentration. For the x = 0.4 sample, the average cluster sizes decrease rapidly with increasing temperature whereas there is a less pronounced effect of temperature on the average cluster moments in other compounds. It is also known that the calculated average moment of the clusters also depends on the magnetic field and they grow in size with an increase of magnetic field which results in the increase of the cluster moment.27 Because of this field dependence of cluster sizes, a suppression of the resistivity occurs which gives rise to the enhancement of the magnetoresistance. Moreover, the reversible nature of resistance and magnetization (inset of Fig. 6) indicates the nearly non-interacting nature of these ferromagnetic clusters at high temperatures (at 80 K and above) which is responsible for the reversible nature of MR at 80 K.
Based on the above results and discussions, a phenomenological model for the large MR in the x = 0.5 compound has been proposed. In the x = 0.4 compound, cluster sizes are large in zero magnetic field, and below TMI they connect and create a percolation path for electrical transport. This leads to a suppression of the resistivity and the applied magnetic field further increases this percolation path by increasing the cluster size and a further diminishing of the resistivity occurs. On the other hand, in the x = 0.5 compound and in the absence of any external magnetic field, these FM clusters were disconnected, and as a result the sample was an insulator in nature. With the application of an external magnetic field these clusters grow in size and create the percolation path, and the field induced metal–insulator transition occurs which results in a large MR. However, for the x = 0.6 compound even a 90 kOe magnetic field is not enough to create the percolation path by growing the cluster size. Fig. 8 shows a pictorial view of the effect of an external magnetic field on the cluster sizes with the compositions of x = 0.4, 0.5 and 0.6.
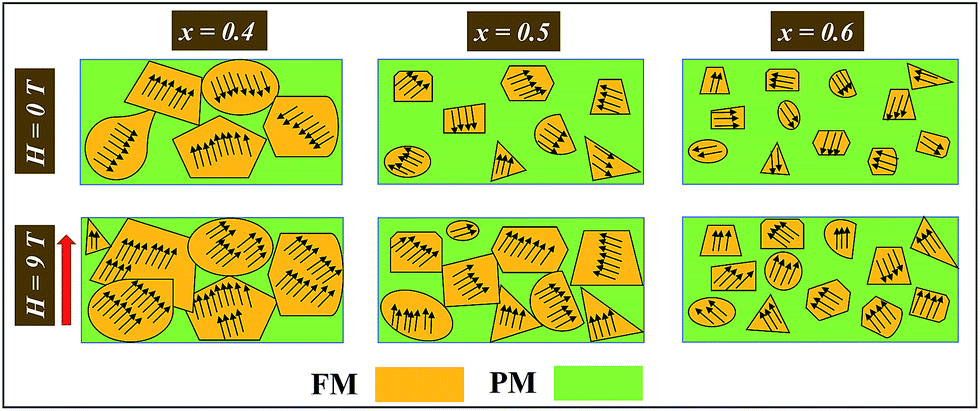 | ||
| Fig. 8 Schematic to describe the enhanced magnetoresistance in the x = 0.5 compound. | ||
4 Conclusions
In summary, a large MR has been achieved in (La0.5Y0.5)0.7Ca0.3MnO3 by controlling the magnetic disorder via tuning the lattice distortion together with quenched disorder. Reversibility of the magnetoresistance is due to the presence of non-interacting ferromagnetic clusters. This study reveals that a large enhancement of MR can be achieved by introducing disorder and shows a way to find promising magnetoresistive materials. An enhanced magnetoresistance in the x = 0.5 compound is described using a phenomenological model of the percolation path created by ferromagnetic clusters.Acknowledgements
This work has been supported by the CMPID project of SINP and funded by the Department of Atomic Energy (DAE), Govt of India.References
- M. B. Salamon and M. Jaime, Rev. Mod. Phys., 2001, 73, 583 CrossRef CAS.
- Colossal Magnetoresistance, Charge ordering and Related Properties of Manganese Oxides, ed. C. N. R. Rao and R. Raveau, World Scientific, Singapore, 1998 Search PubMed.
- H. Kuwahara, Y. Tomioka, A. Asamitsu, Y. Moriotomo and Y. Tokura, Science, 1995, 270, 961 CAS.
- A. Biswas, T. Samanta, S. Banerjee and I. Das, Appl. Phys. Lett., 2008, 92, 012502 CrossRef.
- Y. Tokura, Rep. Prog. Phys., 2006, 69, 797 CrossRef CAS.
- S. Dong, F. Gao, Z. Q. Wang, J. M. Liu and Z. F. Ren, Appl. Phys. Lett., 2007, 90, 082508 CrossRef.
- S. Dong, R. Yu, S. Yunoki, J.-M. Liu and E. Dagotto, Phys. Rev. B: Condens. Matter Mater. Phys., 2008, 78, 064414 CrossRef.
- Colossal Magnetoresistive Oxides, ed. Y. Tokura, Gordon and Breach Science, Amsterdam, 2000 Search PubMed.
- Contribution to Colossal Magnetoresistance Oxides, Monographs in Condensed Matter Science, ed. Y. Tokura, Gordon and Breach, London, 1999 Search PubMed.
- Y. K. Liu, Y. W. Yin and X. G. Li, Chin. Phys. B, 2013, 22, 87502 CrossRef.
- S. Jin, T. H. Tiefel, M. McCormack, R. a. Fastnacht, R. Ramesh and L. H. Chen, Science, 1994, 264, 413 CAS.
- A. P. Ramirez, J. Phys.: Condens. Matter, 1997, 9, 8171 CrossRef CAS.
- K. Das, P. Dasgupta, A. Poddar and I. Das, Sci. Rep., 2016, 6, 20351 CrossRef CAS PubMed.
- K. Das, R. Rawat, B. Satpati and I. Das, Appl. Phys. Lett., 2013, 103, 202406 CrossRef.
- L. M. Rodríguez-Martínez and J. P. Attfield, Phys. Rev. B: Condens. Matter Mater. Phys., 2000, 63, 24424 CrossRef.
- K. F. Wang, Y. Wang, L. F. Wang, S. Dong, D. Li, Z. D. Zhang, H. Yu, Q. C. Li and J.-M. Liu, Phys. Rev. B: Condens. Matter Mater. Phys., 2006, 73, 134411 CrossRef.
- M. Otero-Leal, F. Rivadulla and J. Rivas, Phys. Rev. B: Condens. Matter Mater. Phys., 2007, 76, 174413 CrossRef.
- H. Hwang, S. Cheong, P. Radaelli, M. Marezio and B. Batlogg, Phys. Rev. Lett., 1995, 75, 914 CrossRef CAS PubMed.
- J. M. De Teresa, M. Ibarra, J. García, J. Blasco, C. Ritter, P. Algarabel, C. Marquina and A. del Moral, Phys. Rev. Lett., 1996, 76, 3392 CrossRef CAS PubMed.
- N. G. Bebenin, R. I. Zainullina, N. S. Bannikova, V. V. Ustinov and Y. M. Mukovskii, Phys. Rev. B: Condens. Matter Mater. Phys., 2008, 78, 64415 CrossRef.
- Y. Tomioka, A. Asamitsu and Y. Tokura, Phys. Rev. B: Condens. Matter Mater. Phys., 2000, 63, 24421 CrossRef.
- R. Mahesh, R. Mahendiran, A. K. Raychaudhuri and C. N. R. Rao, Appl. Phys. Lett., 1996, 68, 2291 CrossRef CAS.
- T. Terai, T. Kakeshita, T. Fukuda, T. Saburi, N. Takamoto, K. Kindo and M. Honda, Phys. Rev. B: Condens. Matter Mater. Phys., 1998, 58, 14908 CrossRef CAS.
- M. M. Saber, M. Egilmez, A. I. Mansour, I. Fan, K. H. Chow and J. Jung, Phys. Rev. B: Condens. Matter Mater. Phys., 2010, 82, 172401 CrossRef.
- M. B. Salamon, P. Lin and S. H. Chun, Phys. Rev. Lett., 2002, 88, 197203 CrossRef CAS PubMed.
- A. Biswas, I. Das and C. Majumdar, J. Appl. Phys., 2005, 98, 1 CrossRef.
- L. Jia, G. J. Liu, J. Z. Wang, J. R. Sun, H. W. Zhang and B. G. Shen, Appl. Phys. Lett., 2006, 89, 122515 CrossRef.
| This journal is © The Royal Society of Chemistry 2017 |