
 Open Access Article
 This Open Access Article is licensed under a Creative Commons Attribution-Non Commercial 3.0 Unported Licence
NIR transmittance tuneability under a magnetic field of colloidal suspensions of goethite (α-FeOOH) nanorods
F. Agrestia,
V. Zina,
S. Barison *a,
E. Sanib,
M. Meuccib,
L. Mercatellib,
L. Nodaria,
S. Rossic,
S. Bobboc and
M. Fabrizioa
*a,
E. Sanib,
M. Meuccib,
L. Mercatellib,
L. Nodaria,
S. Rossic,
S. Bobboc and
M. Fabrizioa
aInstitute of Condensed Matter Chemistry and Technologies for Energy (ICMATE), National Research Council of Italy (CNR), Corso Stati Uniti 4, 35127 Padova, Italy. E-mail: simona.barison@cnr.it
bNational Institute of Optics (INO), National Research Council of Italy (CNR), Largo E. Fermi, 6, 50125 Firenze, Italy
cInstitute of Construction Technologies (ITC), National Research Council of Italy (CNR), Corso Stati Uniti 4, 35127 Padova, Italy
First published on 21st February 2017
Abstract
Goethite (α-FeOOH) nanorods have been synthesized using two different methods, by aging at different temperatures of ferrihydrite suspensions obtained through co-precipitation, or by fast conversion of ferrihydrite through ultrasonic irradiation. The synthesis method and parameters influenced the size and shape of nanoparticles. Stable colloidal suspensions of nanorods have been prepared by purification of the precipitates and subsequent dispersion in deionised water by sonication. The synthesized nanopowders have been characterized by Powder X-ray Diffraction and Scanning Electron Microscopy and the colloidal suspensions by Dynamic Light Scattering and ζ-potential measurements. The magnetic field at nuclei level has been investigated by Mössbauer spectroscopy. Moreover, since a colloidal suspension of goethite is a mineral liquid crystal and due to its peculiar magnetic properties, polarized radiation transmittance of colloids in the UV-vis-NIR range has been determined under different magnetic field directions and intensities. It has been found that the transmittance in the NIR range can be tuned by changing magnetic field direction and strength.
Introduction
Liquid-crystalline colloids of mineral particles are a class of fluids of large interest since they combine the fluidity and anisotropy of liquid crystals with the specific magnetic and transport properties of mineral compounds.1,2 Goethite-based colloids are mineral liquid crystals1 exhibiting peculiar magnetic properties,3 which allows tuning the optical properties of goethite-based colloids by the application of a magnetic field.Goethite (α-FeOOH) is an important ferric compound, widely investigated for water purification, humidity sensing, organic pollutant degradation, coatings, pigments, lithium-ion batteries, as catalysts and for other applications, also thanks to its chemical stability at room temperature, nontoxicity and low cost.4–9 Goethite nanorods have been synthesized using various methods and several studies are still based on the development of their preparation processes, e.g. by the aging of ferrihydrite suspensions obtained through co-precipitation in different conditions. The synthesis parameters can influence the morphology of nanoparticles as well as the optical properties of nanorods colloidal suspensions in water. The most accredited growth mechanism is the dissolution of precursor ferrihydrite nanoparticles and the precipitation of a new phase from homogeneous solutions followed by ageing.10 The use of different Fe(III) salts, pH values, ageing temperatures and concentrations can result in various goethite crystal morphologies,11–13 or in other oxide phases, such as hematite (α-Fe2O3), β-FeOOH and γ-FeOOH. Finally, oriented aggregation occurs, which can provide a route for controlling nanoparticle size, shape and microstructure. In this work, the influence of the synthetic procedure on goethite crystallization and morphology was investigated and, especially, different synthetic procedures have been exploited with the final aim of preparing stable colloids of goethite nanorods in water. Arising from literature,14–17 several processing conditions were investigated in this work to prepare goethite nanorods, e.g. the use of organic (tetraethylammonium hydroxide) or inorganic (NaOH) alkali, various ageing temperatures and times, and various reaction rates. Some studies have been reported in goethite colloids,3,18,19 even though their stability and the optical properties have not been investigated.
Compared to bulk materials,20 goethite nanorods show different magnetic properties, by holding a permanent longitudinal magnetic moment, along particle long axis, probably because of uncompensated surface spins within the anti-ferromagnetic crystal structure. These nanostructures also evince a negative magnetic susceptibility, along the shortest particle dimension, leading to the formation of a lyotropic nematic phase that aligns in magnetic fields:20 the nanorods orient parallel to the field at low intensities, and reorient perpendicularly when the magnetic field passes a threshold.2,21 Thus goethite nanoparticles show symmetries that appear hybrid between those of nematics and ferrofluids.3,22 In particular, aqueous colloidal goethite suspensions show a magnetic-field induced birefringence, called “Majorana phenomenon”,23 that is related to the orientation of anisometric particles by the field. It is possible to observe a clear difference in absorption along the particle axes, i.e. dichroism, with the strongest absorption of polarized light parallel to the long particle axis. This behaviour is very important in the view of application of these fluids as liquid crystals, and directly results from the peculiar magnetic properties of goethite nanorods. In this work, the optical properties of colloids under magnetic field were investigated and the opportunity of tuning the transmittance of polarized light, mainly in the NIR range, by properly applying a magnetic field was demonstrated. This property could open new applications for these colloids such as on Smart Windows24 or Laser-Induced Thermotherapy.25
Experimental
Goethite (α-FeOOH) nanorods have been synthesized using two methods, by the aging at different temperatures of ferrihydrite suspensions obtained through co-precipitation, or by fast conversion of ferrihydrite through ultrasonic irradiation. In the synthesis of goethite nanorods, Fe(NO3)3·9H2O (99% pure, by Sigma-Aldrich) has been used as metal oxide precursor; NaOH (anhydrous pellets, by Carlo Erba) or tetraethylammonium hydroxide (solution, 35 wt% in H2O, by Sigma-Aldrich) have been used to prepare co-precipitation solutions; deionized water (Millipore, Billerica MA, USA, 18.2 MΩ) was used as solvent and base fluid for colloids preparation. Four different samples, named F1, T1, T2 and US1 for convenience, have been prepared by following different synthesis routes described as following.Sample F1 has been prepared by adding dropwise 5 mL of a Fe(NO3)3 solution to 45 mL of NaOH solution at room temperature, leading to a ferrihydrite precipitate which was aged afterwards. Sample T1 has been prepared by adding dropwise the tetraethylammonium hydroxide (TEAH) water solution to 20 mL of Fe(NO3)3 solution at room temperature until the solution reached pH 12, leading to the ferrihydrite precipitate. The sample was aged in an oven. Sample T2 has been prepared by using the same procedure used for sample T1 but adding NaOH solution instead of TEAH until reaching pH 12. Sample US1 has been prepared by adding all at once TEAH water solution (5 mL) to 20 mL of a Fe(NO3)3 solution at room temperature, leading to a ferrihydrite precipitate. The mixture has been treated subsequently by ultrasound irradiation. Details of process parameters are reported in Table 1.
| Sample | Fe(III)-salt | Alkali | Temperature | pH | Ageing | Final pH |
|---|---|---|---|---|---|---|
| F1 | Fe(NO3)3 0.06 M | NaOH 1.5 M | RT | — | 3 days at RT | 11 |
| T1 | Fe(NO3)3 0.1 M | 35 wt% TEAH water solution | RT | 12 | 24 h at T = 60 °C | 12 |
| T2 | Fe(NO3)3 0.1 M | NaOH 2.5 M | RT | 12 | 24 h at T = 60 °C | 12 |
| US1 | Fe(NO3)3 0.1 M | 35 wt% TEAH water solution | 30 °C | pH > 13 | 1 h ultrasonic irradiation | 12 |
After the ageing period, the obtained goethite precipitate of each sample has been washed several times with water followed by centrifugation and the pH adjusted. The 0.1 wt% stable colloids have been obtained by proper dilution and 5 min ultrasound irradiation using a Sonics VCX130 (Sonics & Materials, Inc.) operating at 20 kHz and 130 W, equipped with a 6 mm diameter Ti6Al4V alloy tip, operated at 70% power. Final pH was adjusted for all colloids with NaOH.
A Sigma Zeiss field emission SEM operated at 5 kV was used for the microstructural characterization of nanopowders. A Malvern Zetasizer Nano ZS exploiting the dynamic light scattering (DLS) technique was used for the evaluation of aggregate size distribution within the colloids and ζ-potential. X-ray diffraction (XRD) measurements have been carried out with a Philips PW 3710 diffractometer in the Bragg–Brentano geometry and equipped with a CuKα source (40 kV, 30 mA); phase purity, structural and microstructural parameters have been evaluated by Rietveld refinement using the software MAUD.26
Mössbauer spectroscopy was performed on a conventional constant acceleration spectrometer, with a room-temperature Rh matrix 57Co source, nominal strength 1850 MBq. The experiments were performed at room temperature, RT, and at 20 K, by means of an ARS® close circuit cryostat. The hyperfine parameters isomer shift (δ), quadrupole shift (ε) or quadrupole splitting (Δ) when magnetic coupling is absent, and full line-width at half maximum (Γ) were expressed in mm s−1, while internal magnetic field (B) in Tesla and the relative area (A) in %. RT spectra were fitted using a distribution of hyperfine field while those at 20 K were fitted to Lorentzian line shapes with the minimum number of sextets. A deviance of ±0.03 mm s−1 from the obtained value was assigned to δ, ε (or Δ) and Γ, while ±0.1 T to B, and ±2% to A. The δ is quoted to RT α-Fe calibration.
Optical transmittance of colloids in the UV-vis-NIR range have been determined under different magnetic field intensities and directions with respect to light polarization using a Perkin-Elmer Lambda 900 spectrometer. The spectral resolution is 2 nm, while the uncertainty on transmittance values can be taken as 2%. Different values of magnetic field have been created during optical measurements using permanent magnets. The magnetic field has been measured using a Bell 640 Incremental Gaussmeter and a transverse probe 5 mm large and 1 mm thick. The probe was put at the centre of the magnetic field corresponding to the optical measurement point.
Results and discussion
The four synthesis routes presented in the experimental section have been based on the conversion of ferrihydrite by ageing in alkaline conditions at different temperatures or by fast conversion using ultrasonic irradiation. The syntheses F1 and T2 were modelled after Atkinson et al.,27 but some parameters were changed to tailor nanoparticles size and shape. The choice of investigating an organic precipitating agent was suggested by Krehula et al.,15 according to which the main difference between NaOH and tetra-methyl ammonium hydroxide is that the initially formed precipitate is completely dissolved on vigorous stirring by using the organic alkali, resulting in homogeneous precipitation conditions for the further synthesis of α-FeOOH. In this work, tetra-ethyl ammonium hydroxide (TEAH) was investigated, that dissociates into tetra-ethyl ammonium, a large cation that can adsorb on iron oxides stabilizing them. Furthermore, the use of sonication in the synthetic process was investigated for the first time, and resulted effective in forming goethite only by using the procedure reported in Table 1.The metal salt chemical nature and starting Fe(III) and alkali concentrations were realized according to references, and, after preliminary syntheses, they were adjusted in order to obtain different morphologies. Intermediate and final products have been characterized by XRD. Fig. 1 shows an XRD profile of sample F1 red precipitate precursor obtained by co-precipitation. It is the typical profile of ferrihydrite characterized by very broad peaks.28 All other samples showed very similar profiles, so only that of representative sample F1 is shown here for brevity. XRD profiles of samples after ageing have been analysed by Rietveld refinement. As shown in Fig. 2 the complete conversion to goethite has been achieved for all samples.
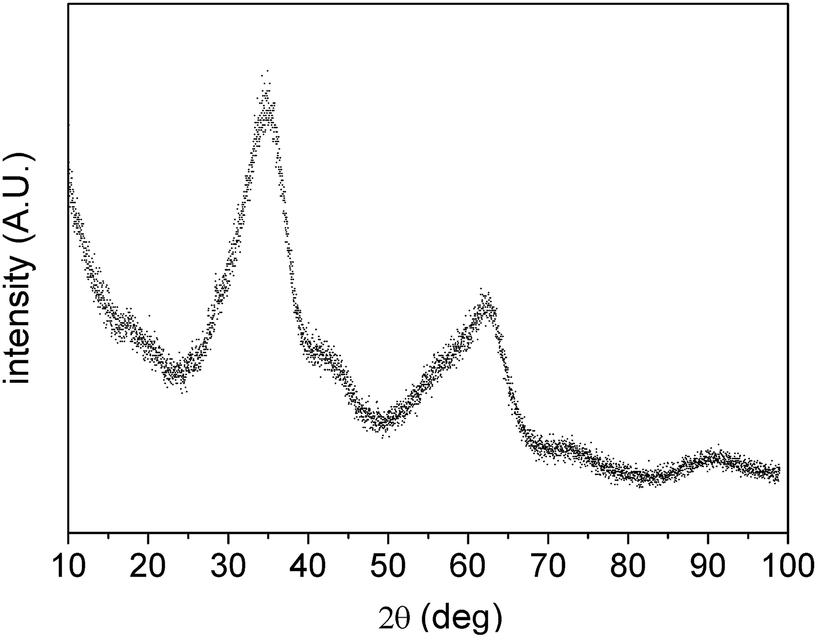 | ||
| Fig. 1 XRD profile of ferrihydrite precipitate obtained during the preparation of sample F1. | ||
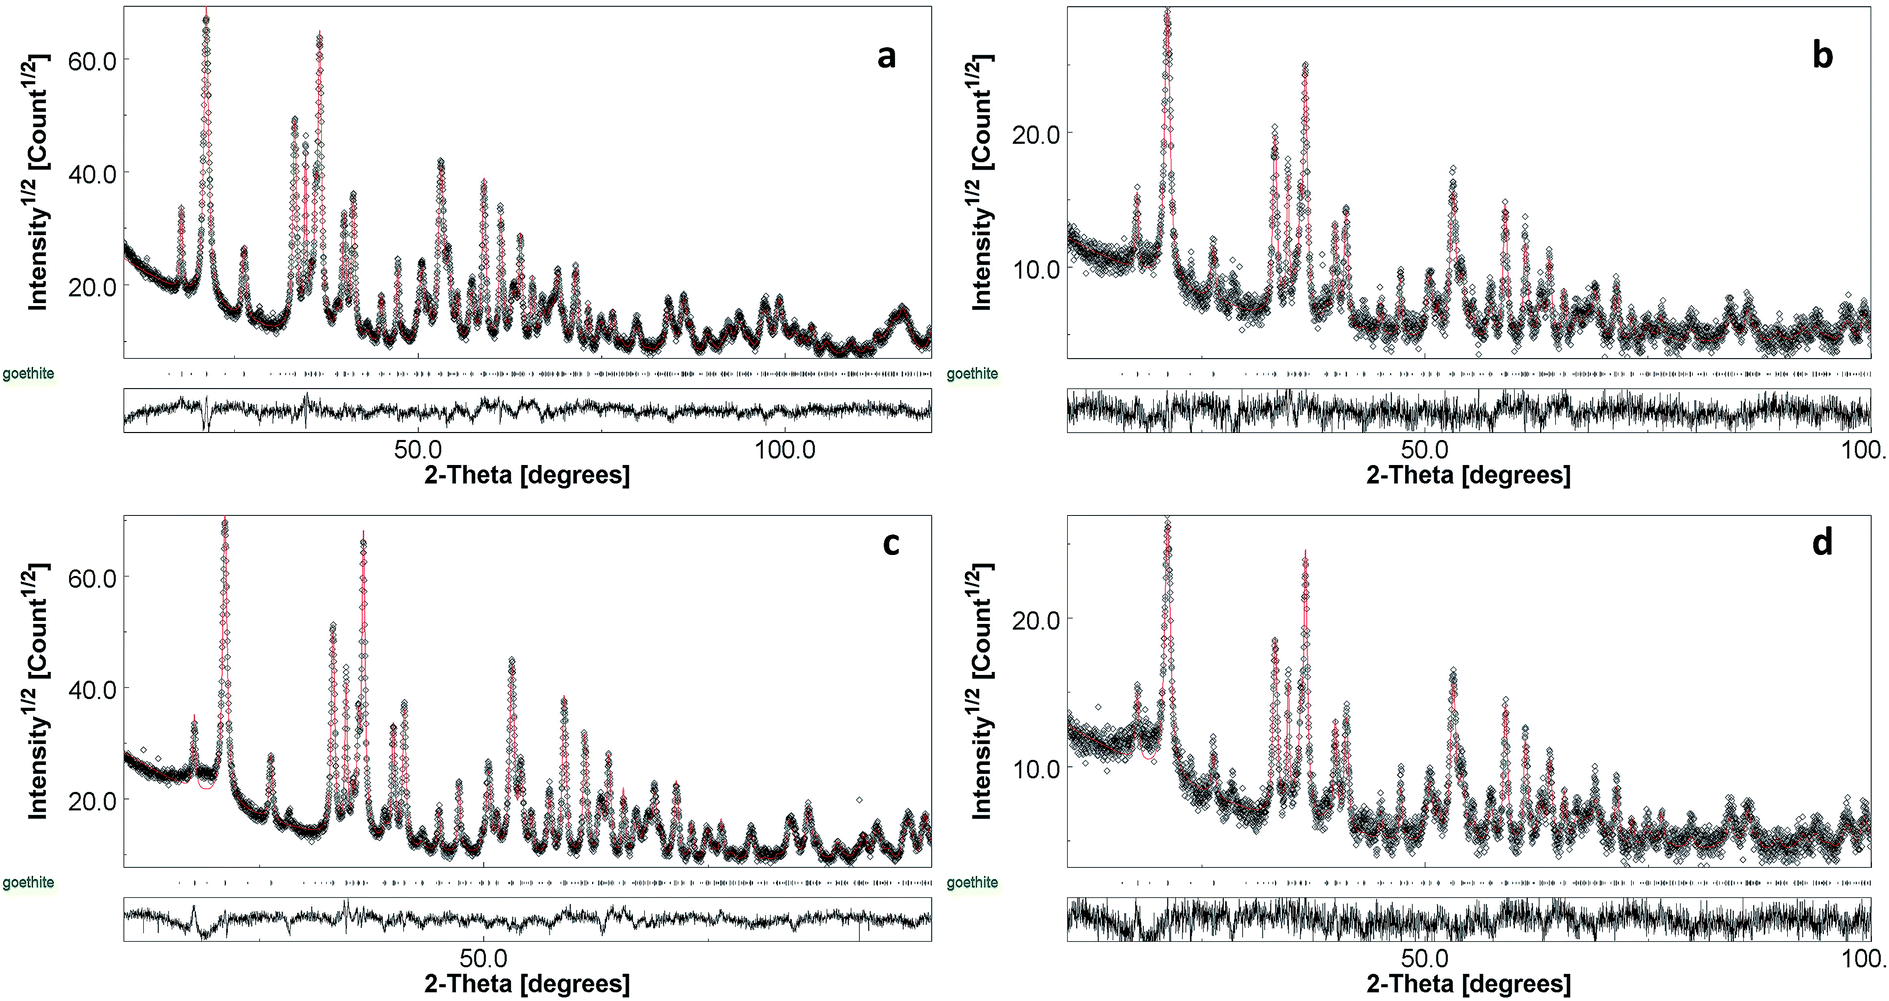 | ||
| Fig. 2 XRD profiles and Rietveld refinements of goethite nanopowders. F1 (a), T1 (b), T2 (c), US1 (d). | ||
The crystal structure is orthorhombic, space group Pbnm. An anisotropic peak broadening model proposed by Popa and Balzar29 has been used to compute the average crystallite shape for each sample, showing anisotropic growth of crystals.
Table 2 reports the lattice parameters of samples, that do not show significant differences among the four, and the lattice periodicity along the three principal crystallographic directions, revealing the formation of crystallites elongated along the c axis and flatter along the a axis with respect to b direction. Samples F1 and T1 show similar crystallite morphologies. T2 is characterized by more elongated crystallites with respect to F1 and T1, while US1 shows thinner crystallites with about the same length of F1 and T1. The isotropic value of rms microstrain, which has been evaluated using the same model, is comparable within all samples, meaning a comparable crystal structure defectivity. Note that goethite crystal structure can be also described by the Pnma space group, as reported in other publications.21 In that case, axes are switched and axis c of Pbnm corresponds to b axis of Pnma, along which the magnetic moment is oriented.
| Sample | Lattice parameters (Å) | Lattice periodicity along crystallographic directions (nm) | rms microstrain (isotropic) | ||||
|---|---|---|---|---|---|---|---|
| a | b | c | [100] | [010] | [001] | ||
| F1 | 4.620 ± 0.001 | 9.961 ± 0.001 | 3.026 ± 0.001 | 22 ± 1 | 44 ± 1 | 55 ± 1 | (2.9 ± 0.2) × 10−3 |
| T1 | 4.618 ± 0.001 | 9.958 ± 0.001 | 3.026 ± 0.001 | 22 ± 1 | 44 ± 1 | 56 ± 1 | (2.6 ± 0.4) × 10−3 |
| T2 | 4.618 ± 0.001 | 9.963 ± 0.001 | 3.026 ± 0.001 | 22 ± 1 | 47 ± 1 | 71 ± 1 | (2.1 ± 0.2) × 10−3 |
| US1 | 4.621 ± 0.001 | 9.960 ± 0.001 | 3.027 ± 0.001 | 11 ± 1 | 31 ± 1 | 55 ± 1 | (2.3 ± 0.2) × 10−3 |
The morphology of crystallites influences the shape of goethite particles as shown in Fig. 3 that reports SEM micrographs of colloids after drying on aluminum sample holders. All particles look as nanorods or nano-ribbons, reflecting the morphology of crystalline domain, but with sizes bigger than about one order of magnitude, revealing their polycrystalline nature.
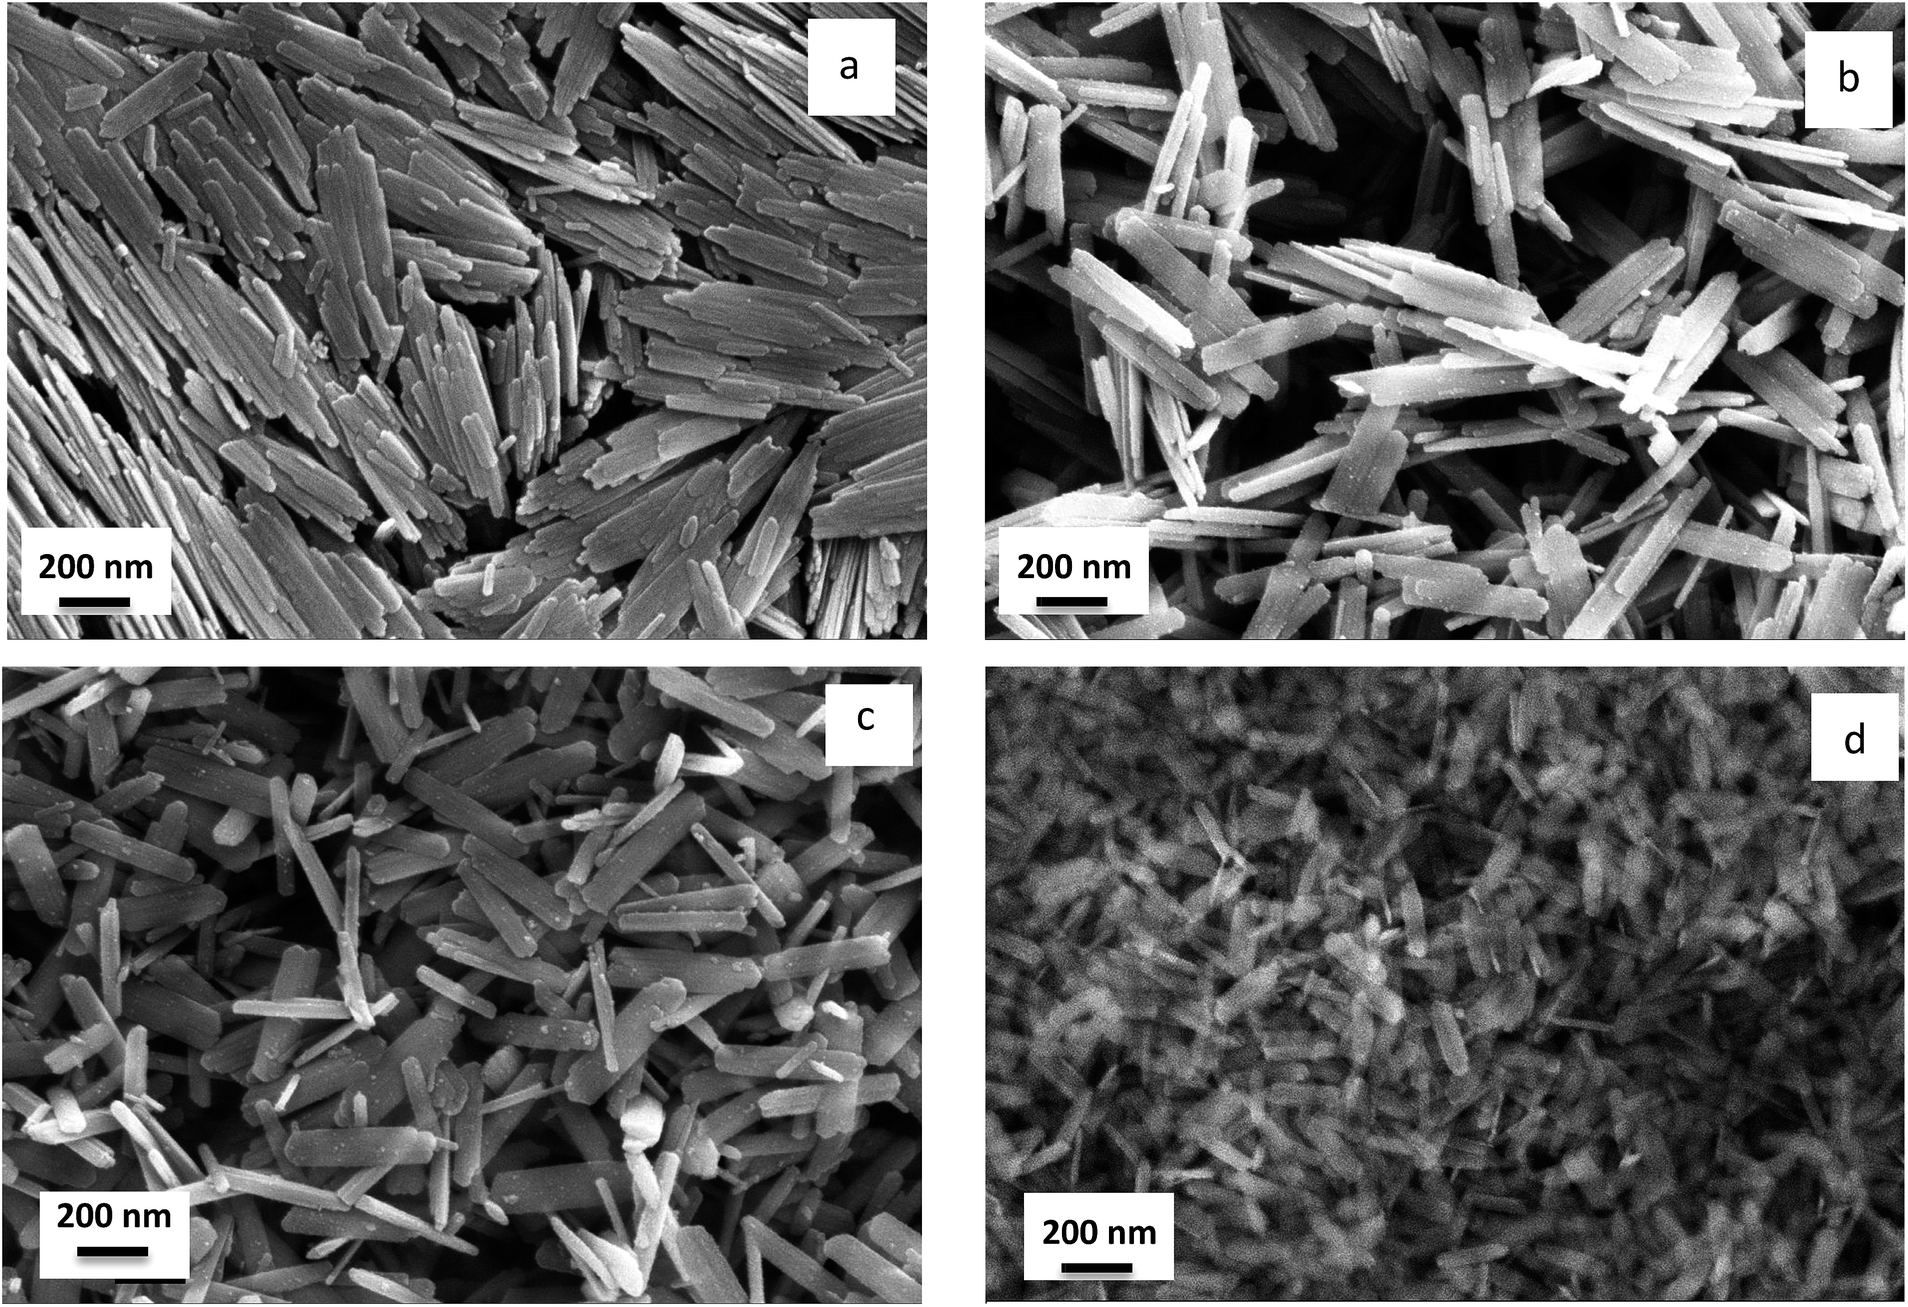 | ||
| Fig. 3 SEM micrographs of goethite nanopowders. F1 (a), T1 (b), T2 (c), US1 (d). | ||
The morphology of goethite nanoparticles was strongly influenced by synthesis parameters and could be modelled according to Cornell,30 who described them as “laths”, i.e. rectangular prisms, whose dimensions are different: length (001 axis) > width (010 axis) > height (100 axis).
It was also observed that the presence of the organic precipitating agent affected the aspect ratio of nanoparticles, since it decreased in respect to batches in which an inorganic alkali was used. Sample F1 shows rod-like particles with length of about 300–500 nm and thickness of a few tenths nm, packed into nematic arrangement. Sample T1 and T2 look more like nanoribbons with length of 300–500 nm, width of 100 nm and thickness of a few tenth nm. Sample US1 show smaller particles with length around 200 nm, width of 70–80 nm and thickness of a few nm. The different shape and smaller size of US1 particles with respect to other samples reflect the fact that a very fast conversion of ferrihydrite to goethite was achieved by ultrasonic irradiation. F1 is the only sample that, after drying, shows nematic ordering of nanorods probably due to better dispersion stability or to intrinsic magnetic properties.
DLS and ζ-potentials of colloids in water are reported in Fig. 4.
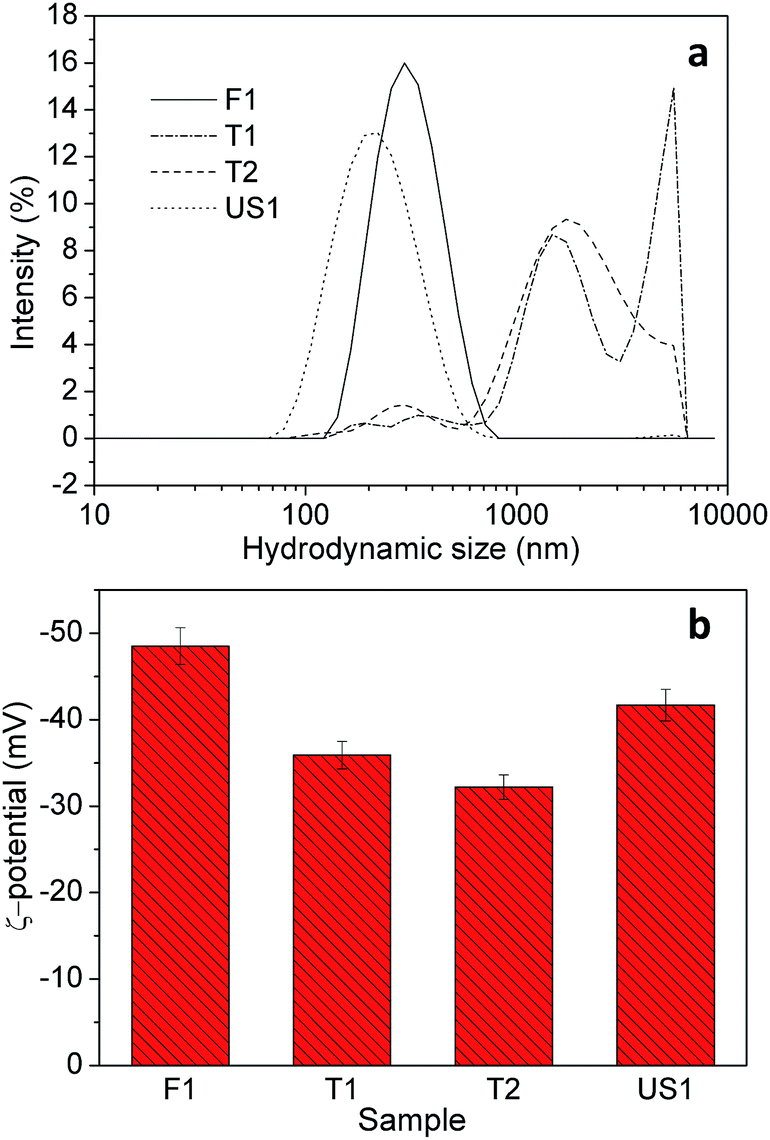 | ||
| Fig. 4 DLS (a) and ζ-potential (b) of goethite colloids in water. | ||
ζ-Potential values are −48.5, −35.9, −32.2 and −41.7 mV for sample F1, T1, T2 and US1, respectively. Samples F1 and US1, that show the highest absolute values, also show quite narrow distributions of mean hydrodynamic sizes with peak at about 295 nm for sample F1 and at 200 nm for sample US1. These values are compatible with the particle sizes observed by SEM and likely with the near absence of aggregation.
Samples T1 and T2 show hydrodynamic sizes below 1000 nm, but the higher scattering intensity comes from aggregates around 2000 nm and more. Considering that colloids are defined stable when the ζ-potential is >30 in absolute value, all suspensions can be defined stable, especially F1 and US1.
In order to probe the local interaction on Fe nuclei, 57Fe Mössbauer measurements were performed both at room temperature (hereafter RT) and at 20 K. RT spectra of all the samples are very similar (Fig. 5) and consist in an asymmetric broad sextet, typical for natural and synthetic goethite.31
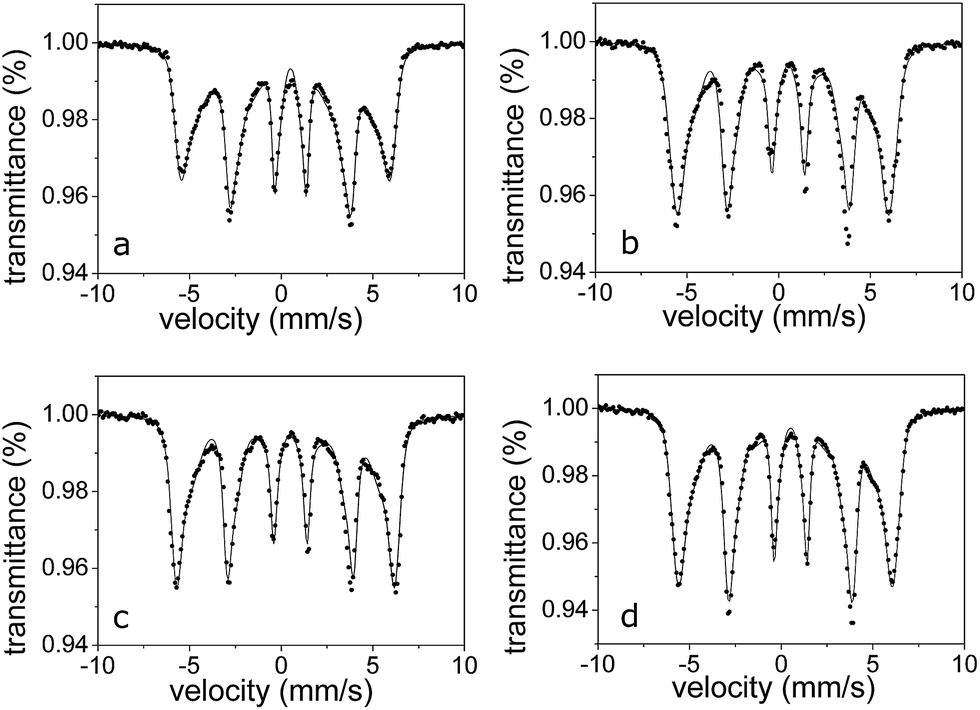 | ||
| Fig. 5 Room temperature Mössbauer spectra for (a) F1, (b) T1, (c) T2, (d) US1. | ||
No clearly detectable doublets, due to fast superparamagnetic relaxation, were observed; this evidence is congruent with the crystallite size derived from XRD measurements and in agreement with literature data.32 The absence of a well-defined single sextet in the RT spectra can be ascribed to the presence of goethite particles with relaxation time close to the Mössbauer time window, 10–11 × 10−6 s.33 Since the relaxation time is correlated both with the particle size distribution and with the amount of thermal energy necessary to activate the thermal fluctuation of the magnetization,34 the presence of a range of particle size and/or the presence of defects on the particle surface and/or the low crystallinity give rise to an asymmetrically broadened sextet.
RT spectra were therefore fitted by using a distribution of sextets, owing to local disorder on Fe nuclei. The distribution of B, reported in Fig. 5, highlights small differences among the four samples, ascribable to different crystallinity and or shape morphology rather than size particles distribution, as highlighted by XRD analyses.
Cooling down the system to 20 K, the lines become considerably narrower, but the sextets still exhibits a small asymmetry (Fig. 6). Considering the mean dimensions of the particles, 20 K is a temperature low enough to suppress the thermal fluctuation of the magnetization due to particle size effect.32 It has to be observed that each spectrum shows the presence of a tiny absorption, near zero velocity. This absorption, 1–3% in relative area, is probably due to impurities and it can be considered negligible for the characterization. The best fitting was obtained by using a three sextets model. All the sextets show hyperfine parameters, reported in Table 3, typical of Fe(III) in goethite. As well known, B is the expression of the Fe–O–Fe super-exchange. Therefore, the component with the highest value in B could be representative of bulk goethite. The presence of the other two components can be correlated to the presence of goethite in which the super-exchange is partially suppressed, as for Fe site on the surface of the nanorods and/or on low crystalline particles. It is reasonable that the exchange field at the surface nuclei will be smaller in comparison with those of the bulk35 as consequence of a decreasing in neighbouring magnetic ions at the surface site. The lack of magnetic neighbouring ions can be invocated also in the case of low crystallinity goethite particles, and the result of the local structural disorder is a decreasing in B. Therefore, the presence of these two low B components could be related to Fe nuclei on both surface and low crystalline particles. The proposed model cannot ascribe univocally which low B component is relative to the Fe on the surface or which is relative to the low crystalline component. Considering XRD data and SEM analyses, it is reasonable that the lowest B can be attributed to the low crystalline nanorods fraction. However, it is evident that F1 shows the highest content in bulk goethite, and the higher bulk component in magnetization could explain the nematic behaviour of powders, observed in SEM micrographs.
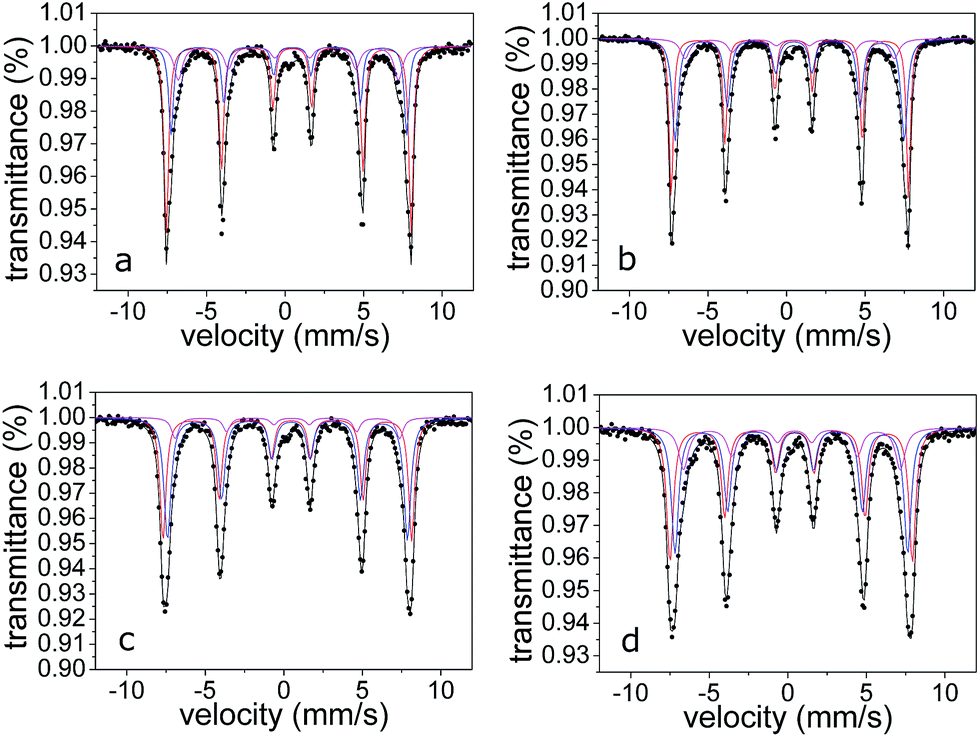 | ||
| Fig. 6 20 K Mössbauer spectra for (a) F1, (b) T1, (c) T2 and (d) US1. Red line for bulk goethite, blue and cyan lines for surface/low crystalline goethite. | ||
| Sample | δ (mm s−1) | ε (mm s−1) | Γ (mm s−1) | B (T) | A (%) | Attributions |
|---|---|---|---|---|---|---|
| F1 | 0.45 | −0.23 | 0.34 | 48.3 | 52 | Bulk |
| 0.45 | −0.22 | 0.37 | 46.5 | 27 | lc | |
| 0.44 | −0.25 | 0.64 | 43.5 | 18 | lc | |
| T1 | 0.44 | −0.24 | 0.31 | 46.8 | 43 | Bulk |
| 0.43 | −0.26 | 0.47 | 45.2 | 42 | lc | |
| 0.41 | −0.21 | 0.71 | 41.3 | 13 | lc | |
| T2 | 0.44 | −0.23 | 0.46 | 49.1 | 41 | Bulk |
| 0.45 | −0.22 | 0.53 | 47.4 | 47 | lc | |
| 0.46 | −0.26 | 0.53 | 44.4 | 9 | lc | |
| US1 | 0.43 | −0.24 | 0.52 | 47.9 | 41 | Bulk |
| 0.44 | −0.24 | 0.55 | 45.9 | 40 | lc | |
| 0.45 | −0.17 | 0.73 | 42.8 | 18 | lc |
Transmittance measurements have been performed in the UV-vis-NIR on the colloids. Due to the possibility of orienting goethite nanorods under the application of a magnetic field, the transmittance of polarized radiation has been measured for different magnetic field directions and strengths by using permanent magnets. Fig. 7 compares the transmittance spectra of different samples for 2 mm path length and in absence of external magnetic field. We can appreciate that, even if the nanoparticle concentration is nominally the same (0.1 wt%), the transmittance spectra are different, with the largest T1 and T2 particles showing the lowest normal transmittance, probably because of heavier scattering effects or to lower suspensions stability, which was lower for T2 sample. For the considered path length, light extinction is practically complete for wavelengths shorter than about 500 nm. Towards longer wavelengths, transmittance monotonically rises, reaching about 90% at 1350 nm for US1 sample and 44% for T2.
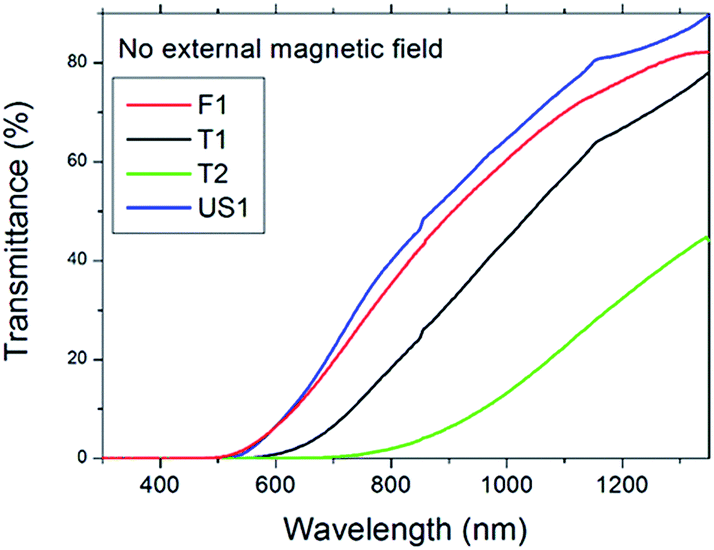 | ||
| Fig. 7 Transmittance spectrum of the samples in absence of magnetic field (0° polarization). | ||
Fig. 8 reports, for all samples, the transmittance differences between 0° and 90° polarized light with respect to magnetic field direction and strength. Let us consider sample F1 (Fig. 8a), which is the one showing the highest sensitivity to the applied external magnetic field. In absence of an external magnetic field, the transmittance spectra in both polarizations 0° and 90° are identical each other, and optical properties of samples are isotropic, as expected. In this condition, the splitting in Fig. 8a is identically zero (black curve). If we apply an external magnetic field in direction parallel to the light beam (i.e. perpendicular at both the 0° and 90° polarization directions), the transmittance spectrum changes in some amount, but with no differences between the two polarizations (no induced birefringence, red curve). On the contrary, if the external magnetic field is applied in direction perpendicular to the light beam (i.e. along one of the investigated polarization directions), an induced birefringence appears and increases with the magnetic field strength (cyan and blue curves).
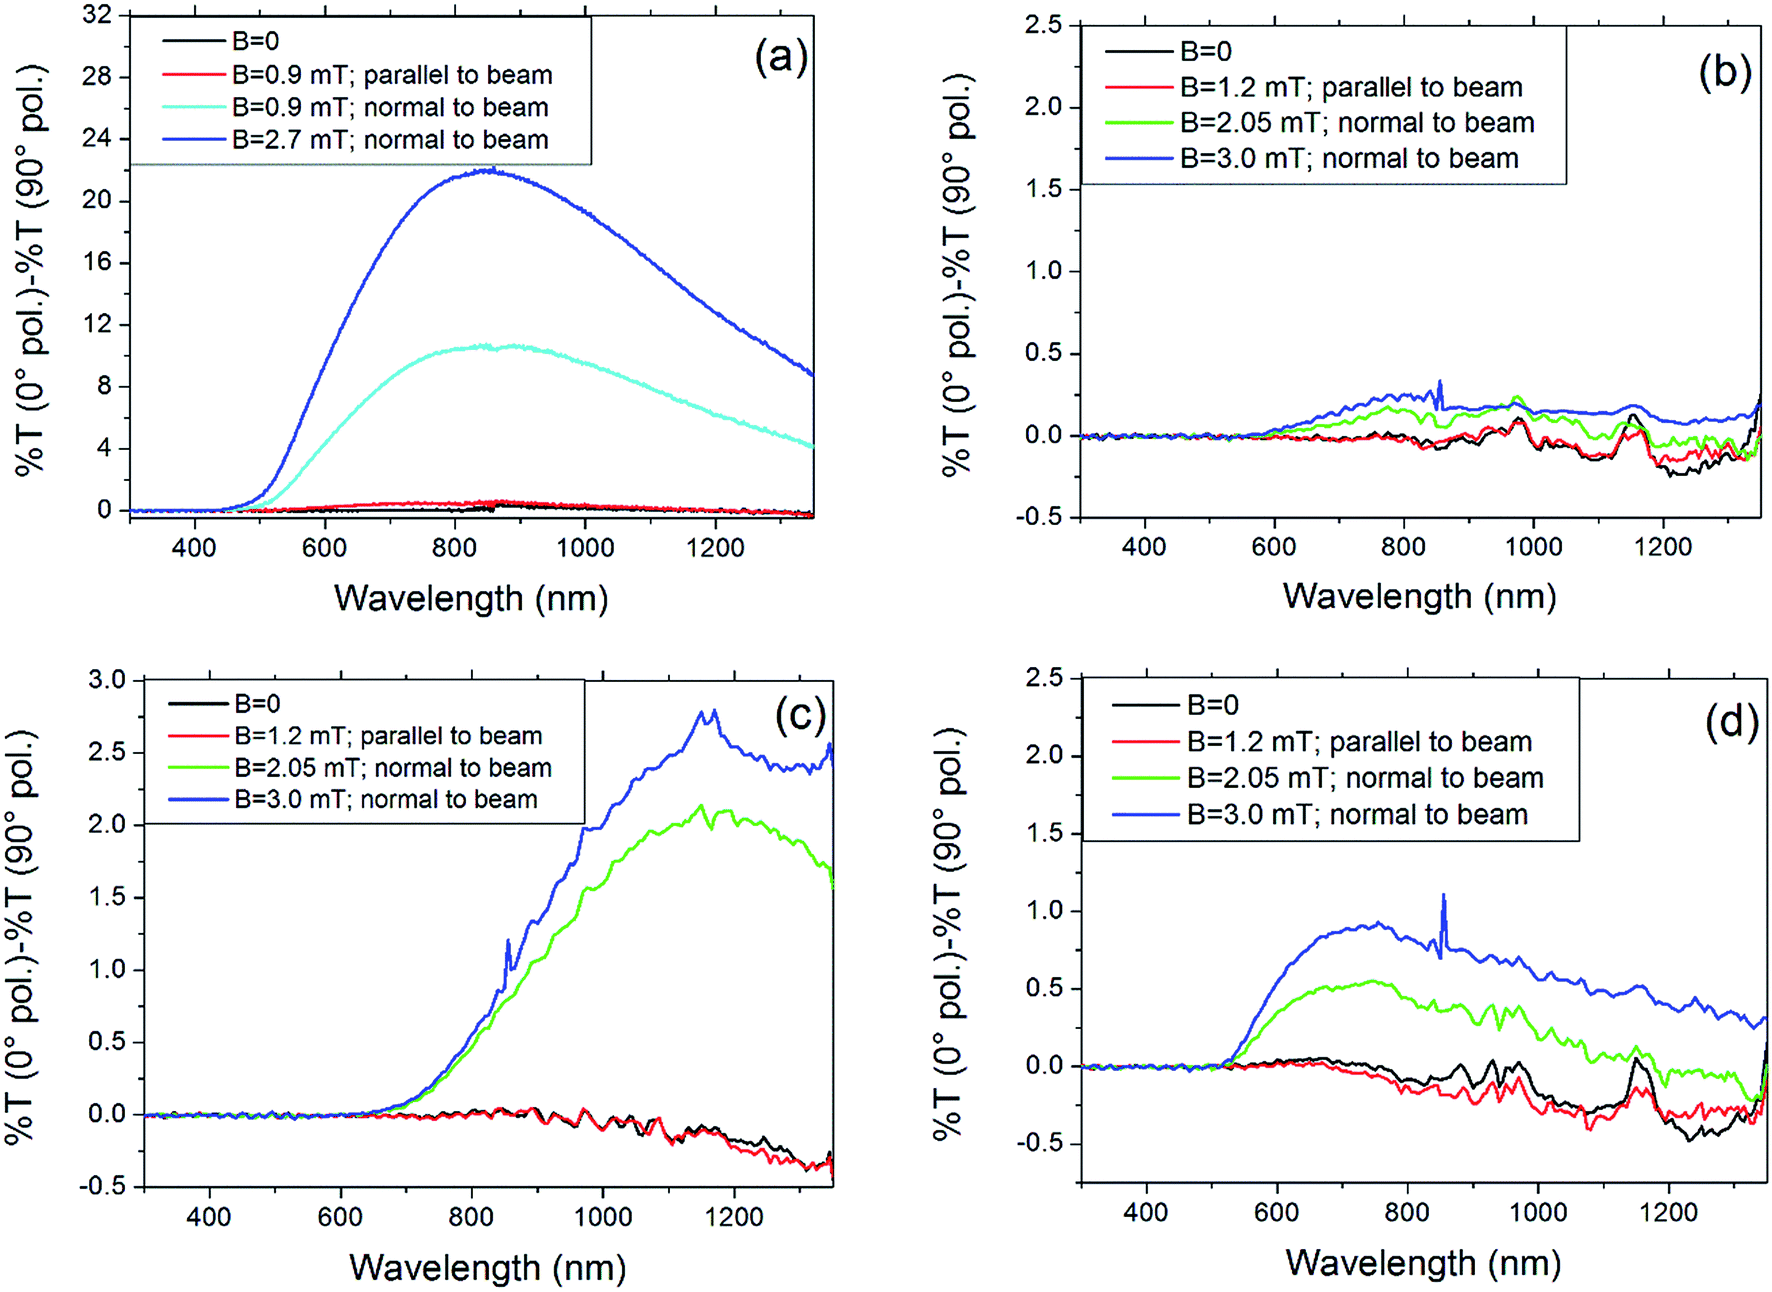 | ||
| Fig. 8 Transmittance differences between 0° and 90° polarized light with respect magnetic field direction and strength for (a) F1, (b) T1, (c) T2 and (d) US1. | ||
The birefringence is maximum around 850 nm, with transmittance differences between polarizations of about 10% for B = 0.9 mT and 22% for B = 2.7 mT. Fig. 9 shows the polarized transmittance spectra of F1 at the maximum applied field in the direction perpendicular to beam. The other samples behave in a similar way: when the magnetic field is zero or oriented parallel to the beam, no transmittance differences among polarizations are observed (the small drift within ±0.5% T is not significant, as it lies within the experimental uncertainty). When the magnetic field is normal to the beam, a birefringence appears. As shown, the effect increases by increasing magnetic field strength and it is also quite different among samples. The colloidal suspensions behave as polarizers for radiation mainly in the NIR range. At the field strength used in this work, goethite nanorods are oriented along the field direction,2 and, when they are oriented normal to beam direction and polarization direction, they are able to absorb the radiation above 400 nm with threshold efficiency depending on sample. Obviously, it is possible to tune the transmittance by changing the magnetic field strength and orientation. It is interesting to note that the effect shown by sample F1, about 22% transmittance difference with 2.7 mT field at the maximum (∼850 nm), is about one order of magnitude higher than that shown by sample T2, that shows 2.5% difference at about 1200 nm. Sample US1 shows about 1% at 750 nm, while sample T1 shows an almost undetectable effect.
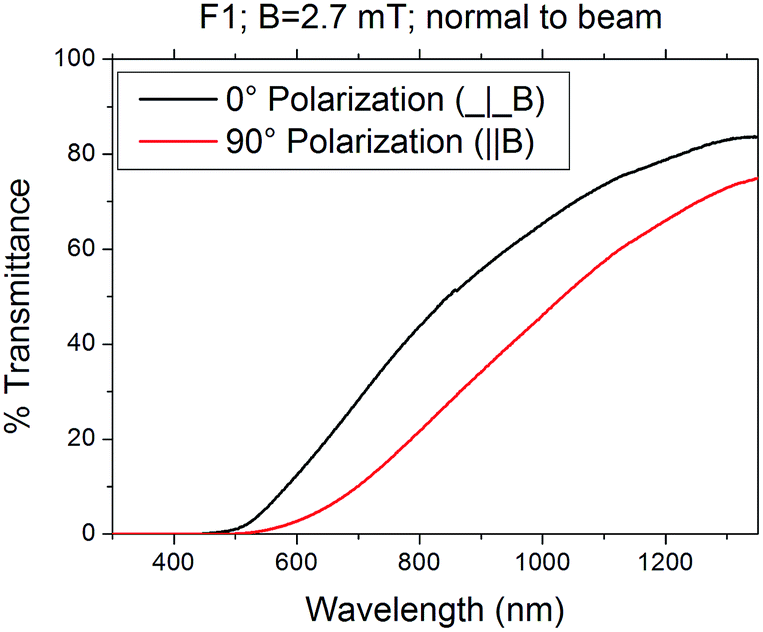 | ||
| Fig. 9 Polarized transmittance spectra of F1 at the maximum value of applied magnetic field (2.7 mT in the direction perpendicular to light beam). | ||
It seems that there is a correlation between the size of aggregates and the observed difference peak. Sample US1 that shows the smallest hydrodynamic sizes (200 nm) has the peak at about 750 nm. F1 has the size distribution maximum at 295 nm and transmittance difference peak at about 850 nm. Sample T2 that has bigger aggregates shows the peak at about 1200 nm. Sample T1 that shows even bigger aggregates, shows a very weak effect and is not possible to determine the transmittance difference peak, but shows the threshold at about 600 nm, which is comparable to that of sample T2. The size of aggregates and the shape of nanoparticles could also play an important role on effect efficiency, which means the maximum difference value. In fact, this value should be dependent on the orientation distribution of nanorods and big aggregates could be made of nanorods randomly arranged, showing a weak resultant magnetic momentum and therefore a weaker ability to orient along the field.
On the other hand, sample US1 shows smaller size distribution with respect to other samples but shows a weaker effect with respect to sample T2.
It should be also considered that smaller and shorter nanorods motion into suspension is also more influenced by Brownian motion, which conflicts with nanorods orientation due to the presence of magnetic field. Moreover, the superior performance of sample F1 with respect to other samples is probably also due to the higher bulk value of B measured by Mössbauer spectroscopy, that seems rendering F1 sample more sensible to external magnetic fields.
Conclusions
Stable goethite nanorods colloids in water have been prepared by different synthetic routes, allowing to tune, by changing the synthetic protocol, the microstructures, morphologies, sizes and aggregation states of nanorods. These colloids resulted effective in acting as radiation polarizers in the NIR range with tuneable efficiency by changing the magnetic field strength and direction. Particularly, when the magnetic field is normal to light propagation, the transmittance can be tuned by changing the angle between magnetic field and light polarization. Transmittance has a maximum for 0° and a minimum for 90°. The efficiency of this effect is different for different samples. We speculate that the interplay between absence of aggregation, optimal size and shape of nanoparticles together with higher bulk magnetization of the material leads to improved efficiency and tuneability of this effect. These colloids could then be exploited in new applications as on Smart Windows or Laser-Induced Thermotherapy.Acknowledgements
The authors are grateful to Dr Rosalba Gerbasi (CNR-ICMATE) for XRD measurements. E. S. gratefully acknowledges the Italian bank foundation “Fondazione Ente Cassa di Risparmio di Firenze” for supporting this activity within the framework of “SOLE NANO” project (pratica 2015.0861). Thanks are due to Mr Massimo D'Uva, Mr Mauro Pucci (CNR-INO) and Mr Saverio Priori (IFAC-CNR) for technical assistance.References
- P. Davidson, P. Batail, J. C. P. Gabriel, J. Livage, C. Sanchez and C. Bourgaux, Prog. Polym. Sci., 1997, 22, 913 CrossRef CAS.
- B. J. Lemaire, P. Davidson, J. Ferré, J. P. Jamet, D. Petermann, P. Panine, I. Dozov and J. P. Jolivet, Eur. Phys. J. E: Soft Matter Biol. Phys., 2004, 13, 291 CrossRef CAS PubMed.
- B. J. Lemaire, P. Davidson, J. Ferré, J. P. Jamet, P. Panine, I. Dozov and J. P. Jolivet, Phys. Rev. Lett., 2002, 88, 125507 CrossRef CAS PubMed.
- D. K. Padhi and K. Parida, J. Mater. Chem. A, 2014, 2, 10300 CAS.
- G. Zhang, S. Wang and F. Yang, J. Phys. Chem. C, 2012, 116, 3623 CAS.
- K. Amstaetter, T. Borch, P. Larese-Casanova and A. Kappler, Environ. Sci. Technol., 2010, 44, 102 CrossRef CAS PubMed.
- P. V. Adhyapak, U. P. Mulik, D. P. Amalnerkar and I. S. Mulla, J. Am. Ceram. Soc., 2013, 96, 731 CrossRef CAS.
- B. Wang, H. Wu, L. Yu, R. Xu, T. T. Lim and X. W. David Lou, Adv. Mater., 2012, 24, 1111 CrossRef CAS PubMed.
- J. Wang, L. Li, C. L. Wong, L. Sun, Z. Shen and S. Madhavi, RSC Adv., 2013, 3, 15316 RSC.
- D. J. Burleson and R. L. Penn, Langmuir, 2006, 22, 402 CrossRef CAS PubMed.
- D. G. Lewis and U. Schwertmann, J. Colloid Interface Sci., 1980, 78, 543 CrossRef CAS.
- R. J. Atkinson, A. M. Posner and J. P. Quirk, J. Inorg. Nucl. Chem., 1968, 30, 2371 CrossRef CAS.
- U. Schwertmann and E. Murad, Clays Clay Miner., 1983, 31, 277 CAS.
- R. M. Cornell and U. Schwertmann, in The Iron Oxides, Wiley-VCH Verlag GmbH & Co. KGaA, Weinheim, FRG, 2003, p. 525 Search PubMed.
- S. Krehula, S. Popovi and S. Musić, Mater. Lett., 2002, 54, 108 CrossRef CAS.
- D. M. E. Thies-Weesie, J. P. de Hoog, M. H. Hernandez Mendiola, A. V. Petukhov and G. J. Vroege, Chem. Mater., 2007, 19, 5538 CrossRef CAS.
- U. Schwertmann and R. M. Cornell, in Iron Oxides in the Laboratory, Wiley-VCH Verlag GmbH, Weinheim, Germany, 2007, p. 67 Search PubMed.
- J. H. Strehlau, M. S. Stemig, R. Lee Penn and W. A. Arnold, Environ. Sci. Technol., 2016, 50, 10406 CrossRef CAS PubMed.
- J. Lin, H. Dang, J. Xie, M. Li, G. Zhou, J. Zhang, H. Zhang and X. Yi, J. Contam. Hydrol., 2014, 64, 251 CrossRef PubMed.
- E. Van den Pol, A. A. Verhoeff, A. Lupascu, M. A. Diaconeasa, P. Davidson, I. Dozov, B. W. Kuipers, D. M. Thies-Weesie and G. J. Vroege, J. Phys.: Condens. Matter, 2011, 23, 194108 CrossRef CAS PubMed.
- B. J. Lemaire, P. Davidson, D. Petermann, P. Panine, I. Dozov, D. Stoenescu and J. P. Jolivet, Eur. Phys. J. E: Soft Matter Biol. Phys., 2004, 13, 309 CrossRef CAS PubMed.
- M. W. Shao, H. Z. Ban, Y. H. Tong, H. Hu, L. L. Niu, H. Z. Gao and Y. Ye, Mater. Lett., 2007, 61, 4318 CrossRef CAS.
- B. J. Lemaire, P. Davidson, J. Ferré, J. P. Jamet, D. Petermann, P. Panine, I. Dozov, D. Stoenescu and J. P. Jolivet, Faraday Discuss., 2005, 128, 271 RSC.
- R. Baetens, B. P. Jelle and A. Gustavsen, Sol. Energy Mater. Sol. Cells, 2010, 94, 87 CrossRef CAS.
- M. Chu, Y. Shao, J. Peng, X. Dai, H. Li, Q. Wu and D. Shi, Biomaterials, 2013, 34, 4078 CrossRef CAS PubMed.
- L. Lutterotti, S. Matthies and H. R. Wenk, MAUD: a friendly Java program for material analysis using diffraction, Newsl. CPD, 1999, vol. 21, p. 14 Search PubMed.
- R. J. Atkinson, A. M. Posner and J. P. Quirk, J. Phys. Chem., 1967, 71, 550 CrossRef CAS.
- K. Eusterhues, F. E. Wagner, W. Häusler, M. Hanzlik, H. Knicker, K. U. Totsche, I. Kögel-Knabner and U. Schwertmann, Environ. Sci. Technol., 2008, 42, 7891 CrossRef CAS PubMed.
- N. Popa and D. Balzar, Acta Crystallogr., Sect. A: Found. Crystallogr., 2005, 61, c79 Search PubMed.
- R. M. Cornell, A. M. Posner and J. P. Quirk, J. Inorg. Nucl. Chem., 1974, 36, 1937 CrossRef CAS.
- R. M. Cornell and U. Schwertmann, in The Iron Oxides, Wiley-VCH Verlag GmbH & Co. KGaA, Weinheim, FRG, 2003, p. 139 Search PubMed.
- S. Bocquet, R. J. Pollard and J. D. Cashion, Phys. Rev. B: Condens. Matter Mater. Phys., 1992, 46, 11657 CrossRef CAS.
- M. Mashlan, M. Miglierini and P. Schaaf, in Atomic Scale by Mössbauer Spectroscopy, Springer Science & Business Media, 2012, p. 94 Search PubMed.
- S. A. Fysh and P. E. Clark, Phys. Chem. Miner., 1982, 8, 180 CrossRef CAS.
- A. Yamamoto, T. Honmyo, N. Hosoito, M. Kiyama and T. Shinjo, Nucl. Instr. Meth. Phys. Res., 1993, 76, 202 CrossRef.
| This journal is © The Royal Society of Chemistry 2017 |