 Open Access Article
Synthesis of nickel(II) coordination polymers and conversion into porous NiO nanorods with excellent electrocatalytic performance for glucose detection†
Changyun Chen,
Mei Shi,
Mengwei Xue and
Yaojuan Hu *
*
School of Environmental Science, Nanjing Xiaozhuang University, Nanjing, 211171, P. R. China. E-mail: huyaojuan@njxzc.edu.cn
First published on 21st April 2017
Abstract
A nanostructured nickel–salicylic acid (SA) coordination polymer, Ni(SA)2(H2O)4 has been successfully synthesized under hydrothermal conditions on a large scale without the assistance of surfactants or template. After heat treatment, the Ni(SA)2(H2O)4 coordination polymers were converted into NiO nanostructures. Scanning electron microscopy (SEM) and transmission electron microscopy (TEM) results showed that the length of the as-prepared NiO varies from 2.0 to 3.0 μm with an average diameter of 150 nm. Due to a large number of gases released during thermal decomposition, the obtained NiO is formed of porous nanostructures. The porous NiO was used as an electrocatalyst for the detection of glucose in a nonenzymatic electrochemical sensor. The porous NiO modified glassy carbon (p-NiO/GC) electrode shows a wide linear range (0.01–5 mM), a low detection limit (2 μM), and a high sensitivity (364 μA mM−1 cm−2), as well as good stability and reproducibility. More importantly, the common interfering species, such as ascorbic acid (AA), uric acid (UA), and 3,4-dihydroxyphenylacetic acid (DOPAC) did not cause any interference at the detection potential (0.45 V vs. SCE). Furthermore, the nonenzymatic sensor was successfully applied to the determination of the glucose concentration in human serum samples.
1. Introduction
The reliable and fast determination of glucose has attracted continuous attention in the past few decades due to its considerable applications in the diagnosis of diabetes, wastewater treatment and food analysis.1 Therefore, the rapid, sensitive and selective detection of glucose is of great importance, and tremendous efforts have been devoted to develop and explore glucose sensors.2–5 At present, conventional glucose sensors on the market are mainly based on glucose oxidase (GOx)-assisted electrochemical oxidation. Though the GOx-based sensors have the advantages of high sensitivity and selectivity, the activity of GOx can be easily affected by pH, temperature, humidity and other types of interference.6,7 Moreover, the electroactive centers of GOx are embedded within the structure of biomacromolecules, and the direct electron transfer between the electroactive center and the substrate electrode is difficult to occur.8 As a result, nonenzymatic glucose sensors based on direct electrocatalytic oxidation are expected to replace the GOx-based sensor by using versatile materials with high electrocatalytic activity, high stability and reproducibility.9–11In recent years, many novel nanomaterials including carbon-based materials, various noble metals (Au, Pt, Pd), their metal alloys (Pt–Au, Pt–Pd), transition metals (Ni, Cu), and their oxides (NiO, CuO, Co3O4) have been extensively used in nonenzymatic glucose sensing.12–29 Nevertheless, noble metals and their metal alloys are still not the suitable candidates for the mass production of sensors due to their high cost, low sensitivity, and poor stability caused by surface contamination originating from adsorbed chloride ions and chemisorbed intermediates of glucose oxidation.12–18 As a result, a major consideration in practical non-enzymatic glucose sensing is focused on fabricating high-performance devices using resourceful transition-metal catalysts.19–29 Among these metals or metal oxides, Ni and NiO are particularly popular owing to their good electrocatalytic activity towards carbohydrate oxidation and negligible poisoning.30–41
Furthermore, the intimate relationship between the nanostructures and corresponding biological sensing properties of the active material, such as dimension, shape, porosity, and surface area, has stimulated tremendous efforts to develop novel enzyme-free electrode materials to realize the optimization of mass and charge transport and then minimize resistances during biosensing.42–45 Moreover, the morphology and surface area greatly depend on the synthesis method. Coordination complexes have been used as a nanostructured precursor to prepare mesoporous metal oxides.46,47 The coordination complex precursors have a uniform micro or nanostructured morphology due to the metal–organic coordination mechanism. More importantly, when calcining the nanostructured precursor, there were a large number of released gases from decomposed organic ligands and new pores were generated, finally resulting in a novel porous structure, and such unique nanostructure may bring on an exciting performance for utility in biosensors.48,49
In this study, nanorod structured coordination complex precursor was successfully synthesized under hydrothermal conditions. The porous NiO nanorods can be easily obtained by calcining. Unlike conventional approaches for preparing porous inorganic structures, this method avoids the subsequent complicated workup procedure for the removal of the hard template, seed or using soft template. And the as-prepared materials were used as electrocatalysts for the detection of glucose. The porous NiO nanorods show higher sensitivity and lower detection limit due to these porous nanorod structures do not only offer high surface areas, but provides a substantial amount of electroactive sites and short transport paths for both electrolyte ions and electrons in redox reactions.
2. Experimental
2.1 Chemicals
Salicylic acid (SA), nickel(II) carbonate basic hydrate (NiCO3·2Ni(OH)2·4H2O), sodium hydroxide (NaOH), glucose, uric acid (UA), ascorbic acid (AA), 3,4-dihydroxyphenylacetic acid (DOPAC) were purchased from Sigma-Aldrich. The stock glucose solution was allowed to mutarotate for at least 24 h before use. All chemicals were analytical grade or higher and were used as received. All solutions were prepared with double-distilled water.2.2 Preparation of the porous NiO nanorod
In a typical procedure, 2.020 g salicylic acid and 1.816 g NiCO3·2Ni(OH)2·4H2O was dissolved in 20 mL of deionized water with vigorous magnetic stirring. Several minutes later, the solution was transferred into a Teflon-lined stainless steel autoclave, which was heated gradually to 90 °C and maintained for 12 h. After cooling to room temperature, the green product at the bottom of the autoclave was collected, washed with deionized water and ethanol several times and dried in air. Then the product was calcined at 600 °C for 30 min, the heating-up rate was 5 °C per min.2.3 Preparation of flower-like NiO nanostructures
For comparison, the flower-like NiO nanocatalysts were synthesized according previously published work.50 In a typical experiment, 0.28 g of NiCl2·6H2O was dissolved in 10 mL of ethylene glycol (EG) in a water bath at 80 °C, and then 0.7 g of sodium acetate (NaAc) was added under vigorous stirring. The as-formed green transparent solution was transferred into a 50 mL Teflon-lined autoclave, and maintained at 200 °C for 14 h. After cooling to room temperature, the product was separated by centrifugation and washed several times with deionized water and ethanol, and then dried in air. Then the product was calcined at 400 °C for 1 h to obtain flower-like NiO nanostructures.2.4 Apparatus and procedures
Scanning electron microscopy (SEM) was performed with a FEI Sirion 200 field-emission scanning electron microscope (FEI Company, Holland). Transmission electron microscopy (TEM) was carried out on a JIOL-2100F transmission electron microscope operating with an accelerating voltage of 120 kV. X-ray diffraction (XRD) patterns were recorded using a Rigaku/Max-3A X-ray diffractometer with Cu Kα radiation (λ = 0.15418 nm). Thermogravimetric analysis (TGA) was operated on a NETZSCH ATA 449 F3 Jupiter simultaneous thermal analyzer from 25 °C up to 800 °C at a heating rate of 10 °C per min in a N2 atmosphere. Nitrogen adsorption/desorption isotherm was obtained on a Micrometrics ASAP 2050 (Micromeritics Instrument Co., USA) apparatus at −196 °C (77 K). The sample was degassed at 200 °C under vacuum for 8 h before the measurement.The electrochemical measurements were performed with a CHI 660B electrochemical workstation (CH Instruments). A conventional three-electrode system was used with a glassy carbon (GC) electrode (3 mm in diameter) as the working electrode. A coiled Pt wire and a saturated calomel electrode (SCE) were used as the counter electrode and the reference electrode, respectively. Prior to use, the GC electrode was polished sequentially with alumina grain sizes of 0.3 μm and 0.05 μm to create a mirror finish. The electrode was then sonicated with absolute ethanol and double-distilled water for approximately 1 min, rinsed thoroughly with double-distilled water and dried under ambient temperature. A 6 μL suspension of porous NiO nanorod or flower-like NiO (2 mg mL−1), which was prepared by sonicating the nanocatalysts in water for 30 s, was cast onto the surface of the GC electrode with a microsyringe (denoted as p-NiO/GC or f-NiO/GC), and the solvent was allowed to evaporate at ambient temperature before use. The buffer was purged with high-purity nitrogen for at least 30 min prior to each electrochemical measurement, and the nitrogen environment was then kept over the solution to protect the solution from oxygen. Amperometric detection was performed under an applied potential of 0.45 V. The solution was continuously stirred using a magnetic bar at a speed of 250 rpm. All electrochemical measurements were performed at ambient temperature (22 ± 1 °C).
Human blood serum was used to verify the application of the sensor in clinical diagnostics. Human serum samples were received from Jiangsu Province People's Hospital without any pretreatment. All experiments were conducted under the guidelines approved by Institutional Animal Care and Use Committee (IACUC) of the Nanjing Xiaozhuang University.
3. Results and discussion
3.1 Preparation and characterization of the nickel coordination polymers precursor
The morphology of the nickel coordination polymers was observed by scan electron microscopy (SEM). Fig. 1A and B show the typical SEM images of the as-prepared sample. From Fig. 1A, it can be seen that the obtained sample are one-dimensional rod-like nanostructure with a length of 2.0–3.0 μm. As shown in Fig. 1B with a relatively high magnification, it can be clearly seen that the average diameter of the nanostructure is 150 nm. Curve a in Fig. 1C shows the XRD pattern of the obtained coordination polymers. Curve b is the simulated curve of Ni(SA)2(H2O)4 by using the published crystal cif file through Mercury software. It can be concluded that the nanostructures are Ni(SA)2(H2O)4 by comparing the two XRD patterns.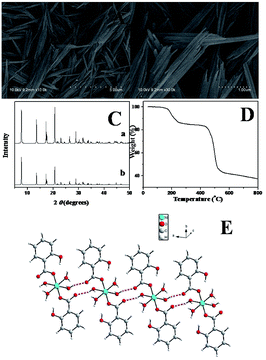 | ||
| Fig. 1 SEM images (A and B), XRD pattern (C), TGA curve (D), and crystal structures (E) of Ni(SA)2(H2O)4. | ||
Further evidence can also be provided from thermogravimetric analysis (TGA). Fig. 1D shows TGA curve of the nickel coordination polymers taken in a nitrogen atmosphere, displaying two major platforms of rapid weight loss in the temperature range from room temperature to 800 °C. The first weight loss platform was measured to be 17.36%, which can be attributed to the loss of coordinated water molecules. The first weight loss platform of the four water molecules based on the chemical formula of the Ni(SA)2(H2O)4 is about 17.71%, which is close to the above TGA experiment result (17.36%).
Although the exact growth mechanism for the formation of the one-dimensional rod-like Ni(SA)2(H2O)4 nanostructures is yet uncertain, it is clear that coordination-driven self-assembling and crystal structure would play an important role in the formation of high ordered coordination polymer nanostructures.51,52 The crystal structure of Ni(SA)2(H2O)4 were previous reported by Rissanen and co-workers,53 and we descript the crystal structure of this compound simply. The compound Ni(SA)2(H2O)4 crystallizes in the centrosymmetric space group P![[1 with combining macron]](https://www.rsc.org/images/entities/char_0031_0304.gif) . As shown in Fig. 1E, each nickel ion has a distorted octahedral geometry with four water molecules in the equatorial site and two oxygen atoms from two different salicylic acid molecules in the axial positions. The carboxylate group of the salicylic acid part coordinates to the nickel ion in a monodentate mode. Parallel to the (1, 1, 1) plane, the isolated [Ni(SA)2(H2O)4] unit are connected to each other via the multifurcated intermolecular hydrogen bonding interactions between the water molecules and salicylic acid molecules forming one-dimension (1D) chain.
. As shown in Fig. 1E, each nickel ion has a distorted octahedral geometry with four water molecules in the equatorial site and two oxygen atoms from two different salicylic acid molecules in the axial positions. The carboxylate group of the salicylic acid part coordinates to the nickel ion in a monodentate mode. Parallel to the (1, 1, 1) plane, the isolated [Ni(SA)2(H2O)4] unit are connected to each other via the multifurcated intermolecular hydrogen bonding interactions between the water molecules and salicylic acid molecules forming one-dimension (1D) chain.
3.2 Preparation and characterization of the porous NiO nanrods
After the precursor was calcined at 600 °C in N2, porous NiO nanorods can be obtained. From Fig. 2A, the one-dimensional rod-like morphology is maintained on a large scale, and the surface is rough, suggesting that the nanostructures might be composed of NiO nanoparticles. Moreover, the size of NiO nanostructure is smaller than that of the precursor. This is reasonable because during the thermal decomposition, the shrinkage would occur as gases (such as CO, CO2, and H2O) are generated. The transmission electron microscopy (TEM) image shown in Fig. 2B also demonstrates that the surface of the product is rough. Furthermore, there are some pores generated because a large number of gases released during the calcining (Fig. 2C). A high-resolution transmission electron microscopy (HRTEM) image (Fig. 2C inset) displays clear lattices of the NiO crystal.48 Fig. 2D presents the XRD pattern of the calcined product, which perfectly fits with the standard spectrum of NiO (JCPDS-78-0643), further confirming that the Ni(SA)2(H2O)4 precursor has been completely transformed to NiO nanostructures. In comparison, the flower-like NiO nanocatalysts were synthesized. The SEM image (Fig. S1†) and XRD pattern (Fig. S2) are shown in ESI.†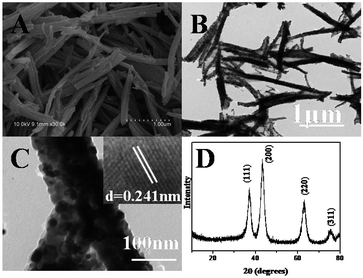 | ||
| Fig. 2 SEM image (A), TEM images (B and C), and XRD pattern (D) of p-NiO nanostructures by calcining the Ni(SA)2(H2O)4 precursor (inset of D: HRTEM of NiO). | ||
The adsorption–desorption isotherm curve and the pore size distribution of the as-prepared p-NiO nanorod are shown in Fig. 3. The Brunauer–Emmett–Teller (BET) surface area of the p-NiO nanorod was calculated to be 153.9 m2 g−1 based on the desorption curve. The pore size distribution by the Barrett–Joyner–Halenda (BJH) method displayed 10 nm, which indicated the presence of the mesopores with a narrow distribution. Moreover, the unique porous nanorod structure of the as-prepared products containing mesopores might provide a substantial amount of electroactive sites and make both electrolyte ions and electrons diffusion to active sites easier.
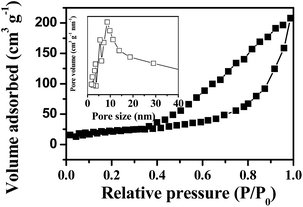 | ||
| Fig. 3 N2 adsorption/desorption isotherms with an inset showing the pore size distribution of p-NiO nanostructures. | ||
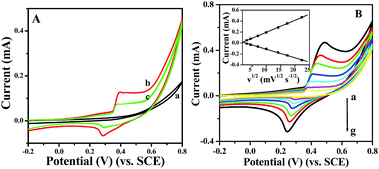
Prior to testing the sensing performance of NiO for glucose, we compared the electrochemical behavior of the bare GC, p-NiO/GC, and f-NiO/GC electrode in 0.1 M NaOH solution at a scan rate of 50 mV s−1. As shown in Fig. 4A, there were no obvious redox peaks in the CV of bare GC electrode (curve a). A pair of well-defined redox peaks is observed (curve b, curve c), which is attributed to the redox reaction between Ni2+ and Ni3+ in the alkaline solution NiO + OH− ⇌ NiO(OH) + e−.33 However, the peak current of p-NiO/GC electrode is higher than that of the f-NiO/GC electrode, which might be due to the mesopores of the p-NiO nanorod make the NaOH electrolyte diffusion easier. Fig. 4B shows the CV curves of p-NiO/GC electrode at different scan rates. It can be seen that the anodic peak shows a slightly positive shift, and the cathodic peak shifts negatively with the increase of scan rate. These results indicate that the redox reaction of NiO on the surface of bare GC electrode is rapid and reversible.34 Moreover, both the anodic and cathodic peak currents are linearly proportional to the square root of the scan rate as shown in the inset of Fig. 4B, indicating a diffusion-controlled electrochemical process, which is in agreement with earlier reports.35,36
3.3 Electrocatalytic detection of glucose
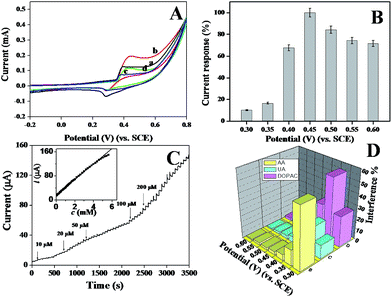
To compare the electrocatalytic glucose oxidation activity of the p-NiO/GC electrode, CVs of the p-NiO/GC (a and b) and f-NiO/GC (c and d) electrode were measured in 0.1 M NaOH solutions without (a and c) and with (b and d) 2 mM glucose. As shown in Fig. 5A, the anodic peak current was substantially higher and the cathodic peak current was lower in the presence of glucose than in the absence of glucose. This experiment results suggest the excellent catalytic properties of the porous NiO toward the oxidation of glucose. Moreover, the anodic peak potential shifts to a more positive value with the addition of glucose, which might be attributed to the diffusion limitation at the electrode surface. As shown in Fig. 4B, Ni(II)/Ni(III) redox reaction is a diffusion-controlled process. Initially, a short dynamic balance could be reached between Ni(III), Ni(II), and hydroxyl ions at the anodic peak potential. The presence of glucose consumed some of the Ni(III). Subsequently, Ni(II) should react with the hydroxyl ions at the interface of the electrode and solution to reach a new balance. Due to the existence of a hydroxyl concentration polarization, a more positive potential was needed for the formation of Ni(III).37 However, the p-NiO/GC electrode shows higher oxidation current than that of f-NiO/GC electrode, indicating that the p-NiO nanorod exhibits enhanced electrocatalytic response towards the oxidation of glucose in contrast to the f-NiO nanostructures due to the porous nanorod structures do not only offer high surface areas, but provides a substantial amount of electroactive sites and short transport paths for both electrolyte ions and electrons in redox reactions.It is well known that the sensitivity of electrochemical biosensors is strongly dependent on the applied potential. To study the effect of the working potential on the electrocatalytic oxidation of glucose at the porous NiO modified electrode, the amperometric response to five successive injections of 0.1 mM glucose were recorded at different applied potentials varying from 0.3 V to 0.6 V. The average values of five measurements are presented in Fig. 5B. The current response increased as the working potential increased, reaching the maximal value at 0.45 V. Thus, 0.45 V was chosen as the working potential in the following amperometric measurement.
The typical amperometric responses of the p-NiO/GC electrode to glucose were determined using successive injections of glucose from 10 μM to 200 μM into 0.1 M NaOH solution at 0.45 V. After the addition of glucose, the response increased and reached 95% of the steady-state value within 3 s (Fig. 5C), suggested that the p-NiO/GC electrode responds rapidly to a change in the glucose concentration. The linear concentration was in the range of 10 μM to 5 mM with a correlation coefficient of 0.9992. The sensitivity was evaluated to be approximately 364 μA mM−1 cm−2. The detection limit was estimated to ca. 2 μM with a signal/noise ratio (S/N) of 3. These results are superior or comparable to those reported in other studies (Table 1).
| Electrode | Sensitivity (μA mM−1 cm−2) | Linear range (mM) | Detection limit (μM) | Ref. |
|---|---|---|---|---|
| RGO–Ni(OH)2 | 11.43 | 0.002–3.1 | 0.6 | 38 |
| Ni(OH)2–graphene | 328 | 0.010–1 | 0.6 | 39 |
| Porous Cu–NiO | 171.8 | 0.5–5 | 0.5 | 40 |
| NiO–Pt NFs | 180.80 | To 3.67 | 0.313 | 41 |
| (Ni/VCNTs/G) | 950.6 | 0.05–1.0 | 30 | 37 |
| Pt–NiO/rGO | 832.95 | 0.008–14.5 | 2.67 | 35 |
| Porous NiO | 364 | 0.010–5 | 2 | This work |
The selectivity of the p-NiO/GC electrode for glucose was also investigated since the co-existing electroactive species might have effects on the detection of glucose in real sample analysis, several common interfering species were investigated at different potentials. Considering the concentration of glucose is at least 30 times that of interfering species in human blood, the interference tests were carried out by adding 1.0 mM glucose, followed by additions of 0.10 mM interfering species. For a better comparison, the response current of 1.0 mM glucose is set as 100% at each detection potential, and the response of the interfering species is normalized by this value. As shown in Fig. 5D, when the detection potential is lower than 0.45 V, the interferences are significant. At detection potential greater than 0.45 V, the interferences are negligible. Therefore, 0.45 V was selected as the optimized detection potential to fulfill the sensitivity and selectivity requirements of the present biosensor.
3.4 Reproducibility and stability
The reproducibility of developed sensor based on p-NiO/GC electrode was examined by measuring the current response of glucose oxidation at five equally fabricated electrodes under the same conditions. The relative standard deviation (RSD) of the current response was 4.23%, demonstrating a good reproducibility. Furthermore, one fabricated electrode was used to detect 1 mM glucose five times and the RSD is 3.89%. The long-time stability of glucose sensor is a critical factor in practical detection application. The stability of the electrode was also investigated by amperometric response containing 1.0 mM glucose. After 2 months storage at ambient temperature, the current response to 1 mM glucose remained 94% of its initial response (Fig. 6).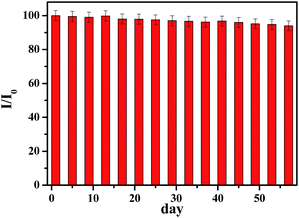 | ||
| Fig. 6 Stability of the sensor stored under ambient conditions over two months using 0.1 M NaOH at 0.45 V with 1.0 mM glucose (I/I0). | ||
3.5 Real sample detection
In order to verify the reliability of the glucose sensor for routine analysis, the sensor was employed to determine glucose in blood serum samples. Three blood samples were analyzed using five independently prepared electrodes. Typically, 20 μL of serum sample was added to 4 mL of 0.1 M NaOH solution, and the current response was recorded at 0.45 V. The results were compared with those measured with a commercial blood glucose monitoring system. It is shown that the values measured by the developed electrode are in good agreement with the data from the commercial monitor (Table 2). Recovery testing was carried out to demonstrate the validity of the proposed method. The obtained recoveries of the proposed method ranged from 96–100.3%. These results indicated that the proposed nonenzymatic glucose sensor had potential use for the analysis of glucose in real clinical samples.| Samples | Determined by developed electrode (mM) | Determined by blood glucose monitor (mM) | RSD (%) | Recovery (%) |
|---|---|---|---|---|
| 1 | 4.26 | 4.32 | 3.42 | 96.54 |
| 2 | 5.34 | 5.25 | 3.56 | 97.72 |
| 3 | 5.78 | 5.89 | 4.24 | 100.26 |
4. Conclusions
Porous NiO nanorods have been fabricated by calcining the nickel–salicylic acid (SA) coordination polymers (Ni(SA)2(H2O)4). When calcining the nanostructured precursor, a large number of gases released from decomposed organic ligands and new pores were generated. These pores do not only offer high surface areas, but provides a substantial amount of electroactive sites and short transport paths for both electrolyte ions and electrons in redox reactions. The porous NiO modified electrode showed excellent electrocatalytic performance for glucose oxidation. The p-NiO/GC electrode was also used to construct a non-enzymatic glucose sensor. The developed sensor displayed high sensitivity, low detection limit, wide linear range, good stability and reproducibility, which outmatch the performance of other nonenzymatic Ni-based glucose sensors that have been reported. Therefore, the porous NiO nanocatalysts will be a promising candidate for constructing practical nonenzymatic glucose sensors.Acknowledgements
This work was supported by National Natural Science Foundation of China (21401106), Natural Science Foundation of Jiangsu Province (BK20140090), High School Natural Science Foundation of Jiangsu Province (16KJB150025), Nanjing Xiaozhuang University Key Research Project (2015NXY02).Notes and references
- Z. Yang, J. Feng, J. Qiao, Y. Yan, Q. Yu and K. Sun, Anal. Methods, 2012, 4, 1924–1926 RSC.
- W. Lu, Y. Luo, G. Chang and X. Sun, Biosens. Bioelectron., 2011, 26, 4791–4797 CrossRef CAS PubMed.
- Y. Zhao, Y. Wang, X. Zhang, R. Kong, L. Xia and F. Qu, Talanta, 2016, 155, 265–271 CrossRef CAS PubMed.
- S. Liu, J. Tian, L. Wang, Y. Luo and X. Sun, RSC Adv., 2012, 2, 411–413 RSC.
- X. Qin, W. Lu, A. M. Asiri, A. O. Al-Youbi and X. Sun, Catal. Sci. Technol., 2013, 3, 1027–1035 CAS.
- Y. Song, X. Lu, Y. Li, Q. Guo, S. Chen, L. Mao, H. Hou and L. Wang, Anal. Chem., 2016, 88, 1371–1377 CrossRef CAS PubMed.
- J. Zhang, X. Yu, W. Guo, J. Qiu, X. Mou, A. Li and H. Liu, Nanoscale, 2016, 8, 9382–9389 RSC.
- Y. Liu, X. Zhang, D. He, F. Ma, Q. Fu and Y. Hu, RSC Adv., 2016, 6, 18654–18661 RSC.
- K. C. Lin, Y. T. Hung and S. M. Chen, RSC Adv., 2015, 5, 2806–2812 RSC.
- Y. Zhang, E. Zhou, Y. Li and X. He, Anal. Methods, 2015, 7, 2360–2366 RSC.
- K. Barman and S. Jasimuddin, RSC Adv., 2016, 6, 20800–20806 RSC.
- Y. Hu, F. He, A. Ben and C. Chen, J. Electroanal. Chem., 2014, 726, 55–61 CrossRef CAS.
- H. Zhang, X. Xu, Y. Yin, P. Wu and C. Cai, J. Electroanal. Chem., 2013, 690, 19–24 CrossRef CAS.
- Y. Hu, W. Du and C. Chen, Chin. J. Anal. Chem., 2014, 42, 1240–1244 CAS.
- S. Liu, K. S. Hui and K. N. Hui, ACS Appl. Mater. Interfaces, 2016, 8, 3258–3267 CAS.
- C. Kong, L. Tang, X. Zhang, S. Sun, S. Yang, X. Song and Z. Yang, J. Mater. Chem. A, 2014, 2, 7306–7312 CAS.
- A. K. Das, J. Samdani, H. Y. Kim and J. H. Lee, Electrochim. Acta, 2015, 158, 129–137 CrossRef CAS.
- A. K. Das and C. R. Raj, Electrochim. Acta, 2013, 107, 592–598 CrossRef CAS.
- C. Wei, X. Li, F. Xu, H. Tan, Z. Li, L. Sun and Y. Song, Anal. Methods, 2014, 6, 1550–1557 RSC.
- Y. Su, B. Luo and J. Z. Zhang, Anal. Chem., 2016, 88, 1617–1624 CrossRef CAS PubMed.
- W. Lu, Y. Sun, H. Dai, P. Ni, S. Jiang, Y. Wang, Z. Li and Z. Li, RSC Adv., 2016, 6, 16474–16480 RSC.
- Q. Q. Sun, M. Wang, S. J. Bao, Y. C. Wang and S. Gu, Analyst, 2016, 141, 256–260 RSC.
- Q. Wang, Q. Wang, M. Li, S. Szunerits and R. Boukherroub, RSC Adv., 2015, 5, 15861–15869 RSC.
- A. Zhang, Y. Tian, M. Liu, Y. Xiao, D. Jia and F. Li, RSC Adv., 2014, 4, 43973–43976 RSC.
- D. R. Kumar, D. Manoj and J. Santhanalakshmi, RSC Adv., 2014, 4, 8943–8952 RSC.
- T. Chen, D. Liu, W. Lu, K. Wang, G. Du, A. M. Asiri and X. Sun, Anal. Chem., 2016, 88, 7885–7889 CrossRef CAS PubMed.
- S. Liu, J. Tian, L. Wang, X. Qin, Y. Zhang, Y. Luo, A. M. Asiri, A. O. Al-Youbi and X. Sun, Catal. Sci. Technol., 2012, 2, 813–817 CAS.
- Z. Wang, X. Cao, D. Liu, S. Hao, G. Du, A. M. Asiri and X. Sun, Chem. Commun., 2016, 52, 14438–14441 RSC.
- L. Xie, A. M. Asiri and X. Sun, Sens. Actuators, B, 2017, 244, 11–16 CrossRef CAS.
- Y. Dinga, Y. Liu, J. Parisi, L. Zhang and Y. Lei, Biosens. Bioelectron., 2011, 28, 393–398 CrossRef PubMed.
- G. Wang, X. Lu, T. Zhai, Y. Ling, H. Wang, Y. Tong and Y. Li, Nanoscale, 2012, 4, 3123–3127 RSC.
- R. Ding, J. Liu, J. Jiang, J. H. Zhu and X. Huang, Anal. Methods, 2012, 4, 4003–4008 RSC.
- C. Guo, Y. Wang, Y. Zhao and C. Xu, Anal. Methods, 2013, 5, 1644–1647 RSC.
- P. Kannan, T. Maiyalagan, E. Marsili, S. Ghosh, J. Niedziolka-Jönsson and M. Jönsson-Niedziolka, Nanoscale, 2016, 8, 843–855 RSC.
- L. Wang, X. Lu, C. Wen, Y. Xie, L. Miao, S. Chen, H. Li, P. Li and Y. Song, J. Mater. Chem. A, 2015, 3, 608–616 CAS.
- B. Zhan, C. Liu, H. Chen, H. Shi, L. Wang, P. Chen, W. Huang and X. Dong, Nanoscale, 2014, 6, 7424–7429 RSC.
- W. S. Kim, G. J. Lee, J. H. Ryu, K. Park and H. K. Park, RSC Adv., 2014, 4, 48310–48316 RSC.
- Y. Zhang, F. Xu, Y. Sun, Y. Shi, Z. Wen and Z. Li, J. Mater. Chem., 2011, 21, 16949–16954 RSC.
- N. Qiao and J. Zheng, Microchim. Acta, 2012, 177, 103–109 CrossRef CAS.
- X. Zhang, A. Gu, G. Wang, Y. Huang, H. Ji and B. Fang, Analyst, 2011, 136, 5175–5180 RSC.
- Y. Dinga, Y. Liu, L. Zhang, Y. Wanga, M. Bellagamba, J. Parisi, C. M. Li and Y. Lei, Electrochim. Acta, 2011, 58, 209–214 CrossRef.
- C. Dong, H. Zhong, T. Kou, J. Frenzel, G. Eggeler and Z. Zhang, ACS Appl. Mater. Interfaces, 2015, 7, 20215–20223 CAS.
- X. Y. Lang, H. Y. Fu, C. Hou, G. F. Han, P. Yang, Y. B. Liu and Q. Jiang, Nat. Commun., 2013, 4, 2169–2176 Search PubMed.
- W. Yang, K. R. Ratinac, S. P. Ringer, P. Thordarson, J. J. Gooding and F. Braet, Angew. Chem., Int. Ed., 2010, 49, 2114–2138 CrossRef CAS PubMed.
- P. Si, S. Ding, J. Yuan, X. W. Lou and D. H. Kim, ACS Nano, 2011, 5, 7617–7626 CrossRef CAS PubMed.
- H. Pang, Q. Lu, Y. Li and F. Gao, Chem. Commun., 2009, 7542–7544 RSC.
- F. Gao, H. Pang, S. Xu and Q. Lu, Chem. Commun., 2009, 3571–3573 RSC.
- H. Pang, B. Zhang, J. Du, J. Chen, J. Zhang and S. Li, RSC Adv., 2012, 2, 2257–2261 RSC.
- Y. Fan, R. Liu, W. Du, Q. Lu, H. Pang and F. Gao, J. Mater. Chem., 2012, 22, 12609–12617 RSC.
- X. Song and L. Gao, J. Am. Ceram. Soc., 2008, 91, 4105–4108 CrossRef CAS.
- K. Liu, H. P. You, G. Jia, Y. H. Zheng, Y. H. Song, M. Yang, Y. J. Huang and H. J. Zhang, Cryst. Growth Des., 2009, 9, 3519–3524 CAS.
- X. P. Sun, S. J. Dong and E. K. Wang, J. Am. Chem. Soc., 2005, 127, 13102–13103 CrossRef CAS PubMed.
- K. Rissanen, J. Valkonen, P. Kokkonen and M. Leskela, Acta Chem. Scand., Ser. A, 1987, 41, 299–309 CrossRef.
Footnote |
| † Electronic supplementary information (ESI) available. See DOI: 10.1039/c7ra00715a |
| This journal is © The Royal Society of Chemistry 2017 |

