 Open Access Article
A thiocarbonyl-containing small molecule for optoelectronics†
David Gendrona,
Fatemeh Maasoumia,
Ardalan Armina,
Katherine Pattisonb,
Paul L. Burn*a,
Paul Meredith*b,
Ebinazar B. Namdasb and
Benjamin J. Powell b
b
aCentre for Organic Photonics & Electronics, School of Chemistry and Molecular Biosciences, The University of Queensland, St Lucia, QLD 4072, Australia. E-mail: p.burn2@uq.edu.au
bCentre for Organic Photonics & Electronics, School of Mathematics and Physics, The University of Queensland, St Lucia, QLD 4072, Australia. E-mail: meredith@physics.uq.edu.au
First published on 7th February 2017
Abstract
We report the synthesis and characterization of a novel thiocarbonyl iso-DPP derivative, namely 1,3,4,6-tetraphenylpyrrolo[3,2-b]pyrrole-2,5(1H,4H)-dithione. Even without solubilising alkyl chains, the small molecule could be processed from organic solvents such as dichloromethane, chloroform or dichlorobenzene, and it was found that the optical properties of neat thin films were strongly dependent on the solvent used. Field effect hole mobilities were of the order 10−4 cm2 V−1 s−1, with mobilities measured in a diode configuration solvent dependent and at least an order of magnitude lower. Importantly, blends of the iso-DPP derivative with PC70BM, a typically used electron acceptor in bulk heterojunction solar cells, were found to possess hole mobilities of up to 10−3 cm2 V−1 s−1 in a diode configuration, which was an order of magnitude larger than the electron mobility. Finally, simple bulk heterojunction solar cells were fabricated with maximum power conversion efficiencies of 2.3%.
Introduction
The pyrrolo[3,4-c]pyrrole-1,4-dione (DPP) moiety has been widely incorporated into non-polymeric and polymeric materials for use in organic solar cells. In contrast, the isomeric structure, pyrrolo[3,2-b]pyrrole-1,4-dione (iso-DPP), has been less well studied, with there being only a few reports on the preparation of non-polymeric materials or polymers incorporating the unit.1–3 Organic solar cells containing iso-DPP-based materials have given Power Conversion Efficiencies (PCE) of up to 1.6% for small molecules4 and 5.1% for conjugated polymers5 when blended with a fullerene acceptor.Although the photophysics and chemistry of thiocarbonyl containing materials have been extensively discussed in the past6–8 there are only a few examples that have been used in organic optoelectronic applications, such as DPP,9–12 naphthalene diimides,13 iso-indigo,14 indigo,15 and perylene diimide derivatives.16,17 In the case of the DPP-based materials it was found that replacing the carbonyls by thiocarbonyls decreased the optical gap, the ionization potential and the electron affinity.18 However, in this instance the thiocarbonyl derivatives were reported to have a much-reduced solar cell performance relative to their oxygen containing counterparts.19 Given the paucity of thiocarbonyl containing organic semiconductors the development of such materials is interesting to explore.
In order to provide a platform to understand the potential of thiocarbonyl derivatives for optoelectronic applications, we have designed a new and simple iso-DPP molecule bearing two thiocarbonyls, 2,3,5,6-tetraphenylpyrrolo[3,4-c]pyrrole-2,5(1H,4H)-dithione 2 (Fig. 1). In this report, we describe its synthesis and characterization including its thermal, photophysical, electronic, and charge transport properties. Finally, we use 2 as the donor material in a bulk heterojunction (BHJ) solar cell and show that this truly small molecule donor can give rise to devices with reasonable efficiency.
Results and discussion
Optical and electronic properties
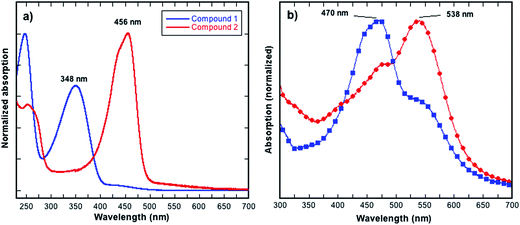
Compound 2 was prepared from 1 as shown in Fig. 1, and the synthesis involved a simple functional group interconversion. The synthesis and properties of 1 have been previously reported.20 1,3,4,6-Tetraphenylpyrrolo[3,2-b]pyrrole-2,5(1H,4H)-dione 1 was reacted with Lawesson's reagent in xylenes at 150 °C. The yield of the reaction was relatively low, which is consistent with previously reported yields for thiocarbonyl formation.13,16 In the current work the low yield was due in part to the poor solubility of starting compound 1 in the xylenes and the use of an excess of Lawesson's reagent that can further react with the as formed thiocarbonyl species.21,22 In spite of compound 2 not possessing typical alkyl or alkoxy solubilizing groups it had reasonable solubility in common chlorinated solvents such as chloroform (CF), chlorobenzene (CB) or 1,2-dichlorobenzene (ODCB) at concentrations of up to around 20 mg mL−1 when the solvents were heated near their boiling points. The solubility of compound 2 is in part due to the polarisable sulfur atoms as well as the phenyl groups that are out-of-plane with respect to the iso-DPP chromophore. The dihedral angle for the phenyl groups (measured facing the centre of the molecule) are ≈29° for those bonded to carbon atoms and ≈34° for those bonded to the nitrogen atoms. The stability of 2 towards thermal decomposition was investigated using thermogravimetric analysis (TGA), which showed that a 5% weight loss occurred at around 300 °C (Td). Furthermore, Differential Scanning Calorimetry (DSC) showed that 2 did not have any thermal transitions in the temperature range of 0 to 190 °C. Compound 2 could be processed by spin-coating from solution or by evaporation under vacuum, and was found to be of sufficient stability both in solution and film to usable.As stated earlier, previous work has shown that the exchange of a carbonyl by a thiocarbonyl on an organic semiconductor causes a red shift in the absorption spectrum.13,18,19 This was also observed in the current work, with the solution (dichloromethane) absorption spectrum of 2 being red shifted when compared to 1. The thiocarbonyl-iso-DPP 2 had a peak at 456 nm compared to 348 nm for the oxo equivalent, compound 1 (Fig. 2a). Furthermore, the absorption band of 2 also had a shoulder on the short wavelength side and there was weak absorption between 500 nm and 600 nm. In compound 1 the equivalent weak absorption between 400 nm and 475 nm was assigned to a symmetry disallowed optical transition.18
The film absorption spectra of 2 are shown in Fig. 2b, and it is clear that the method of film preparation has a strong effect on the overall shape of the spectrum. In all cases, there is an apparent red shift in the solid-state absorption spectrum relative to solution with an increase in the optical density between 500 nm and 600 nm. The extent of the increase in the optical density between 500 nm and 600 nm was found to be dependent on the processing solvent used. In addition to the absorption peak between 500 nm and 600 nm, the film absorption spectra also had a peak at around 470 nm, which while slightly red shifted, is reminiscent of the solution spectrum. When chloroform (CF) was used to cast the film, the higher energy peak was observed to be stronger than the lower one. In contrast, when using a CF + 10% ODCB solvent mixture to cast the film, the relative intensity of the peaks was reversed so that the lower energy peak became stronger.
In order to better understand the electronic structure of 2 we performed Density Functional Theory (DFT) calculations. All calculations were performed using the ADF suite of programs23–25 at the B3LYP/TZP level of theory. To help in the analysis it is useful to compare the results for 2 with those for 1, which have been reported earlier.20 Both compounds are centrosymmetric (Ci symmetry), i.e., symmetric under inversion, which maps the spatial coordinates (x, y, z) → (−x, −y, −z). Therefore, all orbitals (and hence all electronic excitations) can be classified as either symmetric (gerade) or antisymmetric (ungerade) under inversion.
In both molecules there are three orbitals relevant to the low energy electronic structure: the lowest unoccupied molecular orbital (LUMO), highest occupied molecular orbital (HOMO) and the HOMO−1, which are shown in Fig. 3. In 1 the HOMO and LUMO are ungerade and the HOMO−1 is gerade. This means that the HOMO → LUMO transition is gerade and hence dipole forbidden (recall that the dipole operator is ungerade). But the HOMO−1 is gerade; hence the HOMO−1 → LUMO transition is ungerade and therefore dipole allowed. In contrast, for 2 the HOMO−1 and LUMO are ungerade whereas the HOMO is gerade. Hence, the HOMO → LUMO transition is dipole allowed whereas the HOMO−1 → LUMO transition is dipole forbidden. The energy difference between the HOMO−1 and LUMO in 1 is 3.55 eV while the energy difference between the HOMO and LUMO in 2 is 3.36 eV. So the molecular orbital analysis provides a qualitative explanation of the redshift from 1 to 2 observed in Fig. 2.
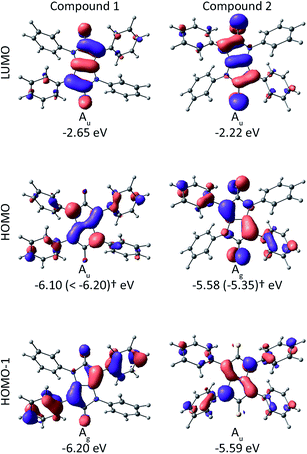 | ||
| Fig. 3 Calculated frontier molecular orbital energies and Kohn–Sham orbitals for compounds 1 (ref. 20) and 2 from DFT (ADF; B3LYP/TZP).† In parenthesis: IP from Photoelectron Spectroscopy in Air (PESA) measurements. | ||
However, it is well known that molecular orbitals do not provide quantitative estimates of the energetics of electronic transitions. We therefore also performed Time-Dependent DFT (TDDFT) calculations for 2 and the relative oscillator strengths are shown in Fig. 4. For 1 (and other related compounds see D. Gendron et al.20 for an extended discussion) and 2 the picture from TDDFT due to the details of the mixing between different molecular orbital transitions is more complex. In both 1 and 2 the S1 transition is gerade and so not relevant to the optical processes consistent with the weak absorption seen between 400 nm and 475 nm and 500 nm and 600 nm, respectively (Fig. 2a). In 1 the lowest energy allowed transition is S2, which is at 3.24 eV (383 nm). For comparison the energy of the S1 state in 1 is calculated to be 2.71 eV (457 nm). S1 is allowed in 2 and has an energy of 2.57 eV (482 nm). Interestingly, it is only rather weakly allowed and is largely of HOMO−2 → LUMO character (cf. ESI†). For both compounds the TDDFT calculations are in reasonable quantitative agreement with experiment. It is also interesting to note that the S4 excitation in 2, which has predominantly HOMO → LUMO character, is strongly allowed and is predicted to lie at 3.18 eV (390 nm). Thus, this transition might be responsible for the shoulder observed in Fig. 2a.
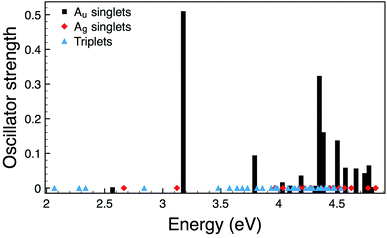 | ||
| Fig. 4 Calculated oscillator strengths for 2. As the Ag singlets and all triplets are forbidden their energies are marked by diamonds and triangles, respectively. | ||
Turning to the solid-state, it is clear that the calculations do not account for the apparent red shift in the experimental spectra (Fig. 2b) of the short wavelength peak, which is reminiscent of the solution spectra nor the new long wavelength peak. However, the calculations do not attempt to model the environment, and this is important in understanding the spectra. The TDDFT calculations provide an explanation for the additional long wavelength peak observed experimentally. The assignments of the spectra for 1 and 2 in dichloromethane depend crucially on the symmetry of the molecules. However, in partially crystalline films one expects the symmetry to be broken both by distortion of the molecules and by their local environments. Thus, one would expect S1 to become allowed. The relative energies calculated for S1 and S2 are consistent with the relative energies of the peaks observed in the absorption of the films. Therefore, the low energy absorptions that give rise to the observed peaks can in the main be assigned to S1, S2 and S3.
However, in addition to the breaking of the symmetry leading to a more allowed S1 transition, the increase in optical density at long wavelengths could also have a component from J-aggregates within the film. Nevertheless, from a phenomenological point of view the ratio of the long and shorter wavelength components of the absorption spectrum of the film is related to the solvent used with the higher boiling solvents giving rise to a greater proportion of the long wavelength absorption and the films from chloroform the least. That is, the absorption of the film from chloroform was the closest to the solution spectra suggesting that they are the most amorphous.
Before investigating the charge transport and device properties of 2 we measured its ionization potential (IP) using Photoelectron Spectroscopy in Air (PESA) to enable the appropriate choice of contacts. We found that 2 had an IP of −5.35 eV, which is significantly less than that reported for the keto-equivalent, compound 1, which had an IP greater than −6.2 eV.20 The lower ionization potential is consistent with the DFT calculations described earlier and the previous reports comparing compounds with thiocarbonyl and keto groups,19 and other iso-DPP derivatives.26,27
Charge transport
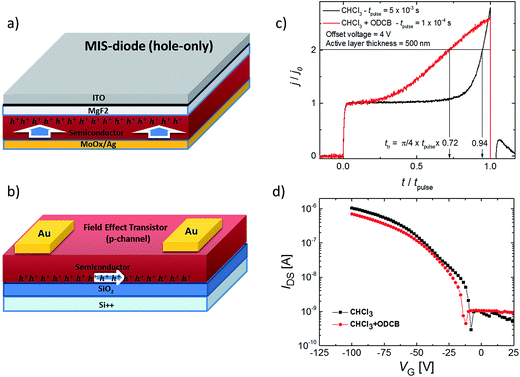
In Fig. 5a–d, we show the mobility measurements (results summarised in Table 1) for solution-processed films in diode and Field Effect Transistor (FET) architectures, which measure mobility in the vertical and horizontal directions, respectively. The mobility in the diode configuration (relevant to photovoltaic devices) was measured using the Metal–Insulator–Semiconductor Charge Extraction with a Linearly Increasing Voltage (MIS-CELIV) method (see ESI†).28 The MIS-CELIV measurements reveal differences in the bulk mobility normal to the substrate for films cast from CF compared to those spin-coated from a CF + 7% ODCB mixture. From Fig. 5c it can be seen that there is a longer delay in the rise of the extraction current for the CF-cast film indicating slower (<10−6 cm2 V−1 s−1 versus 3 × 10⁻⁵ cm2 V−1 s−1) and more dispersive transport than the films formed from the mixed solvent. The results are consistent with the film absorption spectra that indicate the bulk of the CF-cast film is more amorphous than that formed from the CF + 7% ODCB mixture. In contrast, the top-contact bottom-gate FETs showed similar saturation mobilities independent of the solvent used (CF or a mixture of CF + 5% ODCB) or whether or not the surface dielectric (SiO2) was passivated (with OTS, BCB or PMMA). The average hole mobilities were found to range from 1.5–3.1 × 10⁻⁴ cm2 V−1 s−1 and the FETs had on/off ratios ranging between 1.9–6.9 × 10³. The choice of the passivation layer only affected the threshold voltage (the output and transfer curves are shown in ESI Fig. S5†). The fact that the FET mobilities were higher than the MIS-CELIV bulk diode configuration measurement is due to the higher fields and the fact that the FET measurement only measures transport through the layers close to the dielectric interface. Under these circumstances the carrier density landscape is very different to an operational diode. Similar hole mobility values have also been reported for iso-DPP polymer derivatives in a FET architecture.29 Negligible electron mobility was measured in either architecture and thus 2 can be considered a p-type material.| Solvent | Hole mobility (diode), cm2 V−1 s−1 | Hole mobility (FET), cm2 V−1 s−1 |
|---|---|---|
| CF | <10−6 | (2.2 ± 0.5) × 10−4 |
| CF + ODCB | (3 ± 1) × 10−5 | (1.9 ± 0.2) × 10−4 |
Solar cells
As the small molecule compound 2 exhibited a moderate hole mobility and an ionization potential of −5.3 eV we utilised it as the donor material with PC70BM as the electron acceptor in a bulk heterojunction solar cell. Before describing the general performance of the solar cells, it is important to note that we measured the electron and hole mobilities of 2:PC70BM blend films (1![[thin space (1/6-em)]](https://www.rsc.org/images/entities/char_2009.gif) :
:![[thin space (1/6-em)]](https://www.rsc.org/images/entities/char_2009.gif) 4 by weight) using MIS-CELIV. This blend ratio was selected based upon preliminary photocurrent optimization. Interestingly, we observed an improved hole mobility when PC70BM was added. A hole mobility of 2 × 10⁻⁵ cm2 V−1 s−1 was measured for the 2:PC70BM films cast from CF (an improvement by at least an order of magnitude compared to the neat film). However, when a CF + 7% ODCB mixture was used, remarkably the hole mobility increased by two orders of magnitude to 10−3 cm2 V−1 s−1 (see ESI Fig. S7†), and was also higher than that measured in a neat film. Furthermore, unusually the hole mobility was an order of magnitude larger than the electron mobility (10−4 cm2 V−1 s−1). There are few reports of blends used in BHJs that have a hole mobility higher than the electron mobility given the good electron transport properties of the fullerene derivatives.30
4 by weight) using MIS-CELIV. This blend ratio was selected based upon preliminary photocurrent optimization. Interestingly, we observed an improved hole mobility when PC70BM was added. A hole mobility of 2 × 10⁻⁵ cm2 V−1 s−1 was measured for the 2:PC70BM films cast from CF (an improvement by at least an order of magnitude compared to the neat film). However, when a CF + 7% ODCB mixture was used, remarkably the hole mobility increased by two orders of magnitude to 10−3 cm2 V−1 s−1 (see ESI Fig. S7†), and was also higher than that measured in a neat film. Furthermore, unusually the hole mobility was an order of magnitude larger than the electron mobility (10−4 cm2 V−1 s−1). There are few reports of blends used in BHJs that have a hole mobility higher than the electron mobility given the good electron transport properties of the fullerene derivatives.30
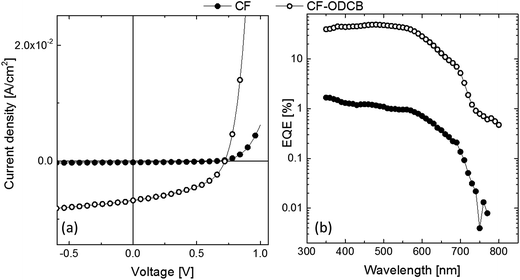
The photovoltaic device architecture was ITO/PEDOT:PSS/2:PC70BM/Sm/Al and the performance characteristics are summarized in Table 2 (see Fig. 6 for J–V curves and EQE spectra). Initial devices fabricated from chloroform solution showed a very low PCE of only 0.05%. In contrast, a maximum PCE of 2.2% could be reached with a VOC of 0.7 V, a JSC of 6.8 mA cm−2, and a FF of 45% when a solvent mixture composed of CF + 7% OCDB was used to deposit the film. Indeed, a similar PCE of 2.3% (VOC = 0.7 V, JSC = 7 mA cm−2, FF = 50%) could be reached when another dual solvent processing solution was used, CB + 7% OCDB, where the two solvents had different boiling points indicating that such mixtures were important for optimising the film morphology. The EQEs of all the devices showed a similar shape, and consistent with the JSCs, the EQE of the device prepared from chloroform solution was lower at all wavelengths compared to that prepared from the CF + 7% OCDB solution. One reason for the significant improvement in the device performance upon adding ODCB to the processing solution can be attributed to the better hole transport as shown in Table 2. However, this may not be full explanation since a hole mobility of 10−5 and electron mobility of 10−3 for the BHJ prepared from CF is typical and similar to that of previously reported for a PCDTBT:PC70BM – an efficient BHJ system.28 In such cases the imbalance of electron and hole mobilities can still deliver high efficiencies in thin junctions in which the formation of space charges of slower carriers is delayed (jSCLC ∼ d−3, where d is the active layer thickness).31 Therefore, the improved photocurrent measured for the CF + 7% OCDB-cast devices comprised of 2 must also have a component arising from good charge generation. This can be understood from the EQE values, which are recorded at very low light intensity, i.e., in the absence of any charge extraction loss. In such a case, the EQE (more appropriately the IQE) will reflect the charge generation efficiency.32
![[thin space (1/6-em)]](https://www.rsc.org/images/entities/char_2009.gif) :
:![[thin space (1/6-em)]](https://www.rsc.org/images/entities/char_2009.gif) 4 by weight) active layers deposited under different solvent processing conditions. The uncertainties of mobilities are estimated from the uncertainty of the active layer thickness in the case of the diodes. The uncertainties of the J–V characteristics are standard deviations from the means evaluated based upon 6 independent devices
4 by weight) active layers deposited under different solvent processing conditions. The uncertainties of mobilities are estimated from the uncertainty of the active layer thickness in the case of the diodes. The uncertainties of the J–V characteristics are standard deviations from the means evaluated based upon 6 independent devices
| Solvent | Hole/electron mobility, cm2 V−1 s−1 | VOC, V | JSC, mA cm−2 | FF, % | PCE, % |
|---|---|---|---|---|---|
| CF | (2.5 ± 0.5) × 10−5/(1 ± 0.3) × 10−3 | 0.60 ± 0.02 | 0.20 ± 0.05 | 41 ± 2 | 0.05 ± 0.02 |
| CF + 7% ODCB | (1 ± 0.3) × 10−3/(1.3 ± 0.4) × 10−4 | 0.72 ± 0.00 | 6.8 ± 0.1 | 44 ± 2 | 2.2 ± 0.1 |
Conclusion
In summary, we have designed and synthesized a new thiocarbonyl small molecule namely 2,3,5,6-tetraphenylpyrrolo[3,4-c]pyrrole-2,5(1H,4H)-dithione (2). We have shown substituting the oxo groups by thiocarbonyls has a significant effect on the optical properties. We found that the thiocarbonyl groups lead to a red-shift in the absorption and a reduction in the ionization potential. DFT and TDDFT calculations provided a clear explanation of the absorption spectra both in solution and solid-state by identifying the allowedness of the different optical transitions. Compound 2 had excellent thermal stability (up to 300 °C). Charge transport measurements on neat films of compound 2 showed that it had an average hole mobility of 3 × 10⁻⁴ cm2 V−1 s−1 and 3 × 10⁻⁵ cm2 V−1 s−1 in FET and diode configurations, respectively. Finally, simple solar cells comprised of 2 had maximum power conversion efficiency of 2.3%, which is the best reported thus far for a thiocarbonyl small molecule (MW < 500 g mol−1), especially for a material that does not contain solubilizing groups. Interestingly, the hole mobility in the bulk heterojunction solar cell was two orders of magnitude greater than in the neat thin film of 2, and larger than the electron mobility. Thus, these results open the way to explore other thiocarbonyl derivatives for optoelectronic applications.Experimental
General
1H and 13C NMR spectra were recorded using a 400 MHz Bruker spectrometer in appropriate deuterated solvents at 298 K. Chemical shifts were reported as δ values (ppm) relative to the residual solvent signals (CDCl3: 7.26 ppm for the 1H NMR) and coupling constants are given to the nearest 0.5 Hz. UV-visible spectroscopy was performed using a Cary 5000 UV-Vis spectrophotometer with the sample as either a thin film on quartz or as a solution in spectroscopic grade solvent (DCM = dichloromethane, ODCB = 1,2-dichlorobenzene). FT-IR spectroscopy was performed on solid samples using a Perkin-Elmer Spectrum 100 FT-IR Spectrometer with an ATR attachment. The melting point (mp) was measured in a glass capillary using a Buchi B-545 melting point apparatus and is uncorrected. Microanalyses were carried out using a Carlo Erba NA 1500 Elemental Analyser. Electrospray ionisation (ESI) mass spectrometry was carried out using a Bruker HCT 3D Ion Trap mass spectrometer. Thermogravimetric analysis (TGA) was carried out using a Perkin-Elmer STA 6000 Simultaneous Thermal Analyser apparatus at a heating rate of 10 °C min−1 under a nitrogen atmosphere. Thermal decomposition values were reported as the temperature corresponding to a 5% reduction in weight (Td). Differential scanning calorimetry (DSC) was carried out using a Perkin-Elmer Diamond Differential Scanning Calorimeter at a heating/cooling rate of 50 °C min−1. Column chromatography was performed with Kieselgel 60230-400 mesh silica purchased from Merck. Thin layer chromatography (TLC) was performed on aluminum plates coated with silica gel 60 F254. Photoelectron Spectroscopy in Air (PESA) measurements was performed using a Riken Kekei AC-2 spectrometer with a power intensity of 5 nW. All solvents were distilled prior to use. 1,3,4,6-Tetraphenylpyrrolo[3,2-b]pyrrole-2,5(1H,4H)-dione 1 was prepared as described in the literature.20Synthesis of 1,3,4,6-tetraphenylpyrrolo[3,2-b]pyrrole-2,5(1H,4H)-dithione (2)
A mixture of 1,3,4,6-tetraphenylpyrrolo[3,2-b]pyrrole-2,5(1H,4H)-dione 1 (0.50 g, 1.14 mmol) and Lawesson's reagent (1.37 g, 3.41 mmol) were deoxygenated with three argon/vacuum cycles. Then, deoxygenated xylenes (25 cm3) was added and the mixture stirred at 150 °C (oil bath temperature) in the dark for 16 h under argon. The reaction was allowed to cool to room temperature. The solvent was removed under reduce pressure and the crude product was purified by column chromatography using toluene as the eluent to give a dark blue solid of 2 (62 mg, 12%); mp > 350 °C, elemental analysis found C 76.1%, H 4.4%, N 5.8%, S 13.3%, C30H20N2S2 requires C 76.2%, H 4.3%, N 5.9%, S 13.6%; IR νmax (solid)/cm−1 1239 (CS); UV-visible absorbance λmax (DCM)/nm 454 [log(ε/dm3 mol−1 cm−1) (4.63)] 435 (4.58)sh; δH(400 MHz; CDCl3) 7.04–7.08 (8H, m, Ph-H), 7.13–7.26 (12H, m, Ph-H); δC(100 MHz; CDCl3) 113.2, 127.2, 127.9, 128.0, 128.2, 128.6, 129.3, 130.7, 135.5, 150.5, 198.1; m/z (HR-ESI) found 473.1140 (100%), 474.1171 (36%), 475.1139 (15%), [M + H]; C30H20N2S2 requires 473.1141 (100%), 474.1174 (32%), 475.1102 (9%).Spectroscopic and thermal analyses of compound 2 are reported in the ESI† section. Likewise, details of the Density Functional Theory (DFT) calculations, organic-field effect transistor (OFET) and organic photovoltaic device fabrication and characterization are described in the ESI.†
Acknowledgements
FM acknowledges The University of Queensland for UQ Centennial and UQ international scholarships, PLB was a UQ Vice Chancellor's Research Focused Fellow and is an ARC Laureate Fellow, PM is an ARC Discovery Outstanding Researcher Awardee, EBN is a University of Queensland Fellow, and BJP is an ARC Future Fellow. This work was performed in part at the Queensland node of the Australian National Fabrication Facility (ANFF): a company established under the National Collaborative Research Infrastructure Strategy to provide nano and micro fabrication facilities for Australia's researchers. This Program has also been supported by the Australian Government through the Australian Renewable Energy Agency (ARENA) Australian Centre for Advanced Photovoltaics. Responsibility for the views, information or advice expressed herein is not accepted by the Australian Government. The authors thank Dr Dani Stoltzfus and the CSIRO (Australia) for the PESA measurement.References
- M. Kiskus, S. Knippenberg, D. Beljonne, J. Cornil, R. A. J. Janssen and S. C. J. Meskers, J. Phys. Chem. A, 2013, 117, 2782–2789 Search PubMed.
- S. Song, S.-J. Ko, H. Shin, Y. Jin, I. Kim, J. Y. Kim and H. Suh, Synth. Met., 2012, 162, 2288–2293 CrossRef CAS.
- I. Welterlich, O. Charov and B. Tieke, Macromolecules, 2012, 45, 4511–4519 CrossRef CAS.
- S. Song, S.-J. Ko, H. Shin, Y. Jin, I. Kim, J. Y. Kim and H. Suh, Sol. Energy Mater. Sol. Cells, 2013, 112, 120–126 CrossRef CAS.
- S. Lu, M. Drees, Y. Yao, D. Boudinet, H. Yan, H. Pan, J. Wang, Y. Li, H. Usta and A. Facchetti, Macromolecules, 2013, 46, 3895–3906 CrossRef CAS.
- R. P. Steer and V. Ramamurthy, Acc. Chem. Res., 1988, 21, 380–386 CrossRef CAS.
- A. Maciejewski and R. P. Steer, Chem. Rev., 1993, 93, 67–98 CrossRef CAS.
- V. P. Rao, Sulfur Rep., 1992, 12, 359–403 CrossRef CAS.
- J. Mizuguchi, J. Phys. Chem. A, 2001, 105, 1125–1130 CrossRef CAS.
- J. Mizuguchi, J. Appl. Phys., 1989, 66, 3111–3113 CrossRef CAS.
- J. Mizuguchi and S. Homma, J. Appl. Phys., 1989, 66, 3104–3110 CrossRef CAS.
- G. Qian, J. Qi, J. A. Davey, J. S. Wright and Z. Y. Wang, Chem. Mater., 2012, 24, 2364–2372 CrossRef CAS.
- F. S. Etheridge, R. Fernando, J. A. Golen, A. L. Rheingold and G. Sauve, RSC Adv., 2015, 5, 4653–4659 RSC.
- S. Balley, J. F. Seager and Z. Rashid, J. Chem. Soc., Perkin Trans. 1, 1974, 2384–2387 RSC.
- G. M. Wyman and A. F. Zenhäusern, J. Org. Chem., 1965, 30, 2348–2352 CrossRef CAS.
- A. J. Tilley, R. D. Pensack, T. S. Lee, B. Djukic, G. G. Scholes and D. S. Seferos, J. Phys. Chem. C, 2014, 118, 9996–10004 CAS.
- A. J. Tilley, C. Guo, M. B. Miltenburg, T. B. Schon, H. Yan, Y. Li and D. S. Seferos, Adv. Funct. Mater., 2015, 25, 3321–3329 CrossRef CAS.
- S. Lévesque, D. Gendron, N. Bérubé, F. Grenier, M. Leclerc and M. Côté, J. Phys. Chem. C, 2014, 118, 3953–3959 Search PubMed.
- E. Ripaud, D. Demeter, T. Rousseau, E. Boucard-Cétol, M. Allain, R. Po, P. Leriche and J. Roncali, Dyes Pigm., 2012, 95, 126–133 CrossRef CAS.
- D. Gendron, E. Gann, K. Pattison, F. Maasoumi, C. R. McNeil, S. E. Watkins, P. L. Burn, B. J. Powell and P. E. Shaw, J. Mater. Chem. C, 2014, 2, 4276–4288 RSC.
- H. Oshida, A. Ishii and J. Nakayama, Tetrahedron Lett., 2004, 45, 1331–1334 CrossRef CAS.
- T. Ozturk, E. Ertas and O. Mert, Chem. Rev., 2007, 107, 5210–5278 CrossRef CAS PubMed.
- C. Fonseca Guerra, J. G. Snijders, G. te Velde and E. J. Baerends, Theor. Chem. Acc., 1998, 99, 391–401 Search PubMed.
- G. te Velde, F. M. Bickelhaupt, E. J. Baerends, C. F. Guerra, S. J. A. van Gisbergen, J. G. Snijders and T. Ziegler, J. Comput. Chem., 2001, 22, 931–967 CrossRef CAS.
- ADF2009.01, SCM, Theoretical Chemistry, Vrije Universiteit, Amsterdam, The Netherlands, http://www.scm.com/ Search PubMed.
- U. Salzner, J. B. Lagowski, P. G. Pickup and R. A. Poirier, J. Org. Chem., 1999, 64, 7419–7425 CrossRef CAS.
- U. Salzner, Synth. Met., 1999, 10, 482–483 CrossRef.
- A. Armin, G. Juska, M. Ullah, M. Velusamy, P. L. Burn, P. Meredith and A. Pivrikas, Adv. Energy Mater., 2014, 4, 24–31 Search PubMed.
- S. Lu, M. Drees, Y. Yao, D. Boudinet, H. Yan, H. Pan, J. Wang, Y. Li, H. Usta and A. Facchetti, Macromolecules, 2013, 46, 3895–3906 CrossRef CAS.
- A. Armin, P. Wolfer, P. E. Shaw, M. Hambsch, F. Maasoumi, M. Ullah, E. Gann, C. R. McNeill, J. Li, Z. Shi, P. L. Burn and P. Meredith, J. Mater. Chem. C, 2015, 3, 10799–10812 RSC.
- M. Stolterhoht, A. Armin, B. Philippa and D. Neher, J. Phys. Chem. Lett., 2016, 7, 4716–4721 CrossRef PubMed.
- A. Armin, J. Subbiah, M. Stolterhoft, S. Shoaee, Z. Xiao, S. Lu, D. J. Jones and P. Meredith, Adv. Energy Mater., 2016, 6, 1600939 CrossRef.
Footnote |
| † Electronic supplementary information (ESI) available. See DOI: 10.1039/c7ra00693d |
| This journal is © The Royal Society of Chemistry 2017 |


