 Open Access Article
Creative Commons Attribution 3.0 Unported Licence
Defect-sensitive performance of silicene sheets under uniaxial tension: mechanical properties, electronic structures and failure behavior†
Ning Ding *ab,
Huan Wanga,
Xiangfeng Chena and
Chi-Man Lawrence Wu*ab
aKey Laboratory of Applied Technology of Sophisticated Analytical Instruments, Shandong Academy of Sciences, Jinan, PR China. E-mail: dingningch@aliyun.com
bDepartment of Physics and Materials Science, City University of Hong Kong, Hong Kong SAR, PR China. E-mail: lawrence.wu@cityu.edu.hk
First published on 7th February 2017
Abstract
As a silicon analog of graphene, silicene has attracted considerable attention due to its unique physical and chemical properties. Pioneering studies have demonstrated that defects in graphene-like two-dimensional materials are considered tools for tuning the physical properties of these materials. In this work, the influence of defects on the mechanical properties and failure behavior of silicene sheets were investigated using molecular mechanics and molecular dynamics methods. The results showed that the intrinsic strength of the silicene sheets decreased with increased linear density for vacancies, width ratio for cracks, and inflection angle for grain boundaries. The elastic properties of the silicene sheets were affected by not only the defects but also their corrugated structure. Fracture failure of the silicene sheet with defects usually started from the Si–Si bond, which was located at the defect edge. The stretching strain could tune the electronic structure of the silicene sheets. This study demonstrated the defect-sensitive performance of silicene under uniaxial tension and thus helped evaluate and extend the application of this material.
1. Introduction
Silicene is a two-dimensional (2D) hexagonal structure, which has attracted significant interest from both academia and industry due to its unique physical and chemical properties.1–5 Unlike the planar structure of graphene, silicene exhibits a low-buckle structure owing to the weakening of the π–π overlaps induced by its large atom–atom distance.6,7 After the prediction of the silicene structure based on ab initio calculations in 1994,8 numerous studies were carried out to fabricate silicene using experimental methods.9–13 Recently, silicene was synthesized by epitaxial growth on metal substrates, such as Ag,9,10 ZrB2,11 and Au.12 Silicene has considerable potential in electronic, thermoelectric and photovoltaic applications.14–16 In addition to its electronic properties, the mechanical characteristics of silicene should also be understood. Very recently, the stiffness and strength of pristine silicene under uniaxial strain were studied using density functional theory (DFT)17–20 and molecular dynamics (MD) methods.21–23 In 2013, Peng and coworkers demonstrated that silicene exhibits a nonlinear elastic deformation with large strains using a DFT method.19 In addition, the strength and fracture strains of silicene were higher than those of bulk silicon, but the Young's modulus of silicene was lower than that of bulk silicon.22For the application of silicene in various devices, defects are often the first concern. Recently, Shaikhutdinov's experimental research showed that patterned defect structures that were predicted for graphene were observed on single-layer silica films on Ru(0001).24 In their work, defects such as vacancies, pentagon–heptagon pairs, and square–octagon pairs were clearly observed by scanning tunneling microscopy. Pioneering works have pointed out that structural imperfections play an important role in tuning the physical properties of low-dimensional materials.25–27 “Defect engineering” via patterning the defects on the 2D materials as a tool to control the performance of such materials become a hot topic. Until now, effects of point (vacancies28,29) and line (grain boundaries30–33 and cracks34–38) defects on the mechanical properties and fracture of graphene and hexagonal boron nitride have been systematically studied. It was detected using DFT method that the intrinsic strength of graphene might be either enhanced or reduced depending on the distribution of pentagon–heptagon pair grain boundaries (GBs).31
Studies on the defects in silicene sheets have also attracted much attention.39–44 However, most of these studies focus on the structural, electronic, and thermal properties of the defects. To the best of our knowledge, the influence of these defects (including point, line, and planar defects) on the mechanical properties and failure behavior of silicene has rarely been reported. Distinct properties may be introduced by the defects in the low-buckled structure of silicene. In addition, due to the practical difficult in experiments to identify the exact affection induced by a particular type of defects, it was a useful and feasible way to study the affection of defects on the silicene sheet by theoretic methods.
In the present work, typical types of point, line, and patterned planar defects in the surface of silicene were studied by molecular mechanics (MM) and MD methods. The structure, in-plane stiffness, intrinsic strength, and critical failure strain of silicene with and without defects were obtained and compared. Similar to a piece of paper, a silicene sheet usually takes tensile load only. If it is used in a part of material system, there must be something in the system that can resist the expected compressive load. So this work is about the behavior of silicene in the tensile sense, with and without defects. The issues we focused on include the possible relationships among the mechanical properties of silicene sheets, the defect parameters, as well as their fracture behaviors.
2. Computational details and models
2.1 Computational details
The MM and MD methods were employed to perform the tensile test of silicene models with and without defects by using the Discover module of Materials Studio. The condensed phase optimization molecular potentials for atomistic simulation studies (COMPASS) force field was chosen to describe the silicene systems.45,46 COMPASS is a powerful force field which supports atomistic simulations of condensed phase materials. The COMPASS force field has been extended and covered most common organic molecules, organic and inorganic polymers, zeolites, and metal/transition-metal oxides.47,48 It has been also verified by several previous simulation works that COMPASS force field49,50 could be used to study the dynamical behaviors of Si sheets. Details of the COMPASS force field parameters are available and embedded in Materials Studio for Si–Si interactions.51 The periodic boundary condition was imposed in the computational unit cell. A vacuum with a height of 100 Å was placed above the silicene surface to minimize the influence of adjacent layers.To investigate the influence of defects on the in-plan mechanical properties of silicene sheet, a series of uniaxial tensile tests along the tangential direction of the silicene surface was carried out. The tensile test was accomplished by applying an atomic strain on the armchair (am) direction or the zigzag (zz) direction of the 2D surface with a strain step of 0.5%. For each configuration, an energy minimization was carried out, and a 100 ps MD simulation with NVT ensemble was performed on the system. The strain rate of the tensile tests was 5 × 10⁷ s−1. The equations of atomic motion were integrated with a time step of 1 fs, and the simulation was carried out at a temperature of 1 K to eliminate the influence of temperature on the systems.
2.2 Nomenclature and silicene models
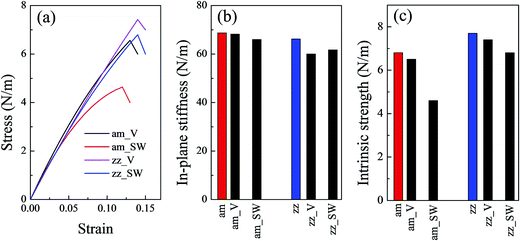
To reflect the influence of defects on the mechanical behavior of such materials, silicene models with point defects (vacancies and Stone–Wales defects), line defects (initial cracks and GBs) and patterned planar defects in the silicene surface were constructed based on the experimental observations. For vacancies, a zz_V (am_V) system denotes a silicene sheet with a vacancy defect, and the tensile test was performed along the zz (am) direction of the system. Similarly, a zz_SW (am_SW) system refers to a silicene sheet with a Stone–Wales defect, and the tensile test was performed along its zz (am) direction.Turning to the cracks in the silicene surface, a zz_crack (am_crack) system is a silicene system with an initial crack perpendicular to the zz (am) direction; during the tensile test, the external force was applied along the zz (am) direction. The GB models selected in this work comprised pentagon–heptagon (5|7) pairs. These systems were name as “(5|7) pairs_1” to “(5|7) pairs_6” corresponding to different arrangements and linear densities of (5|7) pairs. The external force was applied perpendicular to the GBs. Upon encountering a planar defect, three systems with different planar defect density, which were named as “am_P1” to “am_P3” systems, were considered as probes. For the tensile test on these systems, the external force was added along the am direction.
3. Results and discussion
The mechanical properties and failure behaviors of the silicene systems under uniaxial strain were analyzed in this section. The stress–strain curves of the silicene models with and without defects were plotted based on the relationship between strain energy and stress. The in-plane stiffness which reflected the rigidity of the 2D sheet was calculated. In addition, the intrinsic strength which was defined as the highest stress point along the stress–strain curve was obtained to evaluate the mechanical performance of the silicene sheets. The thickness of such 2D sheet was difficult to be determined experimentally;23 thus, a controversy concerning the value of the sheet thickness arose. A previous discussion of this parameter suggested that it is better to report the stress and elastic moduli of monolayer systems in force per unit length (N m−1) rather than force per unit area (Pa), especially for the buckled silicene structure. As such, the results of in-plane stiffness and intrinsic strength obtained in the present work were expressed using the unit of N m−1.3.1 Structures and mechanical properties of the pristine silicene
A defect-free silicene model was constructed and optimized with all the atomic structure parameters fully relaxed to obtain the equilibrium configuration (Fig. 1(a)). The lattice constant of the equilibrium silicene model was 3.80 Å, and the Si–Si bond length was 2.25 Å. This model showed a low buckling structure with a buckled distance of 0.58 Å. These parameters were consistent with the previous DFT and MD calculation results reported in the literature (see Table 1).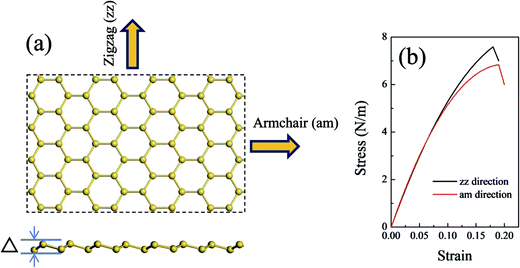 | ||
| Fig. 1 (a) Atomic structures of the silicene sheet. The upper image shows the top view, and the bottom image shows the side view; (b) stress–strain curves of the defect-free silicene. | ||
| System | Methods | a0 (Å) | Δ (Å) | dSi–Si (Å) | In-plane stiffness Y (N m−1) | Intrinsic strength τ (N m−1) | Critical failure strain δ (%) |
|---|---|---|---|---|---|---|---|
| Pristine silicene | MD-Compass-ours | 3.80 | 0.58 | 2.25 | 66.2(zz)/68.7(am) | 7.7(zz)/6.8(am) | 19(zz)/20(am) |
| DFT-LDA17 | 3.83 | 0.42 | 2.25 | 63.0 | — | 20 | |
| DFT-GGA18 | — | 0.45 | 2.28 | 60.06(zz)/63.51(am) | 5.66(zz)/7.07(am) | 14(zz)/18(am) | |
| MD-ReaxFF21 | 3.80 | 0.67 | 2.30 | — | — | — | |
| MD--ReaxFF23 | 3.76 | 0.69 | 2.11 | 50.44(zz)/62.31(am) | 5.85(zz)/4.78(am) | — |
Fig. 1(b) shows the stress–strain relationship of a silicene sheet along its zz and am directions. The in-plane stiffness obtained for the defect-free silicene sheet were 66.2 N m−1 and 68.7 N m−1 for zz and am directions, respectively (see Table 1). At the same time, this silicene sheet possessed an intrinsic strength of 7.7 N m−1 and 6.8 N m−1 along the zz and am directions, respectively. These values indicated a slight anisotropism property in the silicene sheet. Compared with graphene, the values of the mechanical characteristics of silicene were about 25% those of graphene. The dramatic decrease in silicene stiffness and strength has been pointed out due to the buckled structure and the relatively weak interaction of the Si–Si bond.23 The critical failure strains of silicene obtained in our work (19% for zz direction and 20% for am direction) were comparable with those of graphene. As shown in Table 1, the values of mechanical properties obtained by COMPASS force field were in good agreement with those obtained by ReaxFF force field and DFT method.
3.2 Mechanical properties of defects in silicene surface
| Systems | Linear density ρl (Å−1) | In-plane stiffness Y (N m−1) | Intrinsic strength τ (N m−1) | Critical failure strain δ (%) |
|---|---|---|---|---|
| zz_V | — | 60.0 | 7.4 | 14.0 |
| zz_SW | — | 61.7 | 6.8 | 14.0 |
| am_SW | — | 66.0 | 4.6 | 12.0 |
| am_V (am_V1) | 0.017 | 68.2 | 6.5 | 13.0 |
| am_V2 | 0.034 | 67.0 | 5.3 | 13.0 |
| am_V3 | 0.069 | 66.0 | 5.0 | 11.0 |
| am_V4 | 0.086 | 54.8 | 4.4 | 10.0 |
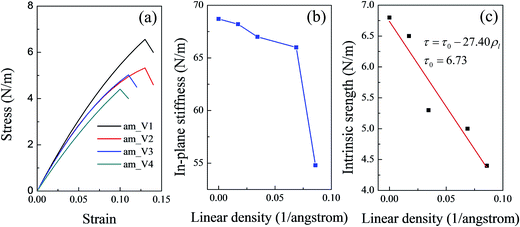
As the defects in a line increased, the point defects might be converted into a line defect. The linear density of point defects was defined to denote the degree of the defect. To further discuss the influence of the defect degree on the mechanical properties of silicene, several more systems with different linear densities of vacancies were constructed. The relationship between the in-plane stiffness (the intrinsic strength) and the linear density of the vacancies in the silicene surface was studied. With limited computing resource, mechanical characteristics along the am direction were selected for the comparison. Fig. 3(a) shows the stress–strain curves for the vacancy systems with different linear densities. All the values of the mechanical properties of the four systems (am_V1–am_V4) were collected and are shown in Table 2. As shown in Fig. 3(b), the in-plane stiffness showed a slight decrease during the initial increase of the linear density (by near 0.07 Å−1). However, as the linear density continued to increase, a sudden drop in the in-plane stiffness was observed. As mentioned above, in the elastic deformation region of the tensile test the system underwent unfolding of the buckled surface instead of direct bond stretching. When the defect degree was relatively low, the in-plane stiffness was slightly affected at the initial increase of the vacancy linear density. However, when the linear density of the vacancies increased to a certain degree, damages on the integral structure could not be ignored. Thus a sudden drop in the in-plane stiffness appeared.
Owing to the damage of the vacancies to the integral structure, the intrinsic strength along the am direction decrease as the vacancy density increased; this trend showed a linear relationship unlike that of the in-plane stiffness (shown in Fig. 3(c)). The fitted line in Fig. 3(c) shows that the relationship between the intrinsic strength and the vacancy linear density can be expressed as
| τ = τ0 − 27.40ρl | (1) |
For each crack types, six models with different crack widths in the silicene surface were considered; that is, ‘zz_crack1’ to ‘zz_crack6’ for the cracks perpendicular to the zz direction and ‘am_crack1’ to ‘am_crack6’ for the cracks perpendicular to the am direction. After the tensile testing of the systems with initial cracks, the stress versus axial strain relationship was plotted and shown in Fig. S2(c) and (d)† for the cracks perpendicular to the zz and am directions, respectively. The values of the mechanical properties including in-plane stiffness, intrinsic strength, and critical failure strain for all the systems with initial cracks are summarized in Table 3.
| Systems | Crack width w (Å) | Width ratio of the crack (%) | In-plane stiffness Y (N m−1) | Intrinsic strength τ (N m−1) | Critical failure strain δ (%) |
|---|---|---|---|---|---|
| zz direction without defects | 0 | 0 | 66.2 | 7.7 | 19.0 |
| zz_crack1 | 7.58 | 13.38 | 62.9 | 7.7 | 12.0 |
| zz_crack2 | 10.41 | 18.37 | 60.0 | 6.9 | 11.0 |
| zz_crack3 | 16.65 | 29.40 | 59.3 | 5.2 | 9.0 |
| zz_crack4 | 19.81 | 34.99 | 59.3 | 4.4 | 8.0 |
| zz_crack5 | 22.85 | 40.35 | 59.2 | 4.0 | 7.5 |
| zz_crack6 | 29.13 | 51.44 | 51.7 | 3.7 | 6.5 |
| am direction without defects | 0.00 | 0.00 | 68.7 | 6.8 | 20.0 |
| am_crack1 | 7.31 | 12.56 | 66.7 | 5.5 | 11.5 |
| am_crack2 | 10.97 | 18.84 | 66.7 | 3.0 | 9.0 |
| am_crack3 | 14.62 | 25.12 | 66.7 | 2.7 | 8.0 |
| am_crack4 | 18.28 | 31.40 | 64.3 | 2.2 | 7.0 |
| am_crack5 | 21.80 | 37.45 | 60.0 | 2.2 | 7.0 |
| am_crack6 | 29.07 | 49.93 | 59.6 | 1.5 | 5.0 |
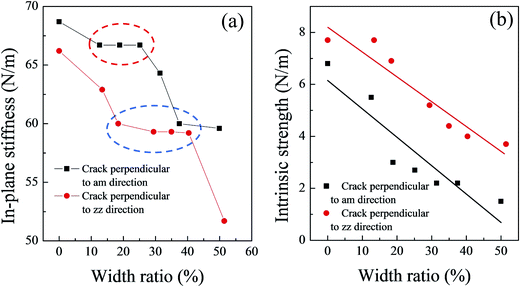
The in-plane stiffness of these models basically decreased as the initial crack width increased (Fig. 4(a)). However, a platform is present on the in-plane stiffness curve for each type of silicene models with initial cracks (see the red and blue circles for the cracks perpendicular to the am and zz directions in Fig. 4(a)); the platform might be also caused by the corrugated structure of the silicene sheet. Only when the initial width of the crack reached a certain degree, the elastic deformation region was affected dramatically. The critical value of the crack width ratio could cause a sudden drop in the in-plane stiffness of the system, and this value was estimated to be about 40% for the zz direction and 25% for the am direction.
The values of the intrinsic strength for the silicene sheet with initial cracks ranged from 7.7 N m−1 to 3.7 N m−1 for cracks perpendicular to the zz direction and 5.5 N m−1 to 1.5 N m−1 for cracks perpendicular to the am direction. Fig. 4(b) shows the intrinsic strength as a function of the width ratio of the cracks. A clear linear relationship was observed between the intrinsic strength and the width ratio of both crack types. The fitting equation can be obtained as:
| τ = τzz0 − 0.10R (for cracks perpendicular to the zz direction) | (2) |
| τ = τam0 − 0.11R (for cracks perpendicular to the am direction) | (3) |
 | (4) |
| Systems | Linear density ρl (Å−1) | Formation energy Ef (kcal mol−1 nm−1) | Inflection angle α (deg) | Misorientation angle θ (deg) | In-plane stiffness Y (N m−1) | Intrinsic strength τ (N m−1) | Critical failure strain δ (%) |
|---|---|---|---|---|---|---|---|
| zz direction without defects | 0.00 | — | 0.0 | 0.0 | 66.2 | 7.7 | 19.0 |
| (5|7) pairs_1 | 0.04 | 35.7 | 10.0 | 9.0 | 71.9 | 5.5 | 8.0 |
| (5|7) pairs_2 | 0.05 | 40.5 | 30.0 | 10.5 | 65.7 | 3.3 | 5.5 |
| (5|7) pairs_3 | 0.08 | 55.0 | 18.5 | 19.5 | 30.0 | 4.6 | 8.0 |
| (5|7) pairs_4 | 0.10 | 82.6 | 20.0 | 20.0 | 56.7 | 4.4 | 7.0 |
| (5|7) pairs_5 | 0.11 | 23.0 | 5.0 | 3.0 | 56.8 | 7.6 | 11.5 |
| (5|7) pairs_6 | 0.17 | 35.4 | 8.0 | 2.0 | 51.6 | 6.7 | 11.0 |
As shown in Fig. S4(b),† the stress–strain curves for all six GBs with (5|7) pairs exhibited brittle fracture characteristic. The values of the in-plane stiffness and intrinsic strength were ranged from 71.9 N m−1 to 30.0 N m−1 and 7.6 N m−1 to 3.3 N m−1, respectively. Accordingly, the critical failure strain ranged from 11.5% to 5.5%. Notably, the in-plane stiffness of some of the GB models were close to or even higher than those of the defect-free silicene sheets (Table 4). On the other hand, the intrinsic strength of (5|7) pairs_6 was 7.6 N m−1, which was very close to that of the defect-free silicene along the zz direction. These results indicate that the GBs can enhance or weaken of the rigidity and strength of the silicene sheets, which relied on the detailed arrangement of the (5|7) pairs. Similar properties of GBs have also been found and reported in graphene surfaces.32 These characteristics are important in tuning the mechanical properties by engineering GBs in a 2D material surface, thereby providing an effective application in future nano-devices.
As shown in Fig. S5,† neither the in-plane stiffness nor the intrinsic strength showed a clear relationship with the linear density of the (5|7) pairs. Fig. 5 shows the mechanical properties of GBs as a function of either the inflection angle or the misorientation angle. As the buckling structure of the silicene sheet plays a very important role in the elastic deformation region, the in-plane stiffness did not show a clear relationship with the inflection angles (Fig. 5(a)). However, the relationship between the in-plane stiffness and the misorientation angle from 0° to 20° (Fig. 5(b)) was approximately a downward opening parabolic. The increasing misorientation angle corresponded to the planar rotation of the hexatomic rings in the silicene surface.33,53 The misorientation angle between the two domains on the sides of the GB resulted in different buckling directions of the two domains. With the initial increase of the misorientation angle (up to about 10° in Fig. 5(b)), the buckling structures with different directions served as mutual support; as a result, the silicene sheet was not easily deformed, and the in-plane stiffness increased accordingly. However, as the misorientation angle increased, corresponding changes in the buckling directions occurred. Then, such mutual support might disappear, and the in-plane stiffness would decrease.
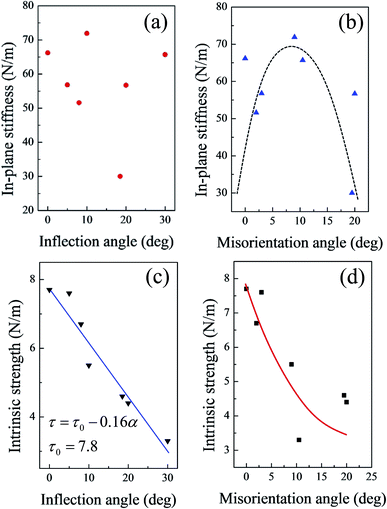 | ||
| Fig. 5 In-plane stiffness of GBs as functions of (a) inflection angle and (b) misorientation angle; intrinsic strength of GBs as functions of (c) inflection angle and (d) misorientation angle. | ||
Fig. 5(c) shows that the intrinsic strength of the silicene sheets with GBs exhibited a clear linear degressive relationship with the increasing inflection angle. When the inflection angle of the silicene sheets reached 20°, the intrinsic strength of the system decreased to about 60% that of the defect-free silicene. The fitted line in Fig. 5(a) shows that the linear relationship between the intrinsic strength and inflection angles can be expressed as
| τ = τ0 − 0.16α | (5) |
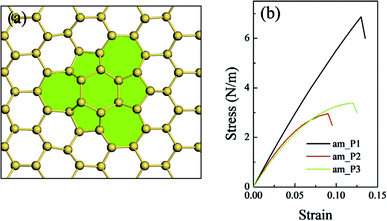
In the present work, we give a predict study on the planar defects of the silicene sheet. Three types of planar defects with defect area ratios ranging from 1.2% to 5.5% were constructed and compared with the defect-free silicene sheet (along the am direction). When the area ratio was just 1.2%, the planar defect did not considerably affect the in-plane stiffness and the intrinsic strength (Fig. 6(b) and Table 5). The in-plane stiffness slightly decreased as the area ratio of defects increased, whereas the intrinsic strength dramatically decreased to about half of that of the defect-free silicene as the area ratio of defects increased. The critical failure strain of the silicene sheet with planar defects decreased correspondingly. However, the complex stress field in the planar defects complicated the relationship between the mechanical properties and the parameters of the planar defects compared with that of the point and line defects. This issue is further investigated in our ongoing related studies.
| Systems | Area ratio of defects (%) | In-plane stiffness Y (N m−1) | Intrinsic strength τ (N m−1) | Critical failure strain δ (%) |
|---|---|---|---|---|
| am direction without defects | 0.00 | 68.7 | 6.8 | 20.0 |
| am_P1 | 1.17 | 63.0 | 6.8 | 13.0 |
| am_P2 | 3.13 | 59.9 | 3.0 | 9.0 |
| am_P3 | 5.47 | 53.8 | 3.4 | 12.0 |
3.3 Failure behavior of the silicene surface
During the tensile progress, the buckling structure of silicene trend to a more flat surface. For a pristine silicene sheet, the buckled distance changed from 0.58 Å to about 0.29 Å when it was fractured. To reveal the fracture process of the silicene sheets caused by the tensile load, the configuration of the interfaces with different strains was observed. The fracture process for three typical defect units was collected in Fig. 7. The fracture of the silicene sheets usually started from the defect unit because of the stress concentration near the irregular rings. Fig. 7(a) and (b) show the fracture process of a single vacancy defect along the am and zz directions, respectively. Along the am direction, the silicene sheet was fractured with the elongation of the Si–Si bonds at the vacancy. The two initially elongated Si–Si bonds (labeled as a1 and a2) were parallel to the tensile load and at the upper and bottom edges of the vacancy (Fig. 7(a)). As the atomic strain increased, the adjacent Si–Si bonds in the same line were fractured one by one, and a crack perpendicular to the tensile load was formed. After the stress release, a new Si–Si bond formed between the two Si atoms (labeled in red) at the center of the initial vacancy, which resulted in a five-member ring in the silicene surface.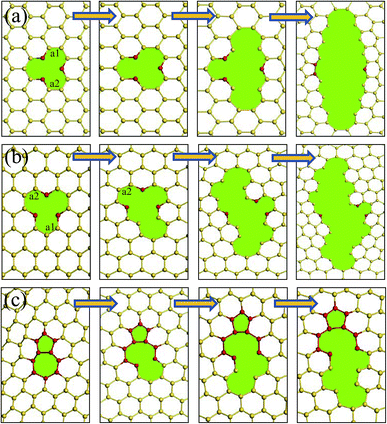 | ||
| Fig. 7 Fracture failure processes of (a) a vacancy defect along the am direction; (b) a vacancy defect along the zz direction; and (c) an isolated (5|7) pair in the silicene surface. | ||
For the fracture process of the silicene sheet with a vacancy defect along the zz direction, the first broken Si–Si bond a1 (with an initial bond length of 2.23 Å) was located around the vacancy and at one of the vacancy tips. The Si–Si bond a2 which was parallel to and at the opposite position of the first broken bond was fractured subsequently. Owing to the breakage of these two bonds, the initial direction of the crack propagation showed an angle of about 60° with the tensile load, which made it easier to release energy. When the crack continued to propagate, the growth direction became perpendicular to the tensile direction. This phenomenon was similar to that observed in a graphene surface with a vacancy along the zz direction.28
As the (5|7) pair was usually subjected to the highest tension among the atomic rings, the fracture of a (5|7) pair started at a 7–6 Si–Si bond (shared by a heptagon and a hexagon) (shown in Fig. 7(c)). After breaking the 7–6 Si–Si bond, a meta-Si–Si bond in the same hexagonal ring was elongated and broken. The fracture was then transferred to the regular hexagonal rings along the same line, and complete failure occurred subsequently.
3.4 Electronic properties of silicene under the applied mechanical stain
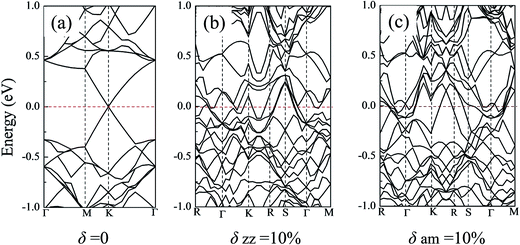
Strain induced energy band dispersion has been studied and verified in Si nanosheets along the (100) and (110) directions by R. Q. Zhang group.54 Their research results showed that under some particular conditions, a direct-to-indirect transition of the band gap was observed in the (100) Si nanosheet. In the present work, the electronic band structure of the silicene sheets and their changes during the tensile process along both the zz and am directions were studied. Considering the limitation of the computing resource, just three typical silicene models were selected: (i) the defect-free silicene system; (ii) the silicene system with a vacancy defect; (iii) the silicene system with a Stone–Wales defect. For each model, the original band structure, the energy band under a high stretching strain (i.e. 10% atomic strain) along the zz or am directions were analyzed.Fig. 8 shows the energy bands of the defect-free silicene sheets. As shown in Fig. 8(a), without the stretching strain, the defect-free silicene sheet showed a clear Dirac point at the high symmetry point, which reflected the semi-metal property of silicene. When under a high atomic strain near its fracture point, the Dirac point disappeared and the silicene sheet exhibited metallic character. For the free silicene system with a vacancy or a Stone–Wales defect, the systems showed a band gap of 0.16 eV and 0.10 eV in the absence of strain, respectively (shown in Fig. S6(a) and S7(a)†). However, along both the zz or the am direction, the 10% atomic strain made the band gap disappear and the silicene sheet show obvious metallic property (Fig. S6(b), (c), S7(b) and (c)†). For example, for the silicene system with a vacancy defect, the 10% atomic strain along the zz direction introduce a significantly up-shift in the conduction bands near the high-symmetric points of the first Brillouin zone and bands over the Fermi level appeared in silicene. Thus, mechanical stretching, which would lead to the electron redistribution, is an effective way to tune the electrical properties of silicene sheets.
4. Conclusions
In summary, three representative types of defects including point, line, and planar defects in the silicene sheet were studied by MM and MD methods. Mechanical properties such as rigidity, strength, and fracture behaviors of defective silicene sheets were found to be significantly affected by the defects. The intrinsic strength of the silicene sheet showed a clear linear degressive relationship with the increasing defect parameters, namely, the linear density for vacancies, the width ratio for cracks, and the inflection angle for GBs. However, the in-plane stiffness of silicene sheets was affected not only by the defects but also by its corrugated structure. The silicene sheet with different types of defects showed varied failure behaviors because of the distinct stress distribution in the surface; however, the fracture started from the Si–Si bond located at the edge of the defect. Mechanical strain induced changes in the electronic band structure would be an effective way to tuning the material property. The information obtained in this work would be useful for the potential use of silicene in future nano-devices.Acknowledgements
This work was supported by the National Natural Science Foundation of China (Grant No. 11404192), the Shandong Province Special Grant for High-Level Overseas Talents (Grant No. tshw20120745), the Research Award Fund for Outstanding Young and Middle-aged Scientists of Shandong Province, China (Grant No. BS2014CL002), the Key Research and Development Project of Shandong Province, China (Grant No. 2015GSF120002), the Science and Technology Activities Foundation of China for Returned Personnel and the research fund of Shandong Academy of Sciences (2015QN003).References
- D. Jose and A. Datta, Acc. Chem. Res., 2014, 47, 593–602 CrossRef CAS PubMed.
- C. Grazianetti, E. Cinquanta and A. Molle, 2D Materials, 2016, 3, 012001 CrossRef.
- M. S. Xu, T. Liang, M. M. Shi and H. Z. Chen, Chem. Rev., 2013, 113, 3766–3798 CrossRef CAS PubMed.
- W. F. Tsai, C. Y. Huang, T. R. Chang, H. Lin, H. T. Jeng and A. Bansil, Nat. Commun., 2013, 4, 1–6 Search PubMed.
- M. Ezawa, Phys. Rev. Lett., 2012, 109, 055502 CrossRef PubMed.
- S. Cahangirov, V. O. Özçelik, L. Xian, J. Avila, S. Y. Cho, M. C. Asensio, S. Ciraci and A. Rubio, Phys. Rev. B: Condens. Matter Mater. Phys., 2014, 90, 035448 CrossRef.
- E. F. Sheka, Int. J. Quantum Chem., 2013, 113, 612–618 CrossRef CAS.
- K. Takeda and K. Shiraishi, Phys. Rev. B: Condens. Matter Mater. Phys., 1994, 50, 14916–14922 CrossRef CAS.
- P. Vogt, P. De Padova, C. Quaresima, J. Avila, E. Frantzeskakis, M. C. Asensio, A. Resta, B. Ealet and G. Le Lay, Phys. Rev. Lett., 2012, 108, 155501 CrossRef PubMed.
- B. J. Feng, Z. J. Ding, S. Meng, Y. G. Yao, X. Y. He, P. Cheng, L. Chen and K. H. Wu, Nano Lett., 2012, 12, 3507–3511 CrossRef CAS PubMed.
- A. Fleurence, R. Friedlein, T. Ozaki, H. Kawai, Y. Wang and Y. Yamada-Takamura, Phys. Rev. Lett., 2012, 108, 245501 CrossRef PubMed.
- R. T. Mohamed, E. Hanna, M. Andrew, K. Abdelkader, R. Silvan, S. Mathieu, G. B. Azzedine, S. Fausto, G. Thomas, A. Bernard, D. Gérald, A. A. Mustapha and O. Hamid, Appl. Phys. Lett., 2013, 102, 083107 CrossRef.
- L. Meng, Y. L. Wang, L. Z. Zhang, S. X. Du, R. G. Wu, L. F. Li, Y. Zhang, G. Li, H. T. Zhou, W. A. Hofer and H. J. Gao, Nano Lett., 2013, 13, 685–690 CrossRef CAS PubMed.
- L. Pan, H. J. Liu, X. J. Tan, H. Y. Lv, J. Shi, X. F. Tang and G. Zheng, Phys. Chem. Chem. Phys., 2012, 14, 13588–13593 RSC.
- Q. X. Pei, Y. W. Zhang, Z. D. Sha and V. B. Shenoy, J. Appl. Phys., 2013, 114, 033526 CrossRef.
- S. Cahangirov, M. Topsakal, E. Aktürk, H. Şahin and S. Ciraci, Phys. Rev. Lett., 2009, 102, 236804 CrossRef CAS PubMed.
- H. J. Zhao, Phys. Lett. A, 2012, 376, 3546–3550 CrossRef CAS.
- R. Qin, C. H. Wang, W. J. Zhu and Y. L. Zhang, AIP Adv., 2012, 2, 022159 CrossRef.
- Q. Peng, X. D. Wen and S. De, RSC Adv., 2013, 3, 13772–13781 RSC.
- Q. Qin, W. J. Zhu, Y. L. Zhang and X. L. Deng, Nanoscale Res. Lett., 2014, 9, 521–527 CrossRef PubMed.
- T. Botari, E. Perim, P. A. S. Autreto, A. C. T. Van Duin, R. Paupitz and D. S. Galvao, Phys. Chem. Chem. Phys., 2014, 16, 19417–19423 RSC.
- Q. X. Pei, Z. D. Sha, Y. Y. Zhang and Y. W. Zhang, J. Appl. Phys., 2014, 115, 023519 CrossRef.
- R. E. Roman and S. W. Cranford, Comput. Mater. Sci., 2014, 82, 50–55 CrossRef CAS.
- B. Yang, J. A. Boscoboinik, X. Yu, S. Shaikhutdinov and H. J. Freund, Nano Lett., 2013, 13, 4422–4427 CrossRef CAS PubMed.
- M. T. Lusk and L. D. Carr, Phys. Rev. Lett., 2008, 100, 175503 CrossRef PubMed.
- L. D. Carr and M. T. Lusk, Nat. Nanotechnol., 2010, 5, 316–317 CrossRef CAS PubMed.
- G. B. Xie, R. Yang, P. Chen, J. Zhang, X. Z. Tian, S. Wu, J. Zhao, M. Cheng, W. Yang, D. M. Wang, C. L. He, X. D. Bai, D. X. Shi and G. Y. Zhang, Small, 2014, 10, 2280–2284 CrossRef CAS PubMed.
- X. Y. Sun, Z. G. Fu, M. T. Xia and Y. J. Xu, Theor. Appl. Mech. Lett., 2014, 4, 051002–051003 CrossRef.
- M. Dewapriya and R. Rajapakse, J. Appl. Mech., 2014, 81, 081010 CrossRef.
- O. V. Yazyev and S. G. Louie, Phys. Rev. B: Condens. Matter Mater. Phys., 2010, 81, 195420 CrossRef.
- J. F. Zhang, J. J. Zhao and J. P. Lu, ACS Nano, 2012, 6, 2704–2711 CrossRef CAS PubMed.
- Y. J. Wei, J. T. Wu, H. Q. Yin, X. H. Shi, R. G. Yang and M. Dresselhaus, Nat. Mater., 2012, 11, 759–763 CrossRef CAS PubMed.
- N. Ding, C.-M. L. Wu and H. Li, Phys. Chem. Chem. Phys., 2014, 16, 23716–23722 RSC.
- T. Zhang, X. Y. Li, S. Kadkhodaei and H. Gao, Nano Lett., 2012, 12, 4605–4610 CrossRef CAS PubMed.
- M. Q. Le and R. C. Batra, Comput. Mater. Sci., 2014, 84, 238–243 CrossRef CAS.
- I. A. Ovid'ko and A. G. Sheinerman, J. Phys. D: Appl. Phys., 2013, 46, 345305–345309 CrossRef.
- M. Q. Le and R. C. Batra, Comput. Mater. Sci., 2013, 69, 381–388 CrossRef CAS.
- M. Q. Le and R. C. Batra, Comput. Mater. Sci., 2016, 118, 251–258 CrossRef CAS.
- M. P. Lima, A. Fazzio and A. J. R. da Silva, Phys. Rev. B: Condens. Matter Mater. Phys., 2013, 88, 235413–235417 CrossRef.
- S. Li, Y. F. Wu, Y. H. Wang, T. Jiang, W. Liu and Y. H. Zhao, Sci. Rep., 2015, 5, 7881–7887 CrossRef PubMed.
- H. Sahin, J. Sivek, S. Li, B. Partoens and F. M. Peeters, Phys. Rev. B: Condens. Matter Mater. Phys., 2013, 88, 045434 CrossRef.
- J. Gao, J. Zhang, H. Liu, Q. Zhang and J. Zhao, Nanoscale, 2013, 5, 9785–9792 RSC.
- M. R. Chávez-Castillo, M. A. Rodríguez-Meza and L. Meza-Montes, RSC Adv., 2015, 5, 96052–96061 RSC.
- M. Q. Le and D. T. Nguyen, Appl. Phys. A, 2015, 118, 1437–1445 CrossRef CAS.
- H. Sun, Comput. Theor. Polym. Sci., 1998, 8, 229–246 CrossRef CAS.
- H. Sun, J. Phys. Chem. B, 1998, 102, 7338–7364 CrossRef CAS.
- K. Y. Yan, Q. Z. Xue, D. Xia, H. J. Chen, J. Xie and M. D. Dong, ACS Nano, 2009, 3, 2235–2240 CrossRef CAS PubMed.
- C. F. Wu, Polymer, 2010, 51, 4452–4460 CrossRef CAS.
- S. D. Liu, X. Y. Zhou, W. K. Wu, X. Z. Zhu, Y. R. Duan, H. Li and X. Wang, Nanoscale, 2016, 8, 4520–4528 RSC.
- S. L. Yuan, Y. Zhang, Y. Li and G. Y. Xu, Colloids Surf., A, 2004, 242, 129–135 CrossRef CAS.
- From “Materials studio online help, COMPASS forcefield”.
- C. G. Van de Walle and J. Neugebauer, J. Appl. Phys., 2004, 95, 3851–3879 CrossRef CAS.
- Y. Y. Liu, X. L. Zou and B. I. Yakobson, ACS Nano, 2012, 6, 7053–7058 CrossRef CAS PubMed.
- C. Zhang, A. De Sarkar and R. Q. Zhang, J. Phys. Chem. C, 2011, 115, 23682–23687 CAS.
Footnote |
| † Electronic supplementary information (ESI) available. See DOI: 10.1039/c6ra27291f |
| This journal is © The Royal Society of Chemistry 2017 |

