 Open Access Article
Creative Commons Attribution 3.0 Unported Licence
Synchrotron X-ray tomographic quantification of microstructural evolution in ice cream – a multi-phase soft solid†
Enyu Guo*ab,
Guang Zengab,
Daniil Kazantsevab,
Peter Rocketta,
Julian Bentc,
Mark Kirklandc,
Gerard Van Dalenc,
David S. Eastwoodab,
David StJohn d and
Peter D. Lee
 *ab
*ab
aSchool of Materials, The University of Manchester, Manchester, M13 9PL, UK. E-mail: peter.lee@manchester.ac.uk; enyu.guo@manchester.ac.uk; Tel: +44 (0)1235 567789 Tel: +44 (0)1235 567701 Tel: +44 (0)1235 567886
bResearch Complex at Harwell, Rutherford Appleton Laboratory, Didcot, OX11 0FA, UK
cUnilever R&D, Colworth, MK44 1LQ, UK
dSchool of Mechanical and Mining Engineering, The University of Queensland, St Lucia, Queensland 4072, Australia
First published on 9th March 2017
Abstract
Microstructural evolution in soft matter directly influences not only the material's mechanical and functional properties, but also our perception of that material's taste. Using synchrotron X-ray tomography and cryo-SEM we investigated the time–temperature evolution of ice cream's microstructure. This was enabled via three advances in synchrotron tomography: a bespoke tomography cold stage; improvements in pink beam in line phase contrast; and a novel image processing strategy for reconstructing and denoising in line phase contrast tomographic images. Using these three advances, we qualitatively and quantitatively investigated the effect of thermal changes on the ice cream's microstructure after 0, 7 and 14 thermal cycles between −15 and −5 °C. The results demonstrate the effect of thermal cycling on the coarsening of both the air cells and ice crystals in ice cream. The growth of ice crystals almost ceases after 7 thermal cycles when they approach the size of the walls between air cells, while air cells continue to coarsen, forming interconnected channels. We demonstrate that the tomographic volumes provide a statistically more representative sample than cryo-SEM, and elucidate the three dimensional morphology and connectivity of phases. This resulted in new insights including the role of air cells in limiting ice crystal coarsening.
1. Introduction
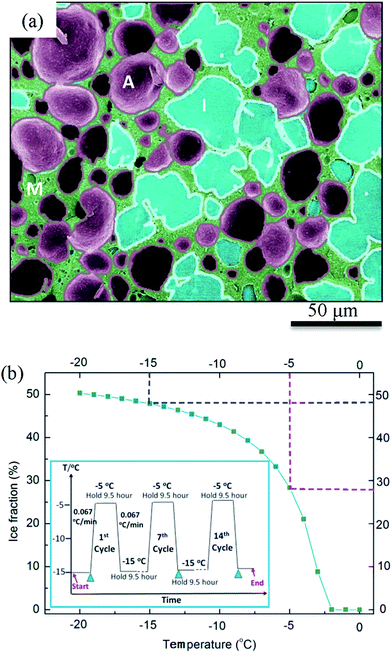
The microstructure of food affects our sensorial perception, its attractiveness, and the manufactured product's shelf-life.1–5 Many foods are soft solids (or soft condensed matter). Soft solids are composites that have complex geometries within their microstructures, exhibit an inherently complex non-Newtonian rheological behaviour under stress, and contain more than one phase (e.g. solid colloids or porous media) in the material.6–10 Examples of soft solids cover a broad range of materials in many subjects, such as muds, fresh concrete, concentrated emulsions, soft biological tissues and biopolymers, as well as many raw materials for domestic and commercial baking, e.g. cheese and butter. Many materials contain porous structures that form a large group of soft solids. In the food industry, soft foams such as ice cream, whipped cream, and aerated desserts (e.g. chocolate mousse) all contain air within a viscous matrix.5,11Ice cream is a complex soft solid made from a mixture of milk, sugars, fats, emulsifiers, stabilizers, flavouring compounds and water which is aerated to a foam structure and frozen to a visco-elastic solid.4,12 Generally, ice cream consists of, by volume, ∼30% ice, ∼50% air, ∼5–15% fat droplets which are finely dispersed in ∼15% of a continuous and unfrozen aqueous sugar solution matrix (denoted here as unfrozen matrix). Thus, ice cream and its manufacture contains all three states of matter: solid, liquid and gas.4 A schematic of a typical microstructure of ice cream is presented in Fig. 1(a).
The quality of ice cream is largely dependent on the size and connectivity of the constituent air cells and ice crystals. For example, smaller ice crystals and air cells increase our sensory perception of smoothness and creaminess. The size of the components of ice cream are typically reported as: air cells 20–150 μm, ice crystals 10–75 μm, and circa 0.4 μm fat particles dispersed in the unfrozen aqueous phase.4,13 Ice cream is thermodynamically unstable at temperatures above the glass transition temperature (ca. −30 °C),14 where irreversible coarsening of both ice crystals and air cells can occur over time. Temperature variations above −30 °C are inevitable during shipping, storage at the grocery store, storage in domestic freezers (ca. −18 °C), and even higher temperatures on the consumer's table. Deterioration of the microstructure due to coarsening can cause a loss of air content in the worst condition, and the development of a coarse icy texture.15 Coarsening of air cells also causes structural instability in other similar soft foam products, such as those mentioned above, that contain air cells within a viscous liquid or semi-solid structure.5
Investigation of the microstructural changes during thermal cycling of ice cream allows the establishment of process–structure–property relationships that can improve the manufacturers' processing methods and the development of new formulations. The dimensions and morphology of ice crystals and air cells have previously been evaluated by techniques associated with either light microscopy16,17 or cryo scanning electron microscopy (cryo-SEM).18,19 Cryo-SEM samples are usually prepared by quench-freezing in liquid nitrogen or nitrogen slush (∼−200 °C), transferred to the cryo-SEM, fractured with a knife to create a clean internal surface, sublimated (freeze etching) to allow clear visualization of the ice crystals and finally coated with a thin layer of metal to prevent charging effects during SEM. Cryo-SEM is a powerful imaging technique with excellent spatial resolution but much of the structure remains hidden from view as these observations are made in 2D, making it difficult to visualise connectivity through the sample volume, and quantification is compromised by the fracture plane whilst the phases can be very irregular in 3D.
The application of X-ray microtomographic analysis provides a non-invasive means of observing three-dimensional structures and in most cases is able to sustain a natural environment.5 Pinzer et al.14 successfully applied this technique to the 3D observation of ice cream microstructures using a laboratory X-ray source, achieving a resolution of ∼10 μm. Contrast agents, such as sodium iodine, were added to enhance phase contrast between the microstructural features. However, contrast agents may affect the initial structure of fresh ice cream and subsequent changes to this structure, and cannot be used for samples manufactured by an ice cream producer. Synchrotron X-ray tomography offers higher resolution and enhanced imaging capabilities. Recently developed synchrotron X-ray imaging techniques, especially phase-contrast X-ray tomography, have successfully imaged materials with relatively weak phase contrast between their features. Examples include the dendritic growth that occurs in the manufacture of lithium batteries,20,21 and soft tissue response in bioactive glass scaffolds.22,23 Thus, synchrotron X-ray tomography is now able to examine the 3D structure of phases in soft solids such as ice cream that have relatively low phase contrast.
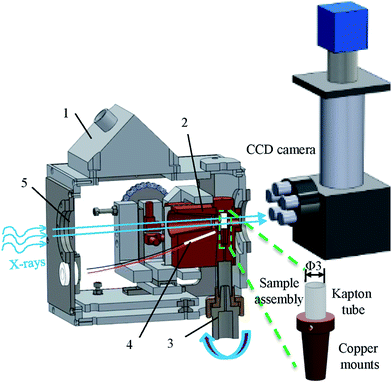
The aim of this study is to gain a better understanding of the manner in which soft matter that contains solid, liquid and gas phases change during controlled thermal cycling. Microstructures of fresh ice cream samples subjected to 0, 7 and 14 thermal cycles were examined by both cryo-SEM and synchrotron X-ray tomography. A specially built cold stage was developed to provide a well-controlled sample environment for tomographic imaging (Fig. 2). The stage was incorporated into the Diamond-Manchester Branchline (DMB) at Diamond Light Source (DLS, U. K), which was optimized for pink beam, in line phase contrast. A novel iterative reconstruction algorithm was applied to characterize the structure of ice cream samples and quantify the size and morphology of both ice crystals and air cells. The resulting 3D microstructures were compared to 2D cryo-SEM images, and highlighted the benefits of 3D synchrotron investigation of materials with complex multi-phase, multi-state, soft matter.
The 3D tomographic image analysis method allowed the separation of phases so that changes to the size, distribution and morphology of air cells, ice crystals and the unfrozen matrix during thermal cycling can be observed and measured without the presence of the other phases. The results can then be considered together to provide a complete description of the formation and degradation of ice cream's microstructure due to thermal cycling.
2. Materials and methods
2.1 Preparation of ice cream samples
500 ml blocks of fresh ice cream containing 5% fat were prepared using a scraped surface heat exchanger. 3 mm Kapton sample tubes (American Durafilm Co. Inc, Holliston, U. S) were inserted into the ice cream before blast freezing at −35 °C and subsequent storage at −25 °C. Fresh samples were subjected to thermal cycling from −15 to −5 °C as illustrated in the inset of Fig. 1(b). Each cycle began with holding the sample at −15 °C for 9.5 hours followed by heating at a rate of 0.067 °C min−1, then holding for 9.5 hours at −5 °C and cooling back to −15 °C at the same rate as the heating rate. A fresh sample denoted C0, and samples subjected to 7 cycles over 1 week (C7) and 14 cycles over 2 weeks (C14) were prepared for examination.Samples were cut from the central region of a 500 ml block and cooled in dry ice to minimize possible effects of the wall of the sample's container on the evolution of the ice cream's microstructure. Cryo-SEM samples of 8 × 3 × 2 cm3 cut from the block with a pre-cooled scalpel were then further cut to a size of 8 × 8 × 10 mm3. These samples were mounted onto a pre-cooled (−196 °C) dovetail stub holder and transferred to a low temperature preparation chamber (Gatan Alto 2500), where the sample was fractured and freeze etched. The sample was then coated with 2 nm Pt and transferred to a field-emission SEM (JEOL 7600 FESEM) fitted with a Gatan cold stage at −126 °C to obtain micrographs. For 3D synchrotron tomography 3 mm diameter Kapton tubes filled with ice cream were cut from the block of ice cream on a bed of dry ice shortly before X-ray analysis. Sample preparation was undertaken at low temperatures (−80 to −196 °C). Thus, the sample microstructure was not expected to change before SEM and tomography were undertaken.
2.2 Design of the cold-stage for synchrotron experiments
Fig. 2 illustrates the experimental setup for undertaking tomography. A specimen cold-stage was designed to operate from ambient to −40 °C with an accuracy approaching 0.1 °C. The sample temperature is maintained, e.g. at −15 °C for synchrotron imaging, within a thermally radiating cavity with the sample mounted on a rotating, thermally conducting, support spindle. The cold-block was cooled by thermoelectric cooling modules and heated by miniature resistance heaters. Two P100-type platinum resistance thermocouples were inserted into the cold-block, as close as possible to the specimen support capsule. The temperature controller (ITC503, Oxford Instruments, U. K) was provided with 64 W of heater power and three input channels for sensor monitoring.To ensure good alignment, the rotation spindle was attached to two orthogonal Newport slides fixed on the system's rotation table. A controlled gas bleed (∼0.15 bar) out of the front X-ray window prevents water droplet condensation and maintains the pressure at slightly above ambient so that seals are not required at the entry aperture of the rotation spindle and any other smaller access ports. Very soft flexible tubing was used for the heat exchanger to transport water coolant into the chamber in an unconstrained manner to allow free movement of the cold block assembly.
2.3 Synchrotron X-ray tomography
Synchrotron X-ray tomography was undertaken on the DMB which has a high flux undulator, producing a pink beam, with peak modes of narrow bandwidth (ca. 300 eV), with high and low bandwidth filters removing modes outside the energy range of 15 to 30 keV. This, combined with the ca. 250 m beamline length provides excellent in line phase contrast. A 2560 × 2160 pixel PCO Edge 5.5 CMOS camera optically coupled to a single crystal CdWO4 scintillator was used to record the projection images. For each tomographic run, 3601 projections were acquired over a 180° rotation with an exposure time of 0.1 s. For optimum imaging quality the distance between the sample and the scintillator was set to be ∼3.5 cm. The final pixel size obtained was 0.8 μm per pixel.2.4 Processing of the tomographic data
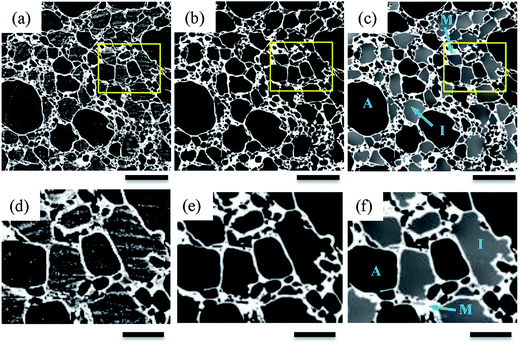
Preliminary tomographic reconstruction was performed using the filtered-back projection (FBP) method. However, this method results in very noisy reconstructed images with very low contrast between the features, along with ring artifacts, making segmentation almost impossible (e.g. Fig. 3(a)). Thus, an improved reconstruction algorithm was sought. One possible solution is to use a single-distance non-iterative phase retrieval algorithm.24–26 This image processing technique has proved to be a useful tool for improving image quality and enhancing the phase contrast in cases where the phases have relatively low contrast between them.24 The ring removal function can be incorporated into the phase retrieval algorithm.27–29 However, one should be careful when applying this technique as the use of a Paganin phase retrieval algorithm30 may result in smoothing of the feature edges hampering the identification of features such as ice crystals that are separated by a thin layer of unfrozen matrix, making quantification less precise.To overcome these limitations, a novel image processing strategy and reconstruction algorithm was developed to achieve better quality and quantifiable outcomes from the collected data. The new method consists of (1) pre-processing of tomographic projections by removing strips in sinogram space (strips normally result in undesirable ring artifacts in reconstructed images) using a wavelet filtering method,31 (2) the processed projection data are then reconstructed to a volume of 2k × 2k × 2k voxels using the FBP algorithm with a Ram-Lak filter,32 and (3) in order to remove noise and preserve important phase boundaries (such as ice-matrix contours, Fig. 3(b)), 3D nonlinear anisotropic diffusion is performed.33
The denoising procedure was restricted to smooth only within particular regions (ice-crystals and air cells) but not across ice-matrix edges. This was done by finding the lower intensity bound for ice-matrix boundaries (this feature has the most prominent contrast) and neighbouring cells which lie across the ice-matrix region that are ignored in the diffusion process. That is, we do not diffuse across the ice-matrix boundaries and therefore more iterations can be executed to equalize intensity variations within ice crystals and air cells (300 iterations of the explicit scheme are performed33). The employed edge-constrained diffusion process was similar to the method used to drive filtering based on an anatomical image in emission tomography.34 As a result, an image was produced with a higher signal-to-noise ratio, better contrast and without artifacts (see Fig. 3(c)). One should, however, be careful how the ice-matrix is extracted because some edges can be destroyed (smoothed out) by diffusion if segmentation is incorrect. Therefore, by keeping the segmented ice-matrix as a fixed constraint for the diffusion process, loss of information can be avoided. Alternatively, one should consider reconstructing the data iteratively using regularization which can impose similar constraints.35
Finally, the reconstructed volume was cropped into a smaller volume for 3D analysis. 3D rendering of the features, as well as quantification of size, etc., was performed using Avizo® (FEI-VSG, France). The watershed algorithm provided in the Avizo software was used to separate the features for quantification.
3. Results and discussion
3.1 Comparison between SEM and X-ray tomography
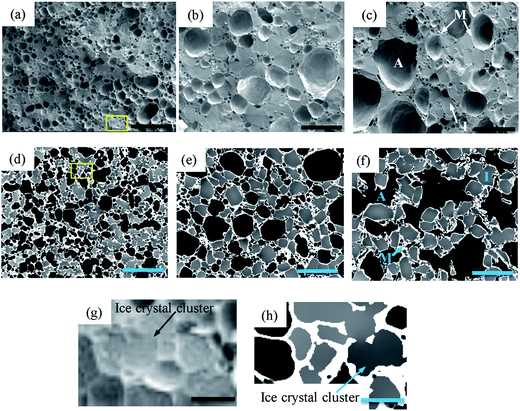
Fig. 4(a–c) show typical cryo-SEM results for samples that are fresh (C0) and thermally cycled seven (C7) and fourteen (C14) times. For comparison, 2D tomographic slices, extracted after application of the image processing described in Section 2.4, are shown in Fig. 4(d–f). The dark features are air cells, the light grey regions ice crystals, and the continuous pale white features are the unfrozen matrix between the air cells and ice crystals. In both cases, the small air cells and ice crystals (e.g. flat regions in Fig. 4(a)) are uniformly dispersed in the fresh sample before thermal cycling was applied. The air cells and ice crystals are separated by a thin continuous unfrozen matrix layer which is much more clearly visible in the tomographic images.After thermal cycling, the microstructures of the samples change significantly with an increase in size of both air cells and ice crystals and a decrease in number for both, as can be seen in Fig. 4(b, e)(C7) and (c, f)(C14). Compared to the cryo-SEM images (Fig. 4(b and c)), the features are more clearly defined due to the enhanced contrast of each phase in the 2D tomographic images (Fig. 4(e and f)). For example, the ice crystals in the bottom right hand region of the cryo-SEM image (Fig. 4(b)), cannot be readily discerned from the surrounding air cells.
The tomographic images (Fig. 4(e and f)) also show that the surface morphology of air cells is significantly affected by the morphology of the large ice crystals whereas the surface of the air cells appear quite smooth in the cryo-SEM images, particularly Fig. 4(c). The tomographic images of C14 (Fig. 4(f)) suggest a very different morphology of the air cells from the cryo-SEM image (Fig. 4(c)), where the connectivity of the air cells is evident in the tomographic image while connectivity is not observed in the cryo-SEM images. Further, the unfrozen matrix is clearly defined in the tomographic images Fig. 4(d–f and h) while the cryo-SEM images need close inspection to identify the continuous layers of the matrix phase. Note that the 2D cryo-SEM and tomographic results are similar enough to suggest that sample preparation is not altering the results significantly.
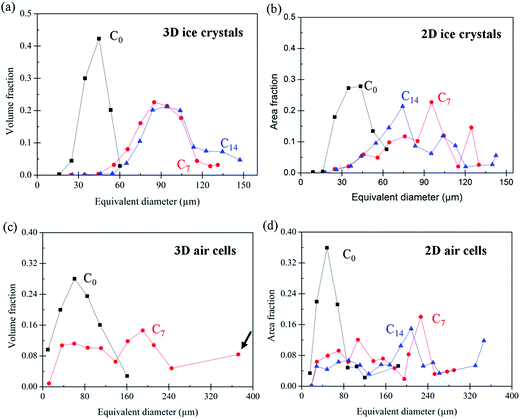
The size distribution of air cells and ice crystals is plotted in Fig. 5 and quantified in Table 1 as average size, standard deviation, and mode (or peak of the distribution, since many are skewed). The 2D and 3D size distributions are also plotted on the same figure for each phase (see ESI Fig. 1†) for direct comparison. Results are presented as the equivalent diameter of area weighted (2D cryo-SEM) and volume weighted (3D tomography) circles and spheres, respectively, versus area/volume fraction. Area and volume fraction was chosen over number density to demonstrate the large phase fraction occupied by larger air cells and ice crystals. Note that features having a size smaller than 20 μm in diameter are not included for analysis and that the 3D air cells for the C14 sample are also not analysed due to their highly interconnected characteristics in three-dimensional space.
| Air cells | Ice crystals | |||||||
|---|---|---|---|---|---|---|---|---|
| 2D SEM | 3D X-ray tomography | 2D SEM | 3D X-ray tomography | |||||
| Average (area weighted) | Mode | Average (volume weighted) | Mode | Average (area weighted) | Mode | Average (volume weighted) | Mode | |
| Fresh sample (C0) | 41 ± 19 | 68 | 36 ± 19 | 60 | 34 ± 10 | 44 | 38 ± 9 | 45 |
| Cycled 7 times (C7) | 61 ± 50 | 226 | 48 ± 30 | 195 | 68 ± 31 | 95 | 78 ± 18 | 85 |
| Cycled 14 times (C14) | 66 ± 61 | 208 | N/A | N/A | 65 ± 25 | 74 | 84 ± 22 | 94 |
A few observations can be made from the data in Table 1. Firstly, the mode is much larger than the average size for both air cells and ice crystals, demonstrating both distributions are skewed by a large number of small features. However, after thermal cycling, the presence of a small number of very large bubbles can be seen. For example, the number of air cells with a size between 20–50 μm accounts for ∼70%, compared to ∼30% for the air cells which are larger than 50 μm.
Secondly, the difference between the mode and average size is more significant for the air cells than the ice crystals. This is because the size of air cells spans a wider range (e.g. 20–370 μm for the 3D air cells in the C7 sample), as compared to the ice crystals (e.g. 55–130 μm for the 3D ice crystals in the C7 sample).
Thirdly, the area weighted average size of 2D ice crystals decreases slightly from C7 to C14, while there is a slight increase, which would be expected, for the 3D ice crystals. Thus, the results measured by the 2D method might not be representative of the actual values. This is mainly because a 2D cryo-SEM image is the intersection of a plane with the three-dimensional space. The number of objects observed in a 2D image does not correspond to the number per unit volume. Consequently, the observed apparent size, as well as the size distribution, is generally different from the true distribution in 3D. In addition, estimation of the true 3D distribution parameters from 2D ice cream images using unfolding methods is not possible because the air cells and ice crystals are not spherical.36 The differences between 3D tomographic information and 2D cryo-SEM are also highlighted by the consistent underestimation of the average equivalent diameter of the ice crystals by cryo-SEM (Table 1). Further, the tomographic volumes provide better statistics as the number of crystals available for analysis is much greater than 2D cryo-SEM.
3.2 Microstructural evolution
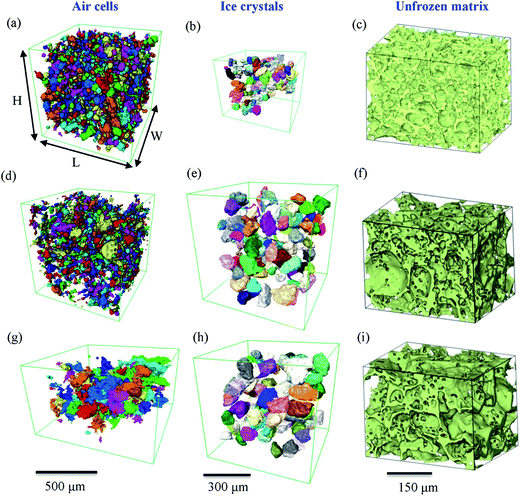
The change of size for air cells and ice crystals after each set of 7 cycles is discussed further in the following sections.The morphology of the individual features of ice cream (air cells, ice crystals and unfrozen matrix) were segmented based on their differences in phase contrast, and the 3D renderings are shown in Fig. 6. In this figure, air cells and ice crystals are individually colour-rendered. Similar to the results in 2D, the coarsening of both air cells and ice crystals occurs with each set of seven thermal cycles. However, in 3D the complex irregular morphologies of the phases and their actual dimensions can be quantified due to the greater microstructural detail.
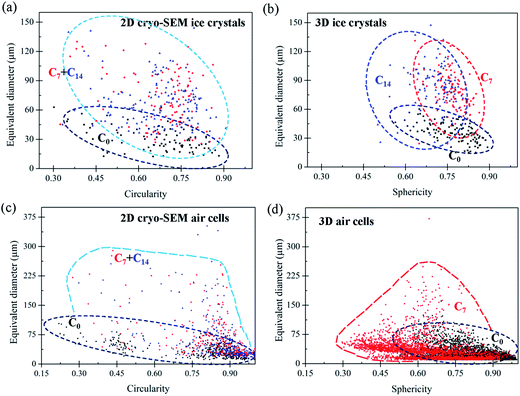
For example, a comparison of the equivalent diameter of both air cells and ice crystals was plotted as a function of morphological factors (Fig. 7), in this case circularity and sphericity for 2D and 3D, respectively. The circularity (C) and sphericity (S) are defined by  , and
, and  , where A is the area of the particle in 2D, P the perimeter of the particle in 2D, Vp the volume of the particle in 3D, and Ap the surface area of the particle in 3D. The plots in Fig. 7 clearly show significant differences between 2D and 3D (Fig. 7(a and b) vs. (c and d)). In 2D, the data points are more scattered while they are more concentrated for the 3D data, which is consistent with data in Fig. 5. The reason for the two concentrated areas at the bottom of Fig. 7(d), both below 75 μm in size, is uncertain. This observation does not correspond to Fig. 5(c) where no separation of the volume fraction into separate size regions is observed. The data in Fig. 7(d) may be affected by the much larger error, noise and aggregation/clustering that occurs during processing of the smaller diameter air cells.
The differences in the spread of data points observed in Fig. 7 along with observations of channels forming between large air cells and the clear observations of the relative relationship between ice crystals, the unfrozen matrix and air cells provided by 3D tomography and described in more detail in the following sections, highlight the benefits of 3D tomography.
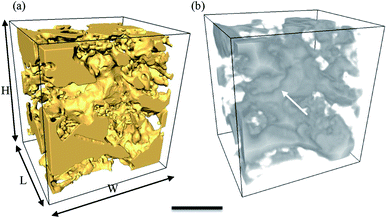
3.3 Microstructural evolution of air cells
While the size of air cells continues to increase from C0 to C14, their morphology evolves from a relatively round shape in the fresh sample (C0) to very irregular shapes in sample C14. In addition, it seems from Fig. 4(f) that some of the large air cells in C14 have formed interconnected channels. This observation is verified by a 3D image shown in Fig. 8. The formation of long channels between the air cells is the result of continuous coarsening of air cells that occurs between 7 and 14 cycles. This channelling feature was not observed in the 2D cryo-SEM images (e.g. Fig. 4(c)).In the C7 and C14 samples, tiny air cells are also present, as observed in Fig. 4(e and f) and 6(d). These tiny air cells appear unchanged from the fresh sample, and suggest that the large bubble may have grown by coalescence and these fine cells have yet to merge into a larger one. These fine bubbles create a bimodal distribution in C7, as shown in Fig. 5(c) (and comparatively in ESI Fig. 1(d)†). Note, this is not captured as clearly by the 2D data due to the greater scatter.
The formation of very large air cells (e.g. ∼370 μm in C7) with irregular morphologies resulting from coarsening (or coalescence) is reflected by the distribution of the sphericity of 3D air cells in C7, Fig. 7(d), where the distribution of values moves to the left-upper corner, indicating a more irregular shape after thermal cycling. Both Ostwald ripening and coalescence may contribute to the coarsening of air cells. Ostwald ripening is driven by the lower free energy in larger air cells due to surface tension and lower surface curvature, making them grow at the cost of smaller air cells.37 Ripening is more obvious for smaller air cells at higher temperatures.38 In contrast, decreased viscosity of the unfrozen matrix at low temperatures decreases the diffusion rate of the gas between air cells and thus inhibits Ostwald ripening.39 Ostwald ripening should be greatest at the higher temperatures during thermal cycling. Our samples contain stabilisers which increase the viscosity of the unfrozen matrix, decreasing the diffusion rate of air in the matrix.16 The presence of stabilisers may limit the growth of the small cells observed in C7 and C14.
Coalescence takes place when two air cells in close proximity form a single large cell by the formation of a bridge between them facilitating merging to form a single, larger, air cell. Coalescence can be promoted by the presence of solid particles on the surface of cells. For example, in ice cream, when a hydrophobic particle contacts two air cells at an obtuse angle it has been shown to cause the thin film to break and coalescence to occur.39 Possible examples of bridging between grains can be discerned in Fig. 4(d and e) and 6(a and d).
Drainage can also play a role in the instability of the air structure at the higher temperatures where a large volume fraction of unfrozen matrix is formed due to melting of the ice crystals.40 Gravitational forces cause the fluid to flow down around the air cells while buoyancy forces cause the air cells to rise. Towards the top of the sample the unfrozen matrix can become too thin to support itself thus forming large and interconnected air cells. Because the images are a fraction of the sample volume cycled, long range drainage cannot be evaluated. However, the presence of stabilisers should prevent significant drainage occurring. These observations on the air cells are summarised in Table 2a, together with the evolving mechanisms.
3.4 Microstructural evolution of ice crystals
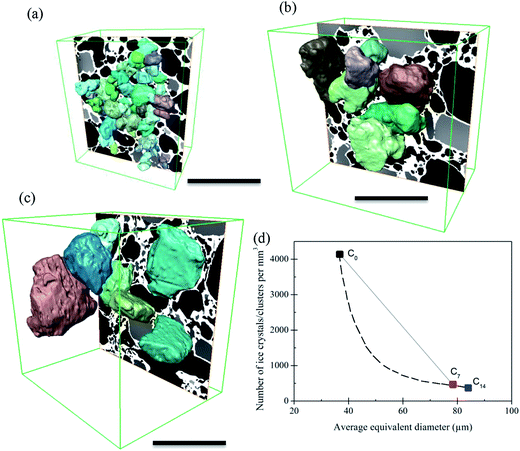
Similar to air cells, the size of ice crystals increased significantly from C0 to C7 (Fig. 4 and 6). Meanwhile, the morphology of ice crystals remains relatively faceted from C0 to C14. However, only a slight change in size of the ice crystals occurred from C7 to C14, indicating that continued thermal cycling after C7 doesn't have a significant effect on the size of ice crystals. One possible explanation is that after 7 cycles most of the surfaces of the ice crystals are close to the size of the walls between air cells, as can be observed in Fig. 4(f). Thus air cells act as diffusion barriers, reducing Oswald growth to diffusion only in the plane of the wall. Note the ice crystals appear to rotate to align with air cells leaving only a very thin unfrozen matrix layer next to the air bubble surface. Similarly, the presence of small air cells, which may be pushed by the growing ice crystals, will also act as diffusion barriers (Fig. 4(e and f)), impeding growth.In the fresh sample, some of the tiny ice crystals have formed relatively large ice clusters. Examples are highlighted in Fig. 4(g and h) by the rectangles superimposed on Fig. 4(a and d). These clusters of relatively small ice crystals may evolve to form large faceted ice crystals during thermal cycling. A few ice crystals were selected for detailed examination, as shown in Fig. 9. The average equivalent diameter of the ice crystals is quantified from the 3D tomographic data and the results are shown in Table 1. The average size increases from 37 ± 9 μm (C0) to 78 ± 18 μm (C7), and further to 84 ± 22 μm (C14); doubling from C0 to C7, while only increasing by ∼6 μm (∼8%) from C7 to C14. Note, the C0 average size is an upper bound as not all ice crystal clusters could be separated into single ice crystals.
Concomitant with an increase in ice crystal size was a decrease in number density (Fig. 9(d)) from 4139 mm−3 for the fresh sample (C0), to 463 mm−3 (C7) and 349 mm−3 (C14). Due to the large change in size from C0 to C7 it is unlikely to be a linear change. During the heating stage, ice crystals will partially melt. According to the curve in Fig. 1(b) about 40% of the ice present at −15 °C will melt by the time it reaches −5 °C. Thus, melting of the ice crystals will continue to occur during warming, reaching the maximum melting rate at the hottest temperature, −5 °C. As shown by the size distribution presented in Fig. 5(a), most of the small ice crystals have melted or dissolved by C7. Many of the finest crystals probably melt during the first few cycles and are not re-nucleated on cooling. The extra water provided by the melted ice crystals will freeze onto the larger remaining crystals, accelerating regrowth and shifting the distribution to larger sized ice crystals (Fig. 5(a)) (note regrowth is the same as solidification, also known as propagation, during the manufacture of fresh ice cream). To reflect the impact of melting, the dashed line on Fig. 9(d) represents the possible rate of change in the number of ice crystals between C0 and C7.
Coarsening of the ice crystals is the result of ice recrystallization during each thermal cycle in order to minimize the overall surface free energy of the whole ice crystal phase.41–43 Several mechanisms have been proposed for ice crystal coarsening: Oswald ripening (or migratory recrystallization), isomass recrystallization and accretion recrystallization (or crystal fusion).44,45
Oswald ripening of the ice crystals will be accelerated by their remelting during thermal cycling,45,46 removing the energy barrier of surface detachment from the crystal. Local melting and recrystallisation will also provide an avenue for increased water diffusion. Isomass recrystallization is the rounding of corners in a single ice crystal/cluster or internal structure reorganization while maintaining the overall mass. This process is unlikely to cause the observed significant increase in crystal size, and indeed many crystals become more faceted rather than rounder. The third possible mechanism is accretion recrystallization, where a larger crystal is formed by the physical coalescence of two or more ice crystals in close contact. Although in C0 there appears to be crystals fused together (Fig. 4(h)), this is most likely due to insufficient resolution, as Fig. 4(e and f) almost all crystals appear separated by a thin layer of unfrozen matrix, which would inhibit accretion.
The above mechanisms may occur simultaneously or dominate at particular temperatures. However, due to large temperature changes during thermal cycling, it is hypothesized that a remelt–recrystallization–solidification mechanism that enhances Oswald ripening dominates, increasing ice crystal size and decreasing number density. As mentioned earlier, during the heating stage the ice crystals will partially or completely melt converting about 40% of the ice into water. The water molecules released during dissolution of these crystals will, on cooling, contribute to a faster rate of growth of the remaining ice crystals as re-nucleation of the dissolved crystals within the unfrozen matrix is difficult. These partially melted ice crystals will then start to grow by the kinetic deposition of the water molecules at the surface of crystal seeds. Due to the slow cooling rate (0.067 °C min−1), the growth rate will be relatively slow leading to the formation of larger faceted ice crystals rather than more spherical crystals.43 The diffusion rate of the water molecules would also become slower as the temperature gradually decreased because water mobility gradually reduces as the viscosity increases at lower temperatures.15 These observations on the ice crystals are summarized in Table 2b, together with their interactions with air cells in Table 2a.
3.5 The unfrozen matrix
The 3D morphologies of the unfrozen matrix shown in Fig. 6(c, f and i), form a continuous foam-like network throughout the microstructure of all samples. At higher temperatures, the unfrozen matrix becomes flexible and therefore able to relieve stresses caused by heating and cooling. Compared to the evolution of air cells and ice crystals, the unfrozen matrix exhibited less change during thermal cycling. For example, the average thickness of the matrix shows that there is only a slight alteration from 9.4 ± 2.7 μm (C0) to 11.6 ± 4.5 μm (C7) and 11.3 ± 3.6 μm (C14).Drainage of the unfrozen matrix has been observed before hardening is completed during manufacturing.40 However, drainage was not observed in this study which would be expected as stabilisers have been used in the manufacture of the ice cream samples.16 These observations on the unfrozen matrix are summarized in Table 2c, together with their interactions with air cells (Table 2a) and ice crystals (Table 2b).
3.6 Summary of the microstructural evolution of ice cream
Table 2 summarises the changes that occur during thermal cycling of ice cream samples. Considering Table 2, changes in the microstructure during heating and cooling cycles can be described in terms of the interaction between the three main phases. The unfrozen matrix, reinforced by ice crystals, is a crucial element in controlling the stability of ice cream. The unfrozen matrix is the glue that holds the structure together, the repository for holding and providing water during melting and solidification of the ice crystals controls the development of the air cells' morphology, as well as providing sugars, flavourings, fat, stabilisers, protein etc., which together determine the quality of manufactured ice cream products. The network of the unfrozen matrix facilitates the formation of ice crystal networks within the matrix. It also defines the boundaries of the interconnected air cell network. The faceted ice crystals also affect the morphology of the air cells as observed in Fig. 4 and more clearly in the 3D image presented in Fig. 10 where the central air cell is bounded by faceted ice crystals. The narrow gaps between the ice crystals and air cells are the location of the unfrozen matrix layers separating them.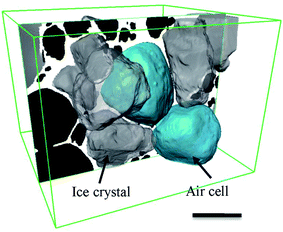 | ||
| Fig. 10 3D rendering of extracted air cells and ice crystals showing the morphologic relationship between the air cells and the surrounding ice crystals. Scale bar is 100 μm. | ||
Melting and solidification have the largest effect on the microstructure given the large volume of ice (∼40%) that melts and regrows during each cycle. Melting enhances Ostwald ripening and the subsequent effect on the unfrozen matrix's viscosity would promote migratory recrystallization.
Because this research only studied samples taken after 0, 7 and 14 thermal cycles, what occurs during heating, holding at −5 °C and cooling, is informed by previous studies on analogous systems reported in the literature. In situ tomographic studies during thermal cycling are required to reveal details that will deepen our understanding of the mechanisms and their kinetics responsible for microstructural change.
4. Conclusions
The effect of thermal cycling on the microstructural evolution in ice cream, a four phase soft solid, was quantified using 3D synchrotron X-ray imaging. This required advances in synchrotron tomography: a bespoke tomography cold stage; improvements in pink beam in line phase contrast; and a novel image processing strategy for reconstructing and denoising in line phase contrast tomographic images. These techniques should be applicable to a wide range of low X-ray attenuation variation soft solids. The results demonstrate:• That 3D measurements from synchrotron X-ray tomography provide more statistically representative quantitation than cryo-SEM, together with 3D morphology and connectivity of phases.
• The size of ice crystals increases while the number dramatically decreases during the first 7 thermal cycles. The growth rate of crystals becomes significantly slower after 7 thermal cycles. The reduction in growth rate of the ice crystals is attributed to the limited amount of water readily available from the surrounding unfrozen matrix and the adjacent ice crystals and air cells which restrict further growth.
• Alignment of ice crystals within the unfrozen matrix occurs to minimise surface area and reduce local stresses developed during each additional thermal cycle.
• Air cells continued to grow into large interconnected irregular shapes and channels as the number of thermal cycles increase. It was observed that a bimodal distribution of air cell sizes developed with small cells remaining present in the microstructure.
• The thermally cycled microstructure develops interrelated networks where the ice crystal network is aligned with the unfrozen matrix network both of which control the boundaries of the interconnected air cell network.
5. Data statement
Representative samples of the research data are shown in the figures/tables; however, the underlying raw data is not shared online due to its size.Acknowledgements
This work was made possible by the facilities and support provided by Unilever R&D (Colworth, U. K), the Diamond-Manchester Collaboration and the Research Complex at Harwell, funded in part by the EPSRC (EP/I02249X/1, EP/J010456/1 and EP/M009688/1). We acknowledge the use of the synchrotron facility in Diamond Light Source Ltd. (MT12194-1 & MT12195-1). We thank the American Durafilm Co. Inc (Holliston, U. S) for providing sample tubes. We also thank Dr Joan Vila-Comamala, Mr Sansan Shuai, and Dr Biao Cai for technical support for imaging. Discussions with Dr Shyamprasad Karagadde of the Indian Institute of Technology Bombay were greatly appreciated.References
- P. D. Howes, S. Wongsriruksa, Z. Laughlin, H. J. Witchel and M. Miodownik, PLoS One, 2014, 9, e105035 Search PubMed.
- E. A. Foegeding, Curr. Opin. Colloid Interface Sci., 2007, 12, 242–250 CrossRef CAS.
- C. Wilkinson, G. B. Dijksterhuis and M. Minekus, Trends Food Sci. Technol., 2000, 11, 442–450 CrossRef CAS.
- C. Clarke, The science of ice cream, Croydon, 2012 Search PubMed.
- G. Van Dalen, Microsc. Microanal., 2012, 03, S8–S12 Search PubMed.
- R. G. M. Van Der Sman and A. J. Van Der Goot, Soft Matter, 2009, 5, 501–510 RSC.
- J. Ubbink, A. Burbidge and R. Mezzenga, Soft Matter, 2008, 4, 1569–1581 RSC.
- A. D. Freed, Soft Solids: A Primer to the Theoretical Mechanics of Materials, Birkhäuser, Heidelberg, 2014 Search PubMed.
- D. T. N. Chen, Q. Wen, P. A. Janmey, J. C. Crocker and A. G. Yodh, in Annual Review of Condensed Matter Physics, ed. J. S. Langer, 2010, vol. 1, pp. 301–322 Search PubMed.
- A. Kovalenko, K. Zimny, B. Mascaro, T. Brunet and O. Mondain-Monval, Soft Matter, 2016, 12, 5154–5163 RSC.
- D. Rousseau and P. Smith, Soft Matter, 2008, 4, 1706–1712 RSC.
- H. D. Goff and R. W. Hartel, Ice Cream, Springer, 2013 Search PubMed.
- R. H. Y. Chang, Int. Dairy J., 2002, 12, 463–471 CrossRef.
- B. R. Pinzer, A. Medebach, H. J. Limbach, C. Dubois, M. Stampanoni and M. Schneebeli, Soft Matter, 2012, 8, 4584–4594 RSC.
- A. Regand and H. D. Goff, Food Hydrocolloids, 2003, 17, 95–102 CrossRef CAS.
- R. W. H. Y. Chang, J. Food Eng., 2002, 55, 59–70 CrossRef.
- R. W. H. Y. Chang, J. Food Eng., 2002, 55, 71–78 CrossRef.
- K. B. Caldwell, H. D. Goff, D. W. Stanley and R. W. Martin, Food Struct., 1992, 11, 1–9 Search PubMed.
- A. A. Flores and H. D. Goff, J. Dairy Sci., 1999, 82, 1399–1407 CrossRef CAS.
- D. S. Eastwood, R. S. Bradley, F. Tariq, S. J. Cooper, O. O. Taiwo, J. Gelb, A. Merkle, D. J. L. Brett, N. P. Brandon, P. J. Withers, P. D. Lee and P. R. Shearing, Nucl. Instrum. Methods Phys. Res., Sect. B, 2014, 324, 118–123 CrossRef CAS.
- D. S. Eastwood, P. M. Bayley, H. J. Chang, O. O. Taiwo, J. Vila-Comamala, D. J. L. Brett, C. Rau, P. J. Withers, P. R. Shearing, C. P. Grey and P. D. Lee, Chem. Commun., 2015, 51, 266–268 RSC.
- S. Yue, P. D. Lee, G. Poologasundarampillai, Z. Yao, P. Rockett, A. H. Devlin, C. A. Mitchell, M. A. Konerding and J. R. Jones, J. Mater. Sci.: Mater. Med., 2010, 21, 847–853 CrossRef CAS PubMed.
- S. Yue, P. D. Lee, G. Poologasundarampillai and J. R. Jones, Acta Biomater., 2011, 7, 2637–2643 CrossRef CAS PubMed.
- T. Weitkamp, D. Haas, D. Wegrzynek and A. Rack, J. Synchrotron Radiat., 2011, 18, 617–629 CrossRef CAS PubMed.
- M. A. Beltran, D. M. Paganin, K. Uesugi and M. J. Kitchen, Opt. Express, 2010, 18, 6423–6436 CrossRef CAS PubMed.
- M. A. Beltran, D. M. Paganin, K. K. W. Siu, A. Fouras, S. B. Hooper, D. H. Reser and M. J. Kitchen, Phys. Med. Biol., 2011, 56, 7353–7369 CrossRef CAS PubMed.
- N. T. Vo, M. Drakopoulos, R. C. Atwood and C. Reinhard, Opt. Express, 2014, 22, 19078–19086 CrossRef PubMed.
- R. C. Atwood, A. J. Bodey, S. W. T. Price, M. Basham and M. Drakopoulos, Philos. Trans. R. Soc. London, Ser. A, 2015, 373, 20140398 CrossRef PubMed.
- C. Raven, Rev. Sci. Instrum., 1998, 69, 2978–2980 CrossRef CAS.
- D. Paganin, S. C. Mayo, T. E. Gureyev, P. R. Miller and S. W. Wilkins, J. Microsc., 2002, 206, 33–40 CrossRef CAS PubMed.
- B. Muench, P. Trtik, F. Marone and M. Stampanoni, Opt. Express, 2009, 17, 8567–8591 CrossRef CAS.
- A. C. Kak and M. Slaney, Principles of computerized tomographic imaging, IEEE Press, 1988 Search PubMed.
- J. Weickert, Anisotropic diffusion in image processing, Teubner, Stuttgart, 1998 Search PubMed.
- D. Kazantsev, S. R. Arridge, S. Pedemonte, A. Bousse, K. Erlandsson, B. F. Hutton and S. Ourselin, Phys. Med. Biol., 2012, 57, 3793–3810 CrossRef PubMed.
- D. Kazantsev, E. Guo, A. Kaestner, W. R. B. Lionheart, J. Bent, P. J. Withers and P. D. Lee, J. X-Ray Sci. Technol., 2016, 24, 207–219 CrossRef PubMed.
- G. van Dalen and M. W. Koster, Presented in part at the Broker micro-user meeting, Brussels, Belgium, April 3–5, 2012, http://bruker-microct.com/company/UM2012/31.pdf Search PubMed.
- A. Dutta, A. Chengara, A. D. Nikolov, D. T. Wasan, K. Chen and B. Campbell, J. Food Eng., 2004, 62, 177–184 CrossRef.
- A. J. DeVries, Morphology, coalescence and size distribution of foam bubbles, Academic Press, New York, 1972 Search PubMed.
- E. E. Dickinson, An introduction to food colloids, Oxford University Press, Oxford, UK, 1992 Search PubMed.
- S. Turan, M. Kirkland and R. Bee, in Food emulsions and foams: Interfaces, interactions and stability, ed. E. Dickinson and J. M. Rodrigues, Patinno, UK, 1999, pp. 151–162 Search PubMed.
- R. W. Hartel, Properties of Water in Foods, 1998 Search PubMed.
- T. Hagiwara, R. W. Hartel and S. Matsukawa, Food Biophys., 2006, 1, 74–82 CrossRef.
- K. L. K. Cook and R. W. Hartel, Compr. Rev. Food Sci. Food Saf., 2010, 9, 213–222 CrossRef.
- E. K. Harper and C. F. Shoemaker, J. Food Sci., 1983, 48, 1801–1803 CrossRef.
- D. P. Donhowe and R. W. Hartel, Int. Dairy J., 1996, 6, 1209–1221 CrossRef.
- D. P. Donhowe and R. W. Hartel, Int. Dairy J., 1996, 6, 1191–1208 CrossRef.
Footnote |
| † Electronic supplementary information (ESI) available. See DOI: 10.1039/c7ra00642j |
| This journal is © The Royal Society of Chemistry 2017 |


![[thin space (1/6-em)]](https://www.rsc.org/images/entities/char_2009.gif)

