
 Open Access Article
 This Open Access Article is licensed under a
 Creative Commons Attribution 3.0 Unported Licence
Impact of cobalt content in Na0.67MnxFeyCozO2 (x + y + z = 1), a cathode material for sodium ion batteries†
C. Marino *,
E. Marelli and
C. Villevieille*
*,
E. Marelli and
C. Villevieille*
Paul Scherrer Institut, Electrochemistry Laboratory, Villigen PSI, Switzerland. E-mail: Cyril.marino@psi.ch; Claire.villevieille@psi.ch
First published on 1st March 2017
Abstract
Due to the toxicity and price of cobalt (Co), Na0.67MnxFeyCozO2 (NaMFC) was tested as a cathode material for Na-ion batteries with lower cobalt contents. The objective was to set the Co to a maximum of 0.15 and compensate its loss by changing the ratio of Mn or Fe. The synthesized compounds were compared to two reference materials Na0.67Mn0.5Fe0.25Co0.25O2 and Na0.67Mn0.5Fe0.5O2. Microscopy (SEM), X-ray diffraction (XRD), X-ray absorption spectroscopy (XAS) and electrochemical tests were performed to characterize the pristine samples and to understand the impact of the cobalt on the electrochemical mechanism. A link was established between the amount of Co in the NaMFC material and the oxidation state of the Mn in the discharged sample. We confirmed that the role of the cobalt is to prevent a high Mn(III) ratio in the compound and thus help to limit the fading of the electrochemical performance. The compound Na0.67Mn0.5Fe0.35Co0.15O2 offers a good compromise between electrochemical stability and lower Co content.
1. Introduction
In November 2015, the French network RS2E presented the first Na-ion battery prototype able to sustain a reversible energy density of 90 W h kg−1 for 2000 cycles.1 Thanks to the knowledge acquired on the Li-ion battery, this reported performance was even higher than the one reported for the first commercialized Li-ion battery (80 W h kg−1 for 1000 cycles)2 in 1991. This prototype increased the interest in such energy storage systems, mainly in the scientific community.3,4 Keller et al.5,6 demonstrated impressive full-cell results by combining a layered oxide material (cathode) and hard carbons (anode), with a reversible energy density of 250 W h kg−1 for 50 cycles. Due to the bigger ionic size of Na and its higher molecular weight compared to Li, the theoretical energy density of Na batteries is three times lower than that of Li batteries (considering a metallic Li/Na counter electrode). However, this difference is drastically decreased once we no longer considered the Li/Na metal but the Li-ion/Na-ion batteries indicating the crucial need for developing novel materials with high specific charge and cathodes with high voltage.Layered oxides materials NaxMO2, used as cathode material or anode material, are attractive due to their weak interlayer interaction and empty spaces allowing fast ion diffusion.7–9 There are generally classified in four structure groups P2, O2, O3 and P3 depending of the layer arrangement.10 Recently, Ceder's group investigated the P2–Na0.67Mn0.5Fe0.25Co0.25O2 (NaMFC-1)11 and demonstrated that this material can sustain high rate currents (ca. until 30C rate) and still delivers 120 mA h g−1 compared to Na0.67Mn0.5Fe0.5O2 (NaMFC-4) that delivers 100 mA h g−1 at 2C.12 This remarkable performance was attributed to the presence of Co in NaMFC-1 that would prevent the full reduction of Mn(IV) in Mn(III), causing Jahn–Teller distortion. However, concerns are raised when comes to Co due to its toxicity and its general high cost. Therefore, in this work, we propose to reduce the amount of Co in NaMFC-1 material and to compare the electrochemical performance of the synthesized materials to both references NaMFC-1 and NaMFC-4. The synthesized compounds will be characterized by means of X-ray diffraction (XRD), scanning electron microscopy (SEM), X-ray absorption (XAS) and finally electrochemical measurements. The reaction mechanism will be investigated through ex situ XAS and ex situ XRD analyses.
2. Experimental section
2.1 Synthesis
NaMFC compounds were prepared from manganese acetate tetrahydrate (99%, Sigma-Aldrich), cobalt acetate tetrahydrate (98%, Sigma-Aldrich), iron acetylacetonate (97%, Sigma-Aldrich) and sodium acetate (99%, Sigma-Aldrich). Stoichiometric amounts were dissolved in an ethanol/water mixture and stirred for 4 h at 90 °C. After evaporation of the solvents, the powders were grinded in a mortar and placed into a muffle oven at 400 °C for 3 h. The samples were then grinded a second time in a mortar and place back in the oven for calcination at 900 °C for 12 h. The samples were cooled down in 10 h to 300 °C, picked out from the oven and directly stored in an Ar filled glovebox in order to limit the contact with humidity.13 The materials are called: NaMFC-1 for Na0.67Mn0.5Fe0.25Co0.25O2, NaMFC-2 for Na0.67Mn0.6Fe0.25Co0.15O2, NaMFC-3 for Na0.67Mn0.5Fe0.35Co0.15O2 and NaMFC-4 for Na0.67Mn0.5Fe0.5O2.2.2 Electrochemistry
Electrodes were prepared by placing a mixture of 80%wt active material, 10%wt carbon black (CB, SuperC65, Imerys) and 10%wt polyvinylidene fluoride (PVDF, HSV-900, Arkema) in N-methyl-2-pyrrolidone (NMP, Alfa aesar) in ball milling filled under Ar. The slurries were casted onto aluminum foil used as current collector and dried under vacuum at 80 °C. 13 mm electrodes were punched and dried under dynamic vacuum at 120 °C overnight. Active material loadings are between 5.5 mg cm−2 to 6.5 mg cm−2. Electrochemical cells were assembled in an Ar-filled glove box using a glass fibers separator and metallic sodium as counter electrode. A mixture of 1 M NaClO4 dissolved in propylene carbonate (PC) was used as electrolyte. The cell performances were measured in galvanostatic mode at 25 °C between 2.1 V and 4.5 V (versus Na+/Na) at a 0.1C rate or a rate capability procedure with 3 cycles at 0.1C, 0.2C, 0.4C, 0.8C and 1.6C followed by a constant 0.2C rate. Measurements were monitored by an ASTROL cycling device.2.3 X-ray diffraction (XRD)
XRD measurements were performed in capillary mode at room temperature with a PANalytical Empyrean diffractometer using copper Kα-radiation. The ex situ samples were cycled galvanostatically until the desired potential and let 5 h in potentiostatic step. The synchrotron data were acquired in capillary mode (0.3 mm diameter) at a wavelength of λ = 0.563315 nm at the MS-powder beamline (X04SA) of the Swiss Light Source (SLS, Villigen, Switzerland). The LeBail refinements were performed with the TOPAS software14 using the phase reported by Liu et al.11 as reference NaMFC compound.2.4 Scanning electron microscopy (SEM)
SEM measurements were performed in a Carl Zeiss Ultra55 scanning electron microscope using the secondary electron mode (SE2) and an acceleration voltage of 3 kV. The presented pictures were done at a magnification of 5000 times and a working distance of 7.9 mm. Samples were previously coated with a gold layer of 3 nm using a Leica EM ACE 200.2.5 X-ray absorption spectroscopy (XAS)
XAS measurements were performed in capillaries (d = 1 mm) in transmission mode at the SuperXAS beamline in the Swiss Light Source synchrotron (SLS) at the Mn K-edge (6539 eV), Fe K-edge (7112 eV) and Co K-edge (7709 eV). Ex situ samples were previously cycled at 0.1C and the electrodes were washed after cycling with dimethylcarbonate (DMC). The remaining powders were mixed with carbon (SuperC65) to fill the capillaries. The quick EXAFS monochromator15 was used allowing getting a spectrum every 50 ms; the showed spectrum is the sum of the 2400 acquired spectra. Data treatment was performed with Athena software.163. Results and discussion
3.1 Characterization of the pristine
SEM pictures of the NaMFC compounds reveal platelet shape particles with a particle size distribution from 0.7 μm to 3 μm and a platelet thickness of ca. 300 nm (Fig. 1). Some platelet agglomerates can be distinguished and are characterized by the stacking of few of them, as it can be seen in Fig. 1a. Additional round shape particles of ca. 100 nm can be seen at the surface of the platelets and might indicate the presence of impurities in the sample NaMFC-4 (Fig. 1d).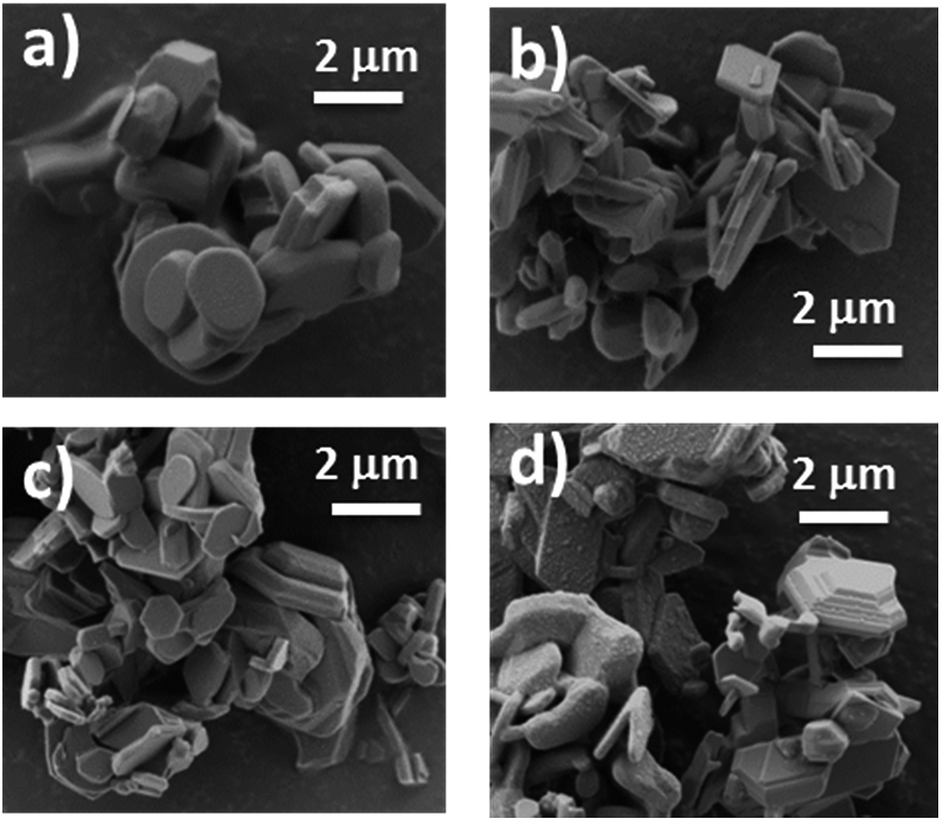 | ||
| Fig. 1 SEM images of (a) NaMFC-1, (b) NaMFC-2, (c) NaMFC-3 and (d) NaMFC-4. | ||
The XRD patterns of the NaMFC compounds (Fig. 2) reveal narrow and intense Bragg peaks indicating a good crystallinity coming from the synthesis at high temperature. All the materials show similar XRD patterns which suggest a similar structure symmetry. The pattern of NaMFC-4 material could be indexed into a P2–Na0.66Mn0.49Fe0.49O2 phase (space group P63/mmc – ICSD 194733)17 and the one of NaMFC-1 into a P2–Na0.67Mn0.5Fe0.25Co0.25O2 phase similar to the one described in the literature.11 Additionally, the refined lattice parameters are in agreement with those reported by Montemard de Boisse et al.18 and Liu et al.11 (see Table 1). A shift of the peaks at 36.1°, 39.6°, 43.8°, 49.0°, 62.2°, 65.0° and 67.5° is noticed for the NaMFC-2, NaMFC-3 and NaMFC-4 samples compare to the reference sample NaMFC-1. This modification is further confirmed by the cell parameters obtained from the refinements (Table 1), where the “a” lattice parameter and the cell volume increase (refined patterns of NaMFC-2 and NaMFC-3 available in Fig. S1, ESI†). It indicates that the substitution of Co by Mn/Fe in NaMFC-1 leads to an increase of the lattice cell parameters. As Co(III) radius (0.545 Å) is smaller than Fe(III) radius (0.645 Å) and Mn(III) radius (0.65 Å),19 the increase of the cell parameters evidences the substitution of Co in samples NaMFC-2 and NaMFC-3. The lower shift in the pattern of NaMFC-2 compared to the one of NaMFC-3 could be explained by the substitution of Co(III) by a mixture of Mn(III) and Mn(IV) (ionic radius – 0.54 Å). This aspect will be discussed later. Additionally, we identified a minor impurity (estimated to 5–10%wt) assigned to an O3 phase (space group R![[3 with combining macron]](https://www.rsc.org/images/entities/char_0033_0304.gif) m, indicated in the Fig. 2 by an asterisk).18 This impurity was also reported in the literature,5 however, so far its formal identification is still lacking. We refined the cell parameters of this O3 phase which are also increasing similarly to the one of the P2-phase depending of the compound (Table A, ESI†).
m, indicated in the Fig. 2 by an asterisk).18 This impurity was also reported in the literature,5 however, so far its formal identification is still lacking. We refined the cell parameters of this O3 phase which are also increasing similarly to the one of the P2-phase depending of the compound (Table A, ESI†).
 | ||
| Fig. 2 XRD patterns of the pristine NaMFC materials. Asterisks symbolize the impurity (O3 phase). | ||
| Material | a = b (Å) | c (Å) | V (Å3) |
|---|---|---|---|
| NaMFC-1 | 2.87423(9) | 11.2169(7) | 80.253(7) |
| NaMFC-2 | 2.87979(5) | 11.2345(3) | 80.600(4) |
| NaMFC-3 | 2.89554(2) | 11.2093(2) | 81.389(2) |
| NaMFC-4 | 2.92929(7) | 11.1972(5) | 83.208(5) |
The oxidation states of the transition metals in the NaMFC compounds were investigated by XAS at the Mn K-edge, Fe K-edge and Co K-edge. The XANES spectra were compared to their respective reference samples for of +2, +3 or +4 oxidation state (Fig. 3).
 | ||
| Fig. 3 XANES spectra of the pristine NaMFC compounds at the (a) Co K-edge, (b) Mn K-edge and (c) Fe K-edge. | ||
• For the Co K-edge (Fig. 3a), the half-height edge position in the NaMFC materials spectra fits well the one of the LiCoO2 reference sample indicating that Co is in +3 oxidation state. A small shift to higher energy values of the maximum absorption position (MAP) is observed for the three samples, but less pronounced for NaMFC-3. This indicates the possible existence of Co(IV) in the samples.
• For the Mn K-edge (Fig. 3b), all the half-height edge positions in the XANES spectra are slightly shifted to lower energy compared to the one of the MnO2, reference (Mn(IV)). Consequently, the NaMFC compounds contain mainly Mn(IV) with a small proportion of Mn(III). Different positions of the MAP and the edges are detected for all the samples indicating that the ratio Mn(IV)/Mn(III) is different for most of the NaMFC materials. Since the highest shifts of the MAP and the edge are observed for the NaMFC-1 sample, it indicates that it has more Mn(IV) whereas the ratio Mn(IV)/Mn(III) in NaMFC-2, NaMFC-3 and NaMFC-4 seem to be similar.
•For the Fe K-edge (Fig. 3c), the half-height edge positions match with the one of the Fe(III) reference sample and no shift of the MAP can be found. All NaMFC compounds are composed of Fe(III).
3.2 Electrochemical behaviour of the compounds
The galvanostatic curves for the 1st cycle of the NaMFC compounds are displayed in Fig. 4. Desodiation and sodiation curves of the samples NaMFC-1 and NaMFC-4 are similar to the ones reported in the literature with two main reversible regions I and II.11,12 The curves for the samples NaMFC-2 and NaMFC-3 present also a similar behavior. | ||
| Fig. 4 Galvanostatic curves of the 1st charge (a) and 1st discharge (b) for the NaMFC materials. | ||
•On charge (Fig. 4a), the region I between 2.6 V and 3.9 V (counting for half of the total specific charge), has no defined potential plateau but resembles more a slopping curve indicating generally a solid-solution behavior. A shoulder is seen at potential lower than 3 V for NaMFC-3, NaMFC-2 and NaMFC-4 compounds, which is more pronounced for the two lasts (note here that this shoulder is not detected during the 2nd cycle, see ESI Fig. S2†). It can be linked to the oxidation of Mn(III) in the pristine samples (see Fig. 3b). At 4.0 V (region II), we can see the appearance of a potential plateau assigned by Yabuuchi et al.20 to the oxidation of Fe3+ for NaMFC-4. This potential plateau is shifted to 4.2 V for NaMFC-1, and counts for the other half of the total specific charge (ca. 60 mA h g−1). Liu et al.11 suggested that the electrochemical processes occurring at this potential are responsible of the fading of the NaMFC material. The difference in polarization between NaMFC-4 (4.0 V) and NaMFC-1 (ca. 4.2 V) is slightly lower for NaMFC-3 (4.15 V) whereas NaMFC-2 is comparable to NaMFC-1. This polarization could be related to (i) either the difference of oxidation state of Mn and Co since, in the pristine sample, different ratios Mn(IV)/Mn(III) and Co(III)/Co(IV) (or Co(II)) were found (Fig. 3), (ii) or the Fe content in the sample. Moreover, the potential plateau, shown by the dashed lines (Fig. 4a), is shorter in the case of NaMFC-1 and NaMFC-2, material with a low Fe content. Therefore, it confirms that the plateau originates from the oxidation of Fe(III) in Fe(IV).
•On discharge (Fig. 4b), the potential plateau (region II) is directly linked to the composition of the NaMFC materials. NaMFC-1 has the highest potential plateau centered at ca. 3.85 V whereas NaMFC-4 shows the lowest one at ca. 3.5 V, revealing a higher polarization for NaMFC-4. For NaMFC-2 and NaMFC-3, the potential plateau is located at ca. 3.8 V and ca. 3.7 V respectively. Therefore, the substitution of a part of the Co leads to decrease the working potential of 100–150 mV of the NaMFC materials compared to the reference sample NaMFC-1. After the potential plateau (containing again for half of the obtained specific charge), the potential slowly drops in a slopping manner to reach 2.1 V (region I). The electrochemical performances of the NaMFC compounds are presented in Fig. 5. Along the first cycle, NaMFC-4 shows the highest specific charge at 0.1C with 159 mA h g−1 whereas NaMFC-1, NaMFC-2 and NaMFC-3 reach 144 mA h g−1, 142 mA h g−1 and 150 mA h g−1, respectively. Regarding the rate capability tests, the increase of the current (Fig. 5a) leads to the decrease of the specific charges to reach 130 mA h g−1 for NaMFC-3 and 125 mA h g−1 for NaMFC-1 and NaMFC-2 with coulombic efficiency values higher than 98% at 0.8C rate. However, NaMFC-4 does not sustain higher cycling rates since the specific charge at 0.8C is already lower than 125 mA h g−1. Additionally, this material possesses the lowest coulombic efficiency. The difference in specific charge for NaMFC-4 is even more pronounced at 1.6C rate with a value close to 100 mA h g−1 compared to 125 mA h g−1 for all other materials. It confirms the hypothesis made by Liu et al.11 that the presence of Co allows the material to sustain high charge/discharge rates. Similar behaviour is obtained for NaMFC-2 and NaMFC-3 materials. When the rate goes back to 0.2C, the specific charges of the NaMFC compounds reach similar values than the one obtained at 0.8C. After 10 cycles at 0.2C, NaMFC-1, NaMFC-2 and NaMFC-3 deliver 125 mA h g−1 whereas 110 mA h g−1 is obtained for NaMFC-4.
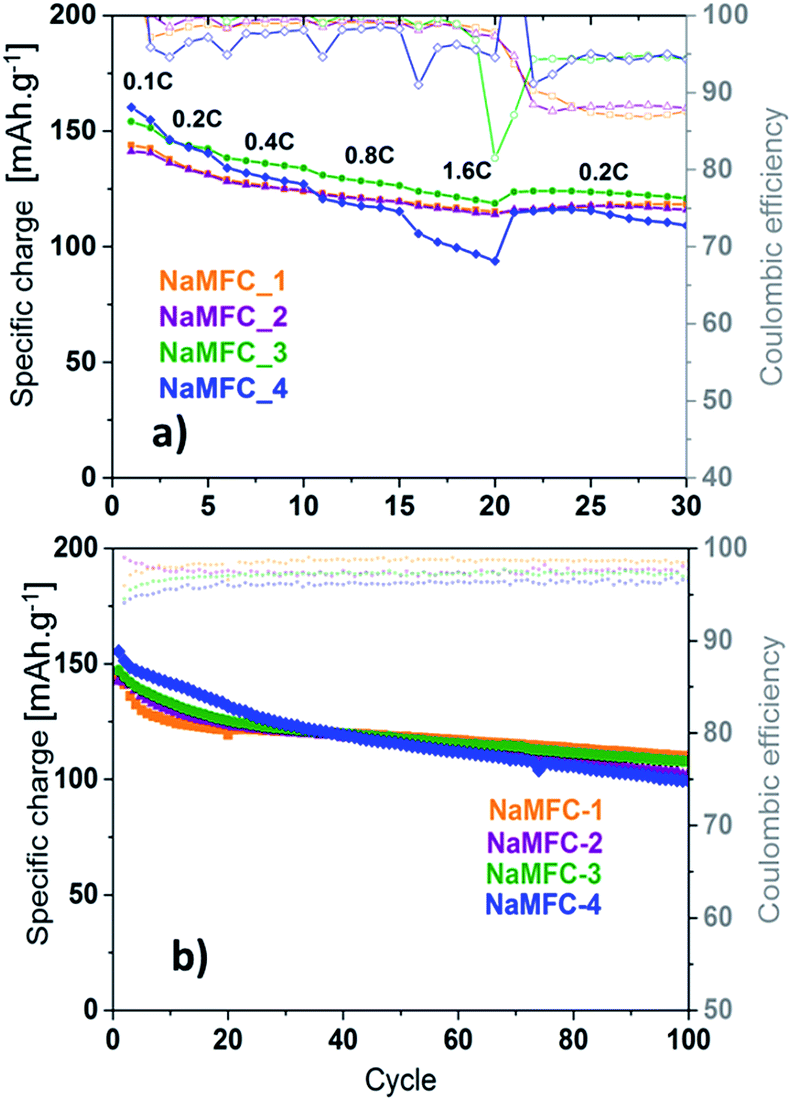 | ||
| Fig. 5 Electrochemical performance of the NaMFC compounds in 1 M NaClO4 in PC electrolyte (a) at different C-rates and (b) at a constant 0.1C rate. | ||
Once the measurements are performed at a constant 0.1C rate (Fig. 5b), the evolution of the specific charge can be divided in two parts: one before 30 cycles, and the other one after 100 cycles. For the former, NaMFC-4 presents the highest specific charge and NaMFC-1 and NaMFC-2 the lowest one. The fading at the beginning is more pronounced for NaMFC-1 since a specific charge of 125 mA h g−1 is reached after only 10 cycles, whereas this value is obtained around the 30th cycle for NaMFC-2, NaMFC-3 and NaMFC-4 materials. The evolution of the coulombic efficiency confirms the faster fading of NaMFC-1 since it reaches a stable value of 98.5% after 10 cycles whereas an equilibrium value is obtained after 20 cycles for the other compounds. After 100 cycles, the specific charge of NaMFC-1 decreases to 110 mA h g−1 compared to 106 mA h g−1 for NaMFC-3 and 102 mA h g−1 for NaMFC-2. The presence of Co in the material clearly stabilizes the electrochemical performance of the compounds, even if, along the first twenty cycles, the specific charge is limited compared to NaMFC-4. It is difficult to properly assess the electrochemical influence of the O3 phase impurity, a phase known to be less stable than the P2 one.5 However, NaMFC-3 and NaMFC-4 materials demonstrate a different electrochemical behaviour in the cycling stability which could be attributed to the activity of the O3 phase.
Those results indicate that it is possible to substitute a part of Co by Fe or Mn and that it does not affect significantly the electrochemical performance. Thus, NaMFC-3 material seems to be the best compromise between the amount of Co and the electrochemical performance.
3.3 Comparison of the electrochemical mechanism
In order to get insight about the desodiation reaction mechanism of the NaMFC compounds, ex situ XRD samples were analyzed at the end of the 1st charge (Fig. 6). The patterns show similar phase at the end of charge for all NaMFC compounds. The broad peaks at 17.5°, 37° and 40° can be attributed to the “Z” phase already reported in the literature for NaMFC-1 (ref. 11) and NaMFC-4.11,20 The “Z” phase is ascribed to a structure close to P2 with a loss in long-range order characterized by the broadening of the peak (002) around 17° and a contraction of the interlayer distance since the peak at 16° shifts to 17.5°. According to the work of Talaie et al.12 on NaMFC-4, the absence of a strong modification of the Bragg peak at 36° reveals a good stability of the MO2 layers during the transition between the P2 phase and the “Z” phase. A shift to lower angles of the 36° peak from the samples NaMFC-2, -3, and -4 is seen compared to the reference pattern of NaMFC-1, however, this trend is similar to the one previously described for the pristine samples. As state in the pristine part, the substitution of Co by other transition metal (Fe/Mn) leads to modifications in the MO2 layers, and thus, those modifications have also an impact in the “Z” phase obtained at the end of desodiation. The Bragg reflection at 40° is not detected in the pattern of NaMFC-4 (ref. 21) and NaMFC-3 unlike in the patterns of NaMFC-1 (ref. 11) and NaMFC-2 containing a lower amount of Fe. The disappearance of this peak is probably linked to the depth of desodiation through the redox couple Fe(III)/Fe(IV) in NaMFC-4.21 Interestingly, the peak at 17.5° is similar for NaMFC-1, NaMFC-2 and NaMFC-4 but a slight shift to lower angle values is noted for NaMFC-3. We believe that a relaxation could be the origin of the slight shift.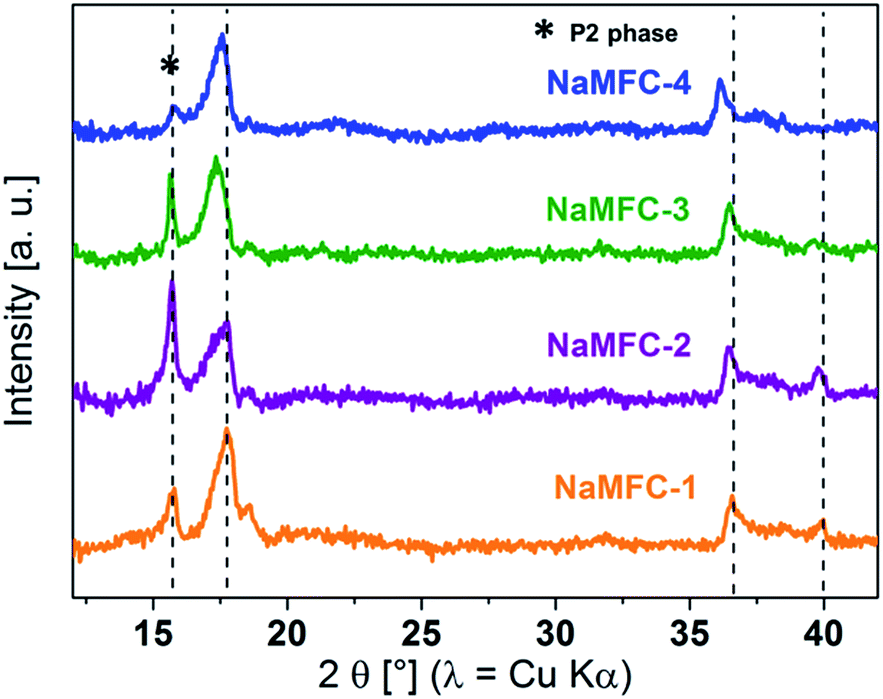 | ||
| Fig. 6 Ex situ XRD patterns of the NaMFC compounds recorded at the end of the 1st charge. | ||
The ex situ XANES analyses of the NaMFC compounds taken at the end of the 1st discharge and the end of the 2nd charge are displayed in Fig. 7 for the Co K-edge, Mn K-edge and Fe K-edge.
 | ||
| Fig. 7 XANES spectra for the end of 1st discharge at the (a) Co K-edge, (b) Mn K-edge and (c) Fe K-edge; XANES spectra for the end of at the 2nd charge (d) Co K-edge, (e) Mn K-edge and (f) Fe K-edge. | ||
• For the Co-K edge: no difference is detected between the spectra at the end of discharge (Fig. 7a) and at the end of charge (Fig. 7d) for all the samples, indicating a similar Co redox activity. At the end of the discharge, the half-height edge position in the NaMFC materials matches with the reference one of Co(III). At the end of charge, the spectra are shifted to higher energy values indicating that Co is now in +4 oxidation state. When the NaMFC materials are cycled from 2.1 V to 4.5 V, the electrochemical mechanism involves the redox couple Co(IV)/Co(III).
• For the Mn K-edge: the spectrum of discharged NaMFC-4 (Fig. 7b) has a half-height edge position close to the Mn(III) reference sample. We can also notice a shift to higher energies, also observed for the MAP, for the materials containing Co and the extend of this shift seems to be related to the amount of Co in the materials. Consequently, the amount of residual Mn(IV) increases in the discharged materials containing Co. In the charged materials (Fig. 7e), the spectra of the NaMFC compounds reveal the full oxidation of Mn(III) into Mn(IV).
• For the Fe-K edge: the half-height edge position in the NaMFC materials for the discharge state (Fig. 7c) perfectly match the one of the reference spectrum Fe(III). At the end of the 2nd charge (Fig. 7f), the MAP of the spectra moves from ca. 7132 eV to 7136 eV and could indicate the oxidation of Fe(III) in Fe(IV) as reported in the literature.20 A slight shift between the NaMFC-4 sample and the other materials can be observed, however this phenomenon is attributed to the higher amount of unreacted particles in the Co-containing materials as already seen by XRD (Fig. 6).
To summarize, all the transition metals were found to be electrochemically active since their respective edges shifts in the XANES spectra between end of charge and end of discharge measurements. At 4.5 V, the oxidation states of the Mn, Fe and Co are +IV whereas it is reduced to mainly +III at 2.1 V. Remaining Mn(IV) was found in the materials containing Co at the end of discharge. This point will be discussed later.
4. Discussion
The difference in polarization observed in the galvanostatic curves and the shift of the Bragg peaks in the XRD patterns are certifying that the synthesis of NaMFC compounds with lower Co content (NaMFC-2 and NaMFC-3) is successful. This substitution leads to some changes in the other transition metals oxidation state mainly on the Mn according to the results obtained by ex situ XANES measurements. Considering that Fe and Co are at +3 oxidation state, NaMFC-1 would result in Na0.67Co(III)0.25Fe(III)0.25Mn(IV)0.33Mn(III)0.17O2 and NaMFC-2 in Na0.67Co(III)0.15Fe(III)0.25Mn(IV)0.33Mn(III)0.27O2.Due to the similarities observed in the Mn K-edge and Fe K-edge XANES spectra between NaMFC-2 and NaMFC-3 materials, a similar oxidation degree of Mn and Fe is expected. Additionally, the presence of residual Co(II) in NaMFC-3 sample, characterized by a slight shift to lower energy at Co K-edge, could be envisaged as first. However, with the stoichiometry mentioned above, it is impossible to obtain the electroneutrality in the material. Consequently, a minor part of Co(IV) must be present in NaMFC-3 and a higher Co(IV) will be found in NaMFC-2.
At the end of the 1st charge, the XRD patterns showed that the desodiation mechanism of NaMFC-2 and NaMFC-3 is similar to the one reported in the literature for NaMFC-1 and NaMFC-4.11 The ex situ XAS study performed at the end of the 2nd charge indicates that at 4.5 V, the compounds are oxidized to Co(IV), Mn(IV) and Fe(IV).
Unlike the desodiation, the ex situ XAS investigation at the end of the 1st discharge reveals a difference in the Mn K-edge spectra. When the potential window is limited to 2.1 V, Co(IV) and Fe(IV) are reduced to the oxidation state +3 whereas the reduction of Mn(IV) in Mn(III) does not fully happen, especially in the samples containing Co. On one hand, it explains the difference in specific charge observed along the first cycle of the NaMFC compounds. On the other hand, the Ceder's group11 suggested that the substitution of Fe by Co in NaMFC-4 prevents the Jahn–Teller distortion in the structure. However, the difference in cycling stability between Na-MFC-1 material and NaMFC-3 material is not obvious after 100 cycles neither on the first twentieth cycles where the lower Co-content material delivers a better specific charge.
Meanwhile, the ex situ XRD analyses show that the Fe content seems to play a role in the structure, especially at the end of charge. As the Bragg reflection at 40° is still visible in the pattern of the compounds with lower Fe content, it could imply a limitation in the distortion of the P2 structure, leading to the Z phase, brought by a larger removal of Na.21 Finally, the average discharge potential is calculated at 3.49 V for NaMFC-1 compared to 3.36 V for NaMFC-3 along the 2nd cycle. The specific charge being 142 mA h g−1 for NaMFC-1 and 151 mA h g−1 for NaMFC-3, it leads to an energy density of 496 W h kg−1 and 507 W h kg−1 respectively for NaMFC-1 and NaMFC-3. After 100 cycles, those energy densities decrease to 325 W h kg−1 for NaMFC-1 and 298 W h kg−1 for NaMFC-3. We believe that NaMFC-3 appears as a good compromise between the amount of Co in the NaMFC compound and the electrochemical stability.
5. Conclusions
The materials NaMFC were successfully synthesized and characterized by means of XRD, XAS and electrochemistry. The XRD pristine analysis reveals an increase of the cell lattice parameters when a part of the Co is substituted by Fe or Mn. The pristine samples are composed of Co(III), Fe(III) and Mn(IV) but a few amounts of Co(IV) and Mn(III) were detected. The lower Co content in the NaMFC materials leads to a slight decrease of the average working discharge potential, however a slight increase of the specific charge is also denoted. The desodiation reaction mechanism was demonstrated to be similar to the one reported for the reference sample, 0.25%at of Co. The compound NaMFC-1, with 0.25%at of Co, presents the best electrochemical stability even if the samples with 0.15%at of Co are roughly similar. The XAS analysis performed along cycling confirms that a high amount of Co prevents the full reduction of Mn(IV) in Mn(III), responsible of the Jahn Teller distortion and, by the matter of fact, the reduce the fading of the specific charge. Finally, the compound NaMFC-3, with only 0.15%at of Co is a good compromise between a lower Co content and a good/stable electrochemical performance.Acknowledgements
This work was performed within the SCCER network (Swiss Competence Center for Heat and Electricity Storage) which is also acknowledged for funding. The authors thank Dr O. Safonova and Dr M. Nachtegaal for the beamtime allocated on SuperXAS beamline at the Swiss Lightsource (SLS) (proposal number 20151549). The authors are thankful to Dr N. Casati for the beamtime allocated on MS-POWDER beamline at SLS (Mesquick proposal number 20170006). Dr F. Juranyi and Dr M. Medarde are also acknowledged for the fruitful discussion.Notes and references
- J.-M. Tarascon, C. Masquelier, L. Croguennec and S. Patoux, A Battery Revolution In Motion, CNRS News, 27 Nov 2015, https://news.cnrs.fr/articles/a-battery-revolution-in-motion Search PubMed.
- T. Nagaura and K. Tozawa, Prog. Batteries Battery Mater., 1990, 9, 20 Search PubMed.
- C. Fang, Y. Huang, W. Zhang, J. Han, Z. Deng, Y. Cao and H. Yang, Adv. Energy Mater., 2016, 6, 1501727 CrossRef.
- N. Yabuuchi, K. Kubota, M. Dahbi and S. Komaba, Chem. Rev., 2014, 114, 11636–11682 CrossRef CAS PubMed.
- M. Keller, D. Buchholz and S. Passerini, Adv. Energy Mater., 2016, 6, 1501555 CrossRef PubMed.
- M. Keller, C. Vaalma, D. Buchholz and S. Passerini, ChemElectroChem, 2016, 3, 1124 CrossRef CAS.
- S. Komaba, N. Yabuuchi, T. Nakayama, A. Ogata, T. Ishikawa and I. Nakai, Inorg. Chem., 2012, 51, 6211–6220 CrossRef CAS PubMed.
- Z. Ma, Y. Wang, C. Sun, J. A. Alonso, M. T. Fernández-DÍaz and L. Chen, Sci. Rep., 2014, 4, 7231 CrossRef CAS PubMed.
- H. Hou, B. Gan, Y. Gong, N. Chen and C. Sun, Inorg. Chem., 2016, 55, 9033–9037 CrossRef CAS PubMed.
- C. Delmas, C. Fouassier and P. Hagenmuller, Physica B+C, 1980, 99, 81–85 CrossRef CAS.
- L. Liu, X. Li, S.-H. Bo, Y. Wang, H. Chen, N. Twu, D. Wu and G. Ceder, Adv. Energy Mater., 2015, 5, 1500944 CrossRef.
- E. Talaie, V. Duffort, H. L. Smith, B. Fultz and L. F. Nazar, Energy Environ. Sci., 2015, 8, 2512–2523 CAS.
- M. Sathiya, K. Hemalatha, K. Ramesha, J. M. Tarascon and A. S. Prakash, Chem. Mater., 2012, 24, 1846–1853 CrossRef CAS.
- A. A. Coelho, J. Appl. Crystallogr., 2003, 36, 86–95 CAS.
- O. Muller, M. Nachtegaal, J. Just, D. Lutzenkirchen-Hecht and R. Frahm, J. Synchrotron Radiat., 2016, 23, 260–266 CrossRef PubMed.
- B. Ravel and M. Newville, J. Synchrotron Radiat., 2005, 12, 537–541 CrossRef CAS PubMed.
- V. Duffort, E. Talaie, R. Black and L. F. Nazar, Chem. Mater., 2015, 27, 2515–2524 CrossRef CAS.
- B. Montemard de Boisse, D. Carlier, M. Guignard and C. Delmas, J. Electrochem. Soc., 2013, 160, A569–A574 CrossRef.
- M. Yoncheva, R. Stoyanova, E. Zhecheva, E. Kuzmanova, M. Sendova-Vassileva, D. Nihtianova, D. Carlier, M. Guignard and C. Delmas, J. Mater. Chem., 2012, 22, 23418 RSC.
- N. Yabuuchi, M. Kajiyama, J. Iwatate, H. Nishikawa, S. Hitomi, R. Okuyama, R. Usui, Y. Yamada and S. Komaba, Nat. Mater., 2012, 11, 512–517 CrossRef CAS PubMed.
- B. Mortemard de Boisse, D. Carlier, M. Guignard, L. Bourgeois and C. Delmas, Inorg. Chem., 2014, 53, 11197–11205 CrossRef CAS PubMed.
Footnote |
| † Electronic supplementary information (ESI) available. See DOI: 10.1039/c7ra00566k |
| This journal is © The Royal Society of Chemistry 2017 |