 Open Access Article
A study on the identification of habitats and determination of sulfur dioxide residue of Radix Astragali by UV-vis-SWNIR diffuse reflectance spectroscopy
Xiaoli Jinga,
Jie Tangb,
Yang Liua,
Xiaomei Lub and
Bing Liang *b
*b
aCollege of Medical Technology, Chengdu University of Traditional Chinese Medicine, Chengdu 611137, China
bSchool of Chemical Engineering, Sichuan University, Chengdu 610065, P. R. China. E-mail: lbyy0019@sina.com
First published on 20th March 2017
Abstract
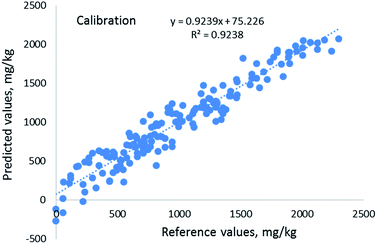
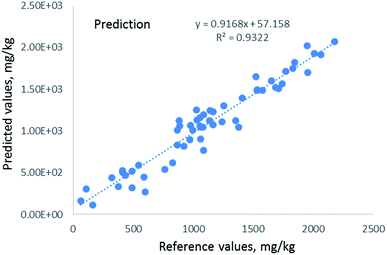
The feasibility of identifying habitat of sulfur fumigated Radix Astragali and of determining its sulfur dioxide residue using UV-vis and short wave near-infrared diffuse reflectance spectra coupled with chemometrics was first investigated. The results show that by using UV-vis-SWNIR DRS combined with PCA, the habitat of Radix Astragali is identified definitely, whether it is sulfur-fumigated, or not sulfur-fumigated; after waveband selection, SG smoothing and excluding outliers, PLS modelling results were improved with a R2 of 0.9238, 0.9104 and 0.9322 for calibration set, cross validation set and prediction set, respectively. A convenient and rapid method for identification of the habitat of sulfur fumigated Chinese herbal medicines and determination of sulfur dioxide residue by UV-vis-SWIR DRS was proposed.
1 Introduction
Identification of herbal medicines is an important part of their quality control. Traditional identification of herbal medicines is based on the difference in source, character identification, physicochemical identification and microscopic identification.1 But these methods depend on experience to some extent and may not fully reflect the medicinal quality.2 Afterwards, thin-layer chromatography,3–5 HPLC6,7 and fingerprint technology,8–11 based on the extraction of related indexes, were developed and widely used for the identification and quality evaluation of herbal medicines. However, they are complicated, laborious, time-consuming and solvent-consuming due to requiring chemical sample-pretreatments such as extraction, separation, and concentration.2 Therefore, in recent years, rapid and nondestructive methods without chemical pretreatment have gained fast development and wide acceptance. Infrared spectroscopy,12–14 Fourier transform infrared (FTIR) spectra,15 near infrared reflectance spectroscopy (NIR),14,16–19 FT-Raman spectroscopy14 and THz-TDS2,20,21 methods have been reported for this objective. However, they have some disadvantages such as using sophisticated and expensive instruments. Additionally, they do not include UV-vis spectral region which contains a wealth of information regarding electron-energy level transition of molecules. THz-TDS also has other shortcomings: a lot of Chinese medicines have no obvious characteristic absorption peak in the THz frequency region,20,22 the strong interference from water absorption makes it need to set the instrumental system in an airtight enclosure with nitrogen gas infusion to keep the relative humidity as less than 8% even 1%, to overcome the effects of water absorption.2,20,23On the other hand, sulfur fumigation was a traditional processing way used widely for some kinds of Chinese medicinal materials (CMM), which can make CMM mothproof and mildewproof, have beautiful appearance and bright color,24,25 and is helpful for storage. However, sulfur fumigation may have a great impact on the chemical compositions and pharmacological effects of CMM,24–30 make more residue of SO2![[thin space (1/6-em)]](https://www.rsc.org/images/entities/char_2009.gif) 30,31 and more residues of toxic and harmful substances such as lead, arsenic, mercury and chromium.24,32,33
30,31 and more residues of toxic and harmful substances such as lead, arsenic, mercury and chromium.24,32,33
Therefore, control of SO2 residue in CMM is necessary and it has been becoming more and more strictly. China has stipulated that residue amount of sulfur dioxide in herbal medicines should not exceed 150 mg kg−1, sulfur dioxide residue amount in 10 kinds of herbs and slices such as Rhizoma Dioscoreae, Radix Achyranthis Bidentatae, Kudzu root, Radix Asparagi, Rhizoma Gastrodiae, Radix Trichosanthis, Rhizoma Bletillae, Radix Paeoniae Alba, Rhizoma Atractylodis Macrocephalae and Radix Codonopsis should not exceed 400 mg kg−1.34
Chinese official determination methods of SO2 residue in herbal medicines include acid–base titration, gas chromatography and ion chromatography. The first and third need a pre-treatment of steam distillation, they are complicated in operations and time-consuming. Therefore, effective and rapid determination of sulfur dioxide residue in herbal medicines becomes a key of quality supervision. It is expected to establish fast and efficient methods. FTIR spectroscopy has been reported to be used to identify sun-dried and sulfur-fumigated Radix Paeoniae Alba,35 Radix Angelicae Sinensis,36 but they needed extraction and didn't determine SO2 residue.
UV-vis-shortwave near infrared diffuse reflectance spectroscopy (UV-vis-SWNIR DRS) has advantages containing the information regarding electron-energy level transition as well as vibrational motion of molecules, being simple, fast and non-destructive. We have reported its applications on qualitative and simultaneous quantitative analysis of cimetidine polymorphs,37 qualitative analysis of chiral alanine,38 simultaneous determination of amiloride and hydrochlorothiazide in a compound tablet,39 qualitative and quantitative analysis of chiral alanine,40 rapid and simultaneous determination of soil properties,41 in which the importance of UV-vis spectral region for analysis has proven. But its use for the identification of habitats of herbal medicines and determination of SO2 residue in herbal medicines has not been reported.
Radix Astragali, a kind of Chinese traditional medicine mainly distributed in North China, has following clinical efficacies: tonifying qi and lifting yang, consolidating exterior for arresting sweating, inducing diuresis for removing edema, creating body fluid and nourishing blood, dissipating stagnation and promoting arthromyodynia, expelling toxin and eliminating pus, restraining ulceration and growing skin.34 It can enhance the immune function of patients, viral interferon induction ability, hypoxia tolerance of the patients' body, promote metabolism and the antihypertensive and liver-protecting function. It is widely used in clinical treatment of many diseases. Radix Astragalus is prone to pests during storage.
Therefore, the objective of this study is to establish a simple, fast and non-destructive method to identify habitats of herbal medicines and to determine their SO2 residues, by using UV-vis-SWNIR DRS combined with chemometrics, and Radix Astragali was used as a research object.
2 Experimental
2.1 Sample and sulfur fumigation
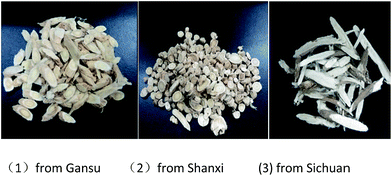
Radix Astragali from three provinces Sichuan, Shanxi and Gansu were purchased from Wu Kuaishi market of Chinese herbal medicines in Chengdu, Sichuan province. In appearance, Radix Astragali from Sichuan is partial white, Radix Astragali from Gansu and Shanxi are yellowish, as shown in Fig. 1.About 150 g of Radix Astragali of each habitat was weighed, wetted by spraying 40 mL of water and kept in a plastic bag for 12 h, then fumigated for 2 days by the smoke generated from the combustion of a certain amount of sulfur in a homemade device. After that the fumigated Radix Astragali was dried in an air dry oven of 30 °C for 2 days, milled with a household food disintegrator and sieved. The powder samples through 80-mesh sieve were collected and kept under seal.
During milling and sieving, it was found that more fibrous residue was not able to pass through 80-mesh sieve in Radix Astragali from Sichuan than from Gansu and Shanxi. The fibrous residue was cut with scissors and milled repeatedly until they can pass.
Five levels of sulfur fumigation were implemented for Radix Astragali of each habitat. The accurate sulfur dioxide residues in all the samples of Radix Astragali (three habitat, 5 levels of sulfur fumigation) were determined by acid–base titration method listed in Chinese Pharmacopoeia (2015)34 and the obtained values were treated as the reference values of sulfur dioxide residues.
The powder samples of certain appropriate levels of sulfur fumigation from a same habitat were weighed accurately, mixed according to a certain ratio to obtain 80 samples with different contents of SO2, so 240 spectral samples obtained for the three habitats.
2.2 Apparatus
S3000 fiber optic spectrometer (Race-Technology Co., Ltd, Hangzhou, China) equipped with a 3648-element linear silicon CCD array detector (Toshiba TCD 1305), a light source (Oceans Optics Inc., USA), a Y-type optical fiber probe and a home-made sample cell made from dark gray PVC was used to measure the UV-vis-SWNIR diffuse reflectance spectra.37Sieves (Surwit Co., Ltd, Hangzhou, China) of 80, 100 and 120-mesh sieves (0.200, 0.150 and 0.125 mm nominal diameters) were used to screen the milled samples.
2.3 Procedures
According to Saeys et al.42 and Vohland et al.,43 RPD > 3.0 and R2 > 0.90 are considered to be indicative of an excellent prediction; 2.5 < RPD < 3.0 and 0.81 < R2 < 0.90 indicate good prediction; 2.0 < RPD < 2.5 and 0.66 < R2 < 0.81 make approximate quantitative predictions possible; 1.5 ≤ RPD < 2.0 and 0.50 ≤ R2 < 0.66 reveal a possibility to distinguish between high and low; RPD < 1.5 or R2 < 0.50 indicate that prediction is bad.
3 Result and discussion
3.1 Spectra
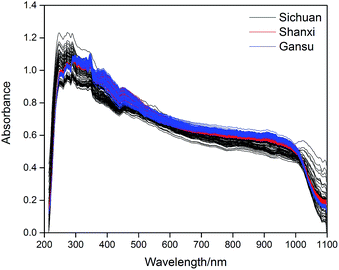
The original UV-vis SWNIR DRS showed that the absorbance in the range above 1090 nm and below 213 nm is negative. It might be due to instrument noise. Therefore, spectrum below 213 nm and above 1090 nm was cut off, leaving the spectral range of 213–1090 nm for analysis use, as shown in Fig. 2. It can be seen that the spectral waveforms were similar, but spectral intensity differs to some extend with habitats or SO2 residue levels, especially as for the samples from Sichuan in the ranges of 240–450 nm and 1000–1100 nm.3.2 Identification of habitats
Identification of habitats was carried out on the base of wavelength selection. The aim of wavelength selection is to select the informative wavelengths which are relevant to the property of interest, in other words, to remove the uninformative and/or interfering variables to construct a reliable and interpretable calibration model with good prediction accuracy.The forward evolving window correlation coefficient method was used to select characteristic wavelength range for PCA. The intra-class correlation coefficient of every kind of habitat and the average of three inter-class correlation coefficients between every two kinds of habitat samples were calculated, the results are shown in Fig. 3.
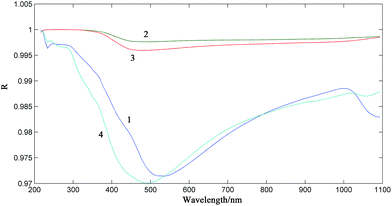 | ||
| Fig. 3 Forward evolving window correlation coefficient method (1) Sichuan; (2) Shanxi; (3) Gansu; (4) average of inter-class. | ||
The larger the intra-class correlation coefficient and the smaller the inter-class correlation coefficient, the more conducive the realization of sample classification and discrimination.
Fig. 3 shows that the correlation coefficients were all greater than 0.97 in the full spectral range, and in the range of 213–530 nm the average of inter-class correlation coefficients was smaller than the intra-class correlation coefficients. This provides the possibility to classify habitats. Therefore, besides the full spectral range of 213–1090 nm, various ranges of 213–1090 nm, 213–590 nm, 213–510 nm, 320–510 nm, 213–350 nm, 213–310 nm, 240–310 nm and 213–530 nm were tried as modelling wave bands in following PCA modelling.
In PCA modelling, the percentage of cumulative variance of the first N principle components vs. the total variance was calculated. Applying PCA in full spectral range of 213–1090 nm gave the first cumulative variance of 60%, the second cumulative variance of 86% and the third cumulative variance of 94.5%, while PCA in the range of 213–310 nm gave the best results, with the first cumulative variance of 72.5%, the second cumulative variance of 95% and the third cumulative variance of 99%. The three-dimensional projection using the range of 213–310 nm is shown in Fig. 4, which demonstrates the better effect of identification of habitats.
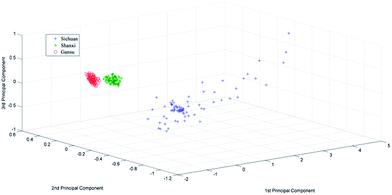 | ||
| Fig. 4 Three-dimensional projection of the three habitats of Radix Astragali on the first three principle components of PCA in spectral range of 213–310 nm. | ||
In Fig. 4, compared with Radix Astragali from Gansu and Shanxi, Radix Astragali from Sichuan dispersed in a larger scope, which may be due to the powder size of Radix Astragali from Sichuan. As has been mentioned above, more fibrous residue in Sichuan Radix Astragali powder was found than in Gansu Radix Astragali, Shanxi Radix Astragali. Therefore, it was considered that there were more fibrous or long-shaped particles in Sichuan Radix Astragali powder samples. This is disadvantageous to obtain a smooth sample surface when filled in the sample cell. Rough surface of a packed sample may cause larger fluctuations of the measured spectra. But in this case, this still permit a clear discriminant of the three habitats of Radix Astragali. This implies that the difference of natures or compositions between the three habitats of Radix Astragali is larger than the difference caused by smoothness of sample surface.
The results show that UV-vis spectrum plays an important role in identification of origin of Radix Astragali; by using UV-vis-SWIR DRS combined with PCA, habitat identification of Radix Astragali is feasible, whether it is sulfur-fumigated, or not sulfur-fumigated.
3.3 Determination of SO2 residues
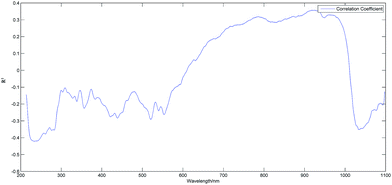
The total 240 spectra of Radix Astragali from 3 habits were divided into a calibration set of 180 samples and a test set of 60 samples by K/S algorithm.Fig. 5 is the plot of the correlation coefficient between SO2 residue and absorbance vs. wavelength. The bands with a R2 greater than 0.2421, that is, the mean value of absolute values of all R2 in the full spectrum, were used to build PLSR model for prediction of SO2 residue. But the results were not satisfactory: the square correlation coefficient R2 between predicted values of SO2 residue and their reference values for the calibration set and prediction set was 0.7805 and 0.7406, respectively.
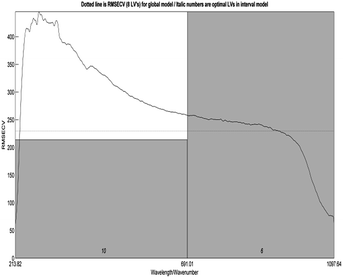
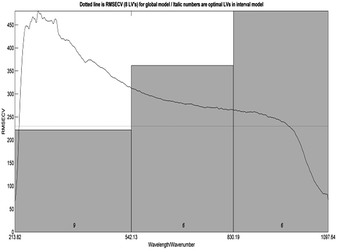
Then, wavelength selection for PLSR model was carried out by iPLS method. Fig. 6 and 7 is the plot of RMSECV vs. wavelength when the full wavelength range was divided into 2 intervals (2-iPLS) and 3 intervals (3-iPLS), respectively.
Comparing Fig. 6 and 7, it can be known that the RMSECV with the band (213–691 nm) obtained by 2-iPLS and the RMSECV with the band (213–542 nm) by 3-band iPLS were both lower than that (horizontal line) with the whole band, but the former was lower. So the band of 213–691 nm selected by 2-iPLS method was used in further study, and the modelling effects were listed at the fourth line in Table 1, better than those using the wavelength selected by correlation coefficient method (Fig. 5).
| Pretreatment | N | Calibration | Cross verification | Verification | ||||||
|---|---|---|---|---|---|---|---|---|---|---|
| R2 | RMSEC | RPD | R2 | RMSECV | RPD | R2 | RMSEP | RPD | ||
| a N: number of latent variable for modelling, O-E: Outliers Exclusion. | ||||||||||
| Raw spectrum | 8 | 0.8577 | 214.97 | 0.8311 | 234.73 | 0.8526 | 213.05 | |||
| 2-iPLS | 9 | 0.8776 | 199.31 | 2.858 | 0.8423 | 227.48 | 2.518 | 0.8711 | 201.56 | 2.785 |
| SG | 9 | 0.877 | 199.81 | 2.851 | 0.8461 | 224.66 | 2.549 | 0.8702 | 194.43 | 2.776 |
| NOR | 8 | 0.863 | 210.90 | 0.8374 | 231.30 | 0.8613 | 207.87 | |||
| Spectroscopic | 10 | 0.883 | 194.93 | 0.8191 | 243.55 | 0.8336 | 1600.7 | |||
| MSC | 6 | 0.8382 | 229.17 | 0.8092 | 250.49 | 0.8431 | 217.54 | |||
| Noise | 6 | 0.9645 | 107.30 | 0.558 | 380.76 | 0.4631 | 393.93 | |||
| 1st D | 6 | 0.9743 | 91.37 | 0.7332 | 296.41 | 0.0136 | 1402.7 | |||
| 2nd D | 1 | 0.8272 | 236.84 | −0.2557 | 641.72 | 0.0681 | 1055.2 | |||
| Baseline | 8 | 0.8617 | 211.92 | 0.8311 | 235.67 | 0.8633 | 204.45 | |||
| SNV | 6 | 0.8424 | 226.17 | 0.8185 | 244.43 | 0.8464 | 215.54 | |||
| Center and scale | 9 | 0.8776 | 199.31 | 0.8457 | 224.94 | 0.8711 | 201.56 | |||
| Reduce | 9 | 0.8771 | 199.76 | 0.8486 | 222.87 | 0.8711 | 201.54 | |||
| SNV + SG | 7 | 0.8536 | 217.98 | 0.8282 | 237.40 | 0.8642 | 299.46 | |||
| SG + SNV | 8 | 0.8743 | 201.98 | 0.8426 | 227.26 | 0.6794 | 3951.1 | |||
| SG + MSC | 8 | 0.8692 | 206.08 | 0.8416 | 229.06 | 0.7165 | 304.12 | |||
| SG + reduce | 9 | 0.877 | 199.84 | 0.8479 | 223.08 | 0.871 | 201.62 | |||
| SG + noise | 6 | 0.9674 | 102.92 | 0.5888 | 367.29 | 0.5935 | 346.05 | |||
| SG + 1st D | 8 | 0.9653 | 106.20 | 0.801 | 256.00 | 0.0002 | 3800.9 | |||
| MSC + SG | 7 | 0.8504 | 220.38 | 0.8286 | 237.90 | 0.8532 | 211.20 | |||
| 2-iPLS + SG + O-E | 9 | 0.9238 | 153.38 | 3.623 | 0.9014 | 175.81 | 3.185 | 0.9322 | 142.55 | 3.840 |
In this study, spectral data pre-treatment was performed by the 18 pre-treatment methods shown in Table 1, using the optimum modelling waveband (213–691 nm) selected in Section 3.3.1. It is found that modelling with SG smoothing pre-treatment has the best effect.
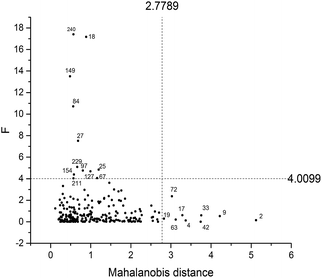
In this study, the outlier removal was carried out on the basis of SG smoothing pre-treatment having the best modelling effect. By computation, the value of Dt was 2.7789. The chemical value outliers were determined by the threshold value (Fa = 4.0099) computed by F distribution with 1 degree of freedom in the numerator and 239 degrees of freedom in the denominator and 95% of confidence level. As a result, there were 21 outliers as shown in Fig. 8. The results of modelling before and after outlier exclusion were showed in Table 1.
The limit of detection (LD) was calculated to estimate the lowest content of residual SO2 that can be measured. The limit of detection was determined from multiple measurements (n = 9) of the spectral response of samples containing 60 mg residual SO2 per kg of Radix Astragali from Gansu and Shanxi, 267 mg residual SO2 per kg of Radix Astragali from Sichuan. The LDs were calculated by multiplying the standard deviation by three and then dividing by the slope of the calibration curve, as shown by eqn (1):
| LD = 3 × S.D./slope | (1) |
The LD of residual SO2 was found to be 360 mg kg−1 for Radix Astragali from Gansu and Shanxi, 550 mg kg−1 for Radix Astragali from Sichuan. Although they are not as low as 150 mg kg−1, but less than or near 400 mg kg−1, the limit of sulfur dioxide residues in ten traditional Chinese medicines allowed by China. Compared with the qualitative analysis of sulfur dioxide residues in the report35 which used FTIR, the sensitivity of our method is greatly improved. It is believed that in future with the improvement of optical fiber spectrometer hardware system, especially the improvement of the stabilities of light source and spectrometer, the precision of the proposed method will be improved, consequently, the detection limit will be reduced.
4 Conclusions
The application of UV-vis and short wave near-infrared diffuse reflectance spectrum coupled with chemometrics on the identification of habitat and determination of sulfur dioxide residue of sulfur fumigated Chinese herb medicine was investigated first. UV-vis spectrum plays an important role in both the identification of habitat of CHM and determination of SO2 residue. By using UV-vis-SWNIR DRS combined with PCA, habitat of Radix Astragali is identified definitely, whether it is sulfur-fumigated, or not sulfur-fumigated; through wavelength band selection, SG smoothing and excluding outliers, modelling results were improved with a R2 of 0.9238, 0.9104 and 0.9322 for calibration set, cross validation set and validation set, respectively.The results imply that a convenient, rapid method for the identification of habitat of sulfur fumigated Chinese herbal medicines and determination of sulfur dioxide residue by UV-vis and short wave near-infrared diffuse reflectance spectrum is feasible.
Acknowledgements
This work was supported by the Science and technology special fund of Sichuan Provincial Administration of Traditional Chinese Medicine, China (No. 2016Q058) and the Scientific Research Foundation of the Education Department of Sichuan Province, China (No. 16ZB0122).References
- J. Xu, Authenticity identification of Chinese rhubarb, Tianjin Pharmacy, 2001, 6, 51–52 Search PubMed.
- J. R. Wang, Z. Y. Zhang, Z. W. Zhang, Y. H. Xiang and P. d. B. Harrington, THz-TDS combined with a fuzzy rule-building expert system applied to the identification of official rhubarb samples, Anal. Methods, 2014, 6, 7695 RSC.
- Y. L. Zhen, C. X. Zhang and X. G. Li, TLC scanning method for identification of Panax quinquefolius Linn. and P. ginseng Meyer, Chin. Tradit. Pat. Med., 1989, 7, 35–36 Search PubMed.
- S. L. Wang, TLC identification of radix ginseng, radix notoginseng and radix astragali, Drug Stand. China, 2003, 2, 48–50 Search PubMed.
- X. Su, X. K. Li, T. Wu, T. Zhang and Z. T. Wang, Fingerprint analysis of Glehniae Radix by TLC, J. Chin. Med. Mater., 2012, 35, 210–213 CAS.
- Y. L. Feng and B. Y. Yu, Identification of Rhei and some preparations contained Rhei by HPLC, Drug Stand. China, 2009, 10, 296–298 CAS.
- F. Q. Zha, L. F. Hu, J. W. Wu and Y. X. He, Study on identification of genuine and sham flos chrysanthemi indici by HPLC, J. Anhui Agric. Sci., 2011, 39, 5765–5766 Search PubMed.
- L. R. Duan, X. K. Zhang, W. Cao, Y. H. Xie and S. W. Wang, Study on the HPLC fingerprint of toad skin from different regions, J. Chin. Med. Mater., 2012, 35, 182–187 CAS.
- L. Yang, Z. J. Su, X. Zeng, X. Li and Z. F. Wu, Quality assessment of Fructus xanthii based on fingerprinting using high-performance liquid chromatography, J. AOAC Int., 2012, 95, 1053–1058 CrossRef CAS PubMed.
- Q. Li, Y. Q. Liu, L. F. Han, J. Z. Liu, W. Y. Liu, F. Feng, J. Zhang and N. Xie, Chemical constituents and quality control of two Dracocephalum species based on high-performance liquid chromatographic fingerprints coupled with tandem mass spectrometry and chemometrics, J. Sep. Sci., 2016, 39, 4071–4085 CrossRef CAS PubMed.
- D. Wang, Q. Y. Zhang, X. X. Yang, Y. J. Jiang, M. Y. Shang, Z. W. Zhang, S. Q. Cai, Y. Y. Zhao and X. Wang, Study on HPLC-fingerprint-based identification of Dao-di herb and non Dao-di herb of Scutellariae Radix, China J. Chin. Mater. Med., 2013, 12, 1951–1960 Search PubMed.
- H. Q. Chen, Study on infrared fingerprint of Salvia miltiorrhiza, China J. Chin. Mater. Med., 2006, 31, 1285–1286 CAS.
- K. Y.-L. Yap, S. Y. Chan and C. S. Lim, Authentication of traditional Chinese medicine using infrared spectroscopy: distinguishing between ginseng and its morphological fakes, J. Biomed. Sci., 2007, 14, 265–273 CrossRef CAS PubMed.
- J. Mao and J. Xu, Discrimination of herbal medicines by molecular spectroscopy (including near infrared diffuse reflection spectroscopy, Raman spectroscopy and infrared spectroscopy) and chemical pattern recognition, Spectrochim. Acta, Part A, 2006, 65, 497–500 CrossRef PubMed.
- H. R. Zhao, S. M. Wen, X. Y. Wang, S. M. Chu and X. J. Huo, Study of Flos Lonicerae in local herbs and other areas by FTIR spectrum, Spectrosc. Spectral Anal., 2005, 25, 705–707 CAS.
- Y. A. Woo, H. J. Kim, J. H. Cho and H. Chung, Discrimination of herbal medicines according to geographical origin with near infrared reflectance spectroscopy and pattern recognition techniques, J. Pharm. Biomed. Anal., 1999, 21, 407–412 CrossRef CAS PubMed.
- B. K. Huang, B. Zhu, H. C. Zheng, L. P. Qin and Q. Y. Zhang, Identification of Fructus Broussonetiae from different habitats and its confused species with clustering analysis by near-infrared diffuse reflectance spectrometry, J. Chin. Med. Mater., 2002, 25, 874–875 Search PubMed.
- L. Y. Sun, T. M. Yang and Y. Y. Wang, Identification of Cortex Phellodendri Chinensis by near infrared spectroscopy fingerprint, Comput. Appl. Chem., 2008, 25, 329–332 CAS.
- B. X. Li, Y. H. Wei, L. L. Xi, H. G. Duan and X. A. Wu, Qualitative research on Radix Anglicae Sinensis from different origins in different harvest time by near infrared spectrum and chemometrics, Chin. J. Spectrosc. Lab., 2011, 28, 2128–2134 CAS.
- H. Li, S. Q. Du, L. Xie, L. Chen, Y. Peng, Y. M. Zhu, T. Wu, H. Li, P. Dong and J. T. Wang, Identifying Radix Curcumae by using terahertz spectroscopy, Optik, 2012, 123, 1129–1132 CrossRef CAS.
- Q. K. Chen, Y. M. Zhu, H. Jia, S. Q. Du, G. M. Liu and S. L. Zhuang, Identifying Radix Curcumae based on partial least squares, Optik, 2013, 124, 3091–3094 CrossRef.
- Y. J. Chen, Y. Y. Liu, G. Z. Zhao, W. N. Wang and F. L. Li, Chinese traditional medicine recognition by support vector machine(SVM) Terahertz spectrum, Spectrosc. Spectral Anal., 2009, 29, 2346–2350 CAS.
- Y. P. Yang, S. Sree Harsh, A. J. Shutler and D. R. Grischkowsky, Identification of Genistein and Biochanin A by THz (far-infrared) vibrational spectra, J. Pharm. Biomed. Anal., 2012, 62, 177–181 CrossRef CAS PubMed.
- J. Jiang, P. Li, H. B. Zhou, Y. Y. Qian, L. Sun, R. Wan, S. L. Li and X. B. Jia, Study condition and the quality control study route of the sulfur fumigation Chinese medicine, China J. Tradit. Chin. Med. Pharm., 2014, 29, 1764–1767 CAS.
- C. Q. Mao, L. Ji, T. L. Lu, X. Shan, L. Li, H. Z. Liu, Z. W. Ning, Y. Song and J. J. Zhu, Research development of harmful substances and its harm of traditional Chinese medicine after sulfur fumigation, China J. Chin. Mater. Med., 2014, 39, 2801–2806 CAS.
- L. Ji, D. X. Li, Y. Peng and L. Tong, Advances in Study of Sulfur Dioxide Residue in Traditional Chinese Medicine and its Prepared Slices, Mod. Chin. Med., 2015, 17, 185–190 CAS.
- S. L. Li, J. Z. Song, F. F. K. Choi, C. F. Qiao, Y. Zhou, Q. B. Han and H. X. Xu, Chemical profiling of Radix Paeoniae evaluated by ultra performance liquid chromatography/photo diode array/quadru pole time of flight mass spectrometry, J. Pharm. Biomed. Anal., 2009, 49, 253–266 CrossRef CAS PubMed.
- Z. X. Xing, Y. B. Cui and W. Liu, Determination of the content of Chlorogenic acid in sulfur fumigation and drying honeysuckle of different areas by HPLC, China Med. Her., 2013, 6, 98–99 Search PubMed.
- X. H. Wang, P. S. Xie, W. K. Lam Chris, C. W. K. Lama, Y. Z. Yan and Q. X. Yu, Study of the destructive effect to inherent quality of Angelicae dahur icae radix(BaiZhi) by sulfur fumigated process using chromatographic finger printing analysis, J. Pharm. Biomed. Anal., 2009, 49, 1221–1225 CrossRef CAS PubMed.
- Y. Peng, X. L. Li, L. Yin, Z. Wei and Y. P. Liu, Study on the research situation of sulfur fumigated processing and detection method of sulfur dioxide residues in traditional Chinese medicine, Pharmacy and Clinics of Chinese Materia Medica, 2012, 5, 5–8 Search PubMed.
- L. Xiao, T. Jiang, J. Nie and Y. Cheng, Impact of sulfur fumigation on quality of Scutellariae Radix, China J. Chin. Mater. Med., 2016, 41, 2216–2220 Search PubMed.
- Y. Duan, K. M. Qin, N. S. Zou, Y. J. Lou, H. Cai and B. C. Cai, Sulfur-fumigation, maintenance method of Chinese herbal medicine—discard or inheritance, China J. Chin. Mater. Med., 2013, 38, 3395–3399 Search PubMed.
- X. Liu, X. Q. Ma, H. Cai, J. J. Liu, J. S. Li and B. C. Cai, Determination of metallic and trace elements in Lonicerae japonicae Flos before and after sulfur-fumigated process by ICP-AES, Chin. Tradit. Pat. Med., 2012, 34, 293–296 CAS.
- Chinese Pharmacopoeia, 2015 version Search PubMed.
- K. Pei, H. Cai, X. Liu, Y. J. Lou, X. Q. Song, F. X. Qiao and B. C. Cai, Identification of sun-dried and sulfur-fumigated Chuanxiong Rhizoma by FTIR, J. Chin. Med. Mater., 2015, 38, 1393–1399 CAS.
- Y. J. Lou, H. Cai, X. Liu, K. Pei, X. Q. Ma, S. L. Li and B. C. Cai, Quick identification of sun-dried and sulfur-fumigated Angelicae Sinensis Radix by Fourier transform infrared spectroscopy, China J. Chin. Mater. Med., 2012, 37, 1127–1132 CAS.
- Y. Y. Feng, X. L. Li, K. L. Xu, H. Y. Zou, H. Li and B. Liang, Qualitative and simultaneous quantitative analysis of cimetidine polymorphs by ultraviolet–visible and shortwave near-infrared diffuse reflectance spectroscopy and multivariate calibration models, J. Pharm. Biomed. Anal., 2015, 104, 112–121 CrossRef CAS PubMed.
- X. L. Li, K. L. Xu, H. Li, S. Yao, Y. F. Li and B. Liang, Qualitative analysis of chiral alanine by UV-visible shortwave near infrared diffuse reflectance spectroscopy combined with chemometrics, RSC Adv., 2016, 6, 8395–8405 RSC.
- J. Tang, X. Li, Y. Feng and B. Liang, Simultaneous determination of amiloride and hydrochlorothiazide in a compound tablet by diffuse reflectance spectroscopy and chemometrics, J. Appl. Spectrosc., 2016, 83, 669–675 CrossRef.
- B. Liang, X. L. Li, X. L. Jing, T. Li and S. Yao, Qualitative and quantitative analysis of chiral alanine by UV-visible-shortwave near infrared diffuse reflectance spectroscopy combined with chemometrics, J. Sichuan Univ., Eng. Sci. Ed., 2016, 3, 190–195 Search PubMed.
- T. Li, R. F. Tu, J. Zhu and B. Liang, Rapid and simultaneous determination of soil properties by UV-vis-SWIR diffuse reflectance spectroscopy, Chemical Research and Application, 2016, 28, 987–993 Search PubMed.
- W. Saeys, A. M. Mouazen and H. Ramon, Potential for onsite and online analysis of pig manure using visible and near infrared reflectance spectroscopy, Biosyst. Eng., 2005, 91, 393–402 CrossRef.
- M. Vohland, M. Ludwig, S. Thiele-Bruhn and B. Ludwig, Determination of soil properties with visible to near- and mid-infrared spectroscopy: Effects of spectral variable selection, Geoderma, 2014, 223–225, 88–96 CrossRef CAS.
- W. L. Zhang, N. Li, Y. Y. Feng, S. J. Su, T. Li and B. Liang, A unique quantitative method of acid value of edible oils and studying the impact of heating on edible oils by UV-vis spectrometry, Food Chem., 2015, 185, 326–332 CrossRef CAS PubMed.
| This journal is © The Royal Society of Chemistry 2017 |

