DOI:
10.1039/C7RA00415J
(Paper)
RSC Adv., 2017,
7, 23011-23020
Equilibrium and kinetic studies on the adsorption of thiophene and benzothiophene onto NiCeY zeolites
Received
11th January 2017
, Accepted 19th April 2017
First published on 26th April 2017
Abstract
NiCeY zeolites were prepared by ion-exchanging NaY with 0.1 M Ni(NO3)2 and 0.1 M Ce(NO3)3 solution. The experiment for the adsorption of thiophene and benzothiophene from a model fuel has been carried out by using the prepared NiCeY. The adsorption isotherms and kinetics of thiophene and benzothiophene in n-octane have been studied, and the parameters (ΔH, ΔG, ΔS) for the adsorption were calculated. The effect of adsorption temperature and contact time on the adsorption were investigated through the static method at ambient pressure. The experimental data was analyzed using the pseudo first order and pseudo second order kinetic equations and Langmuir and Freundlich models. The results show that the isotherm equilibrium for thiophene and benzothiophene adsorption can be represented by the Langmuir equation.
1. Introduction
Nowadays, desulfurization of fuels has attracted increasing attention due to the increasing stringent regulations for environment protection and potential use in fuel cells in the future.1,2 The sulfur compounds in fuels may have negative effects on the environment. Organic sulfur compounds can be transformed into SOx when combusted in engines, which may react with water in the atmosphere to form acid rain, damaging buildings, leading to loss of forests and other problems.3 Sulfur compounds can also poison some catalysts in exhaust gas converters for reducing CO and NOx emissions, and cause corrosion problems in refining equipment.4 The EPA in the United States has reduced the sulfur content in fuel to 30 ppm in gasoline and 15 ppm in diesel since 2006.5
Industrially, hydrodesulfurization is used to reduce the sulfur content in refineries. HDS is efficient to remove sulfur species with relative ease, such as thiols, sulfides and disulfides from oils, but less effective to remove thiophene, benzothiophene, dibenzothiophene and their derivatives, because of their aromatic characters.6 In addition, the HDS technology is operated at temperatures in the range of 300–450 °C, and at H2 pressure of 3.0–5.0 MPa, usually with CoMo/Al2O3 or NiMo/Al2O3 catalysts.7,8 Under such conditions, olefins will react with H2 to form alkanes, resulting to significant loss of octane number and excess consumption of H2.9 The lower reactivity of these aromatic sulfur compounds is much attributed to steric hindrance. It is reported that the removal of aromatic sulfur compounds by HDS process to the standard levels would require more than three-fold increase in the catalyst volume/reactor size, resulting in an enormously high cost of operation for higher temperature and higher pressure process.10,11 Thus, it is imperative to develop non-HDS technologies to meet the need for fuels with low sulfur content, such as oxidative desulfurization,12,13 biodesulfurization,14,15 and adsorptive desulfurization.16,17
Compared to the hydrodesulfurization process, the adsorptive removal of sulfur compounds seems very promising from the point of energy consumption because the adsorption can be carried out at low temperature and pressure, and the sulfur content in the fuels can be reduced to a very low level.18 So far, a various of materials used as adsorbents were studied for desulfurization such as active carbon,19–21 metal oxides,22,23 and zeolite-based materials.24,25 Zeolites, especially FAU type adsorbent, have been investigated widely in desulfurization of transformation due to their high surface area and thermal and mechanical stabilities.
Except the experimental studies, a mathematical modeling is an efficient method for analysis of the chemical processes. There are different theoretical and empirical models used to fit the experimental data. It seems that using this method in understanding and simulating the adsorptive removal of sulfur compounds from fuels can reduce the cost of experiments and increases the feasibility of the process. Therefore, the study of adsorption process from both experimental and theoretical aspects is important. The theoretical models include the Langmuir and Freundlich models. There are several empirical models for modeling of adsorption kinetics, including the pseudo-first-order, pseudo-second-order and pseudo-n-order. The advantage of the empirical models is their simplicity.26
To the best of our knowledge, the use of NaY zeolites modified with Ni(NO3)2 and Ce(NO3)3 successively in the field of adsorption desulfurization has few reported. In Wang's work,27 the influence of Ce loading, toluene, catalyst/oil ratio on the sulfur removal onto NiCeY were analyzed. The results indicated that NiCeY possessed higher sulfur adsorption quantity than NiY and CeY. In this study, NiCeY was prepared to investigated the adsorption kinetics, isotherm and thermodynamics on the removal of thiophene and benzothiophene. The parameters were calculated using different models.
2. Experiments
2.1 Materials
Zeolites NaY (power form, SiO2/Al2O3 = 2.5) was obtained from Nankai Catalyst Technical Corporation. Thiophene (TP, 99%) and benzothiophene (BT, 99%) were bought from Tianjin Guangfu Fine Chemical Research Institute and Beijing Ouhe Technology respectively. N-Octane (AR) purchased from Tianjin Kuwait corporation was as solvent in experiment. All reagents were used without further purification.
2.2 Adsorbent preparation
Prior to the ion exchange, the zeolites NaY was dehydrated at a rate of 2 °C per minute to 300 °C by heating in muffle furnace and kept at 300 °C for 2 h. NiY zeolites was prepared by ion exchanging NaY with a 0.1 mol L−1 Ni(NO3)2 solution at 50 °C for 4 h. The ratio of the solution volume (mL) to the mass of zeolites (g) was 10![[thin space (1/6-em)]](https://www.rsc.org/images/entities/char_2009.gif) :
:![[thin space (1/6-em)]](https://www.rsc.org/images/entities/char_2009.gif) 1. After ion exchange, the obtained NiY zeolites was filtered, washed thoroughly with distilled water to remove the residuary Ni2+. The filtered cake was then dried at 110 °C for 5 h and calcined at 500 °C for 4 h. Both the obtained NiY and 0.1 mol L−1 Ce(NO3)3 aqueous solution were added to three-neck flask, and kept at 50 °C for 4 h. After filtering, washing, drying at 110 °C for 5 h, the zeolite was calcined at 500 °C for 4 h and we get the NiCeY zeolites. The color of the zeolites NiCeY changed from white to yellow after calcination, suggesting the oxidation of Ce3+ to Ce4+.
1. After ion exchange, the obtained NiY zeolites was filtered, washed thoroughly with distilled water to remove the residuary Ni2+. The filtered cake was then dried at 110 °C for 5 h and calcined at 500 °C for 4 h. Both the obtained NiY and 0.1 mol L−1 Ce(NO3)3 aqueous solution were added to three-neck flask, and kept at 50 °C for 4 h. After filtering, washing, drying at 110 °C for 5 h, the zeolite was calcined at 500 °C for 4 h and we get the NiCeY zeolites. The color of the zeolites NiCeY changed from white to yellow after calcination, suggesting the oxidation of Ce3+ to Ce4+.
The obtained NiCeY zeolite was grinded in the agate mortar sufficiently and shifted to glass desiccator immediately to avert the adsorption of water in air, reducing the adsorption capacity of thiophene and benzophene.
2.3 Preparation of model oil
Thiophene, benzothiophene and n-octane were used as the model components for compound containing sulfur and hydrocarbon in diesel desulfurization, respectively. Several model diesel fuels containing different concentration of sulfur were prepared and the detailed composition of the model fuels were listed in Table 1.
Table 1 The compositions of model diesels
| Ms |
S content (mmol L−1) |
Compositions |
| M1 |
21.92 |
Thiophene/n-octane |
| M2 |
17.54 |
Thiophene/n-octane |
| M3 |
13.15 |
Thiophene/n-octane |
| M4 |
8.77 |
Thiophene/n-octane |
| M5 |
4.38 |
Thiophene/n-octane |
| M6 |
21.92 |
Benzothiophene/n-octane |
| M7 |
17.54 |
Benzothiophene/n-octane |
| M8 |
13.15 |
Benzothiophene/n-octane |
| M9 |
8.77 |
Benzothiophene/n-octane |
| M10 |
4.38 |
Benzothiophene/n-octane |
2.4 Adsorptive desulfurization
Prior to the adsorption experiment, the zeolites NiCeY was dried in oven at 110 °C for 2 h in order to remove the physically adsorbed water. The adsorption experiment was carried out using static method at a certain temperature and atmospheric pressure. The dried zeolites (0.40 g) was mixed with 28 mL model fuel in three-neck flask rapidly. After 1 h, the desulfurized fuel was stewed and sampled, and the sulfur content of model fuel before and after adsorption was analyzed by a FID-gas chromatograph (Agilent, GC-6820) equipped with a capillary column (FFAP, 60 m × 0.25 mm × 0.32 μm). The temperatures set in the injector, oven and detector were 250, 200, 250 °C, respectively.
The adsorption capacity was calculated using the following equation:
| |
 | (1) |
The sulfur removal (R%) was calculated according to the formula:
| |
 | (2) |
where
V is the volume of the model fuel (mL), and
m (g) is the mass of adsorbent;
c0,
ce and
ct (mmol L
−1) is the initial, equilibrium and
t (min) concentration of sulfur in the model fuel, respectively.
3. Results and discussion
3.1 Effect of adsorption temperature
Generally, the effect of adsorption temperature on desulfurization experiment has two sides. Increasing the temperature would increase the diffusion rate of TP and BT in n-octane obviously, due to the decline of the viscosity in the solution. Meanwhile, too high temperature would enhance the desorption rate, thus reducing the adsorption capacity. Fig. 1 shows the effect of adsorption temperature on the adsorption capacity of TP and BT by using M1 and M6 as model fuel. It is observed that the adsorption capacity of thiophene and benzothiophene increased primarily from 0.65 to 0.70 mmol g−1 and 1.27 to 1.32 mmol g−1, then dropped to 0.67 and 1.29 mmol g−1 respectively when the temperature rised to 90 °C. From the results in Fig. 1, it can be concluded that the suitable adsorption temperature is 70 °C.
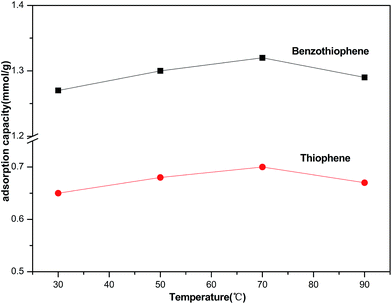 |
| | Fig. 1 Effect of temperature (30 °C, 50 °C, 70 °C, 90 °C) on the adsorption removal of thiophene and benzothiophene over NiCeY zeolites (model oil M1/M6: 7.00 mL; adsorbent: 0.10 g; contact time: 1 h). | |
3.2 Effect of contact time on adsorption
The contact time to reach the equilibrium relied on the adsorption temperature and other variables. In the experiment, different contact time experiments were carried out on NiCeY at 30 °C using model fuel M1 and M6. The effect of contact time on the adsorption of TP and BT is shown in Fig. 2. The adsorption capacity of TP and BT over NiCeY increased rapidly and achieved over 70.28% and 70.56% in the first 5 min, then increased slowly as the time was prolonged. When the time was equal to 45 min, qt became stable. It may have achieved equilibrium adsorption and the equilibrium adsorption capacity of TP and BT follows: BT > TP. Therefore, the equilibrium adsorption amount can be obtained in 45 min.
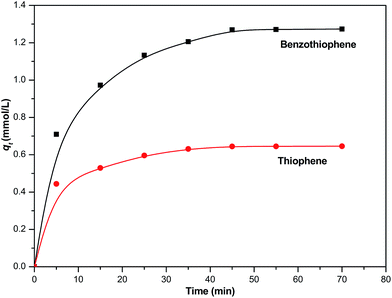 |
| | Fig. 2 Effect of adsorption time on the removal of thiophene and benzothiophene over NiCeY zeolites (model oil M1/M6: 28.00 mL; adsorbent: 0.40 g; temperature: 30 °C). | |
3.3 Effect of initial sulfur content on adsorption
The effect of the initial sulfur concentration on the adsorption of thiophene and benzothiophene at 30 °C is shown in Fig. 3. It is observed that the adsorptive capacity of thiophene and benzothiophene varied with its initial concentration. At the initial low sulfur content, the adsorption capacity of TP or BT increase rapidly and then increase gradually with increasing the sulfur content. This indicates that an increase in the initial concentration of sulfur leads to an increase in the adsorption capacity of TP and BT.
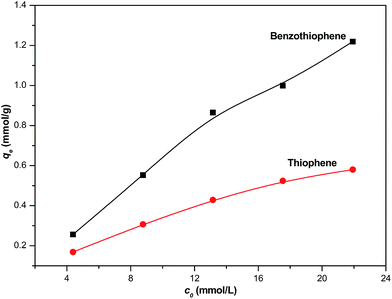 |
| | Fig. 3 Effect of initial sulfur content on the adsorption of thiophene and benzothiophene over NiCeY zeolites (model oil of M1–M10: 7.00 mL; adsorbent: 0.10 g; temperature: 30 °C). | |
3.4 Equilibrium isothermal adsorption
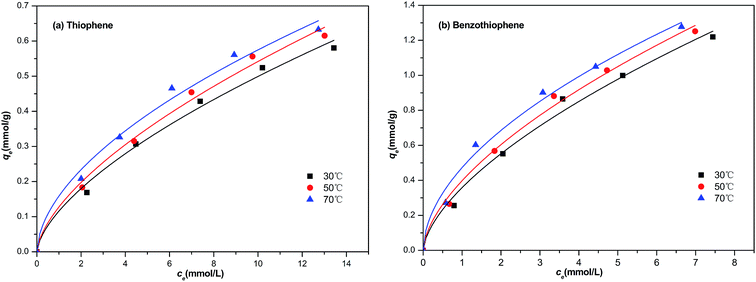
In our study, the equilibrium isothermal adsorption was progressed by using model diesel (M1–M10, respectively) with a contact time of 1 h at 30, 50 and 70 °C. The plot of the equilibrium adsorptive capacity of sulfur per gram of NiCeY zeolites against the equilibrium concentration of sulfur in the fuel are shown in Fig. 4. As can be seen from Fig. 4, initially, qe increases quickly with an increase of equilibrium concentration of sulfur, and then increases slightly. This indicates that most of the sulfur compounds could be adsorbed by NiCeY zeolites with the initial concentration of sulfur lower. However, with an increase of sulfur concentration, the adsorption capacity of NiCeY zeolites may reach its saturation and the equilibrium adsorptive capacity (qe) tends to be the maximum adsorption capacity (qm) (Fig. 5).
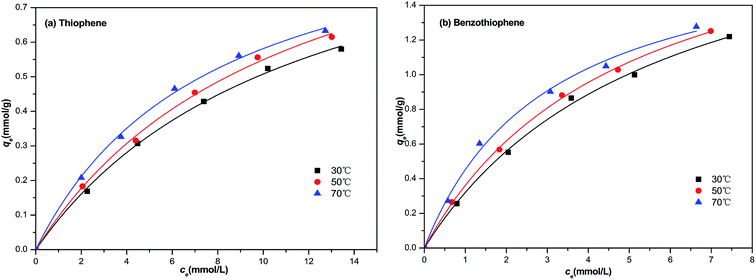 |
| | Fig. 4 Langmuir model equation used for the adsorption of (a) TP and (b) BT on NiCeY zeolites at different temperatures (30 °C, 50 °C, 70 °C). | |
 |
| | Fig. 5 Freundlich model equation used for the adsorption of (a) TP and (b) BT on NiCeY zeolites at different temperatures (30 °C, 50 °C, 70 °C). | |
The Langmuir model is possibly the most known and widely used sorption isotherm. It can fit to the experimental data. Generally, the interaction between the adsorbates and the adsorbent in solution includes two processes, namely, adsorption and desorption. The rates of adsorption (vads) and desorption (vd) can be expressed as:
where,
kads and
kd are the adsorptive and desorptive constants, respectively;
ct is the content of sulfur in model diesel at time
t;
θ is the coverage ratio of the adsorbent surface, which can be calculated by
qt/
qm, whereby
qt and
qm represents the adsorption capacity at time
t and the maximum adsorption amount. When the adsorption rate is equal to desorption rate, namely,
vads =
vd. The concentration of sulfur (
ct) and the adsorption capacity (
qt) can be written as
ce and
qe. Therefore, the Langmuir isothermal model can be described as:
28| |
 | (5) |
where
KL represents the Langmuir constant, reflecting the affinity of binding sites. The values of
KL and
qm are calculated from the
eqn (5).
The Freundich isotherm is expressed by an empirical model that suppose heterogeneous adsorption because of the diversity of adsorption sites and can be described as:29
where
KF and
n represent Freundlich constants indicative of adsorption capacity and adsorption intensity, respectively.
The calculated parameters and the correlation coefficient at different temperature are shown in Tables 2 and 3. From Table 2, we can find that with the increase of temperature, the Langmuir constant increase from 0.085 to 0.128 and from 0.175 to 0.330 for thiophene and benzothiophene adsorption on NiCeY zeolites. The obtained qm increase from 1.03 to 1.16 and 1.82 to 2.15 mmol g−1 with temperature range from 30 to 70 °C, this means increasing temperature is beneficial for thiophene and benzothiophene adsorption. The correlation coefficient at 30 °C, 50 °C, 70 °C are all above 0.990, manifesting that the experimental data can be fitted with Langmuir model well, thiophene and benzothiophene are monolayer adsorption on NiCeY zeolites. From Table 3, with the increase of temperature, the obtained KF increase from 0.116 to 0.158 and from 0.358 to 0.473, indicating the adsorption capacity increase with temperature. The obtained n is above 1.5, meaning adsorption process can occur easily.
Table 2 The calculated Langmuir adsorption isotherm parameters
| |
Parameters |
30 °C |
50 °C |
70 °C |
| Thiophene |
qm (mmol g−1) |
1.03 |
1.10 |
1.16 |
| KL (L mmol−1) |
0.085 |
0.090 |
0.128 |
| R2 |
0.996 |
0.995 |
0.994 |
| Benzothiophene |
qm (mmol g−1) |
1.82 |
2.10 |
2.15 |
| KL (L mmol−1) |
0.175 |
0.206 |
0.330 |
| R2 |
0.996 |
0.997 |
0.995 |
Table 3 The Freundlich adsorption isotherm parameters
| |
Parameters |
30 °C |
50 °C |
70 °C |
| Thiophene |
n |
1.57 |
1.59 |
1.78 |
| KF (L mmol−1) |
0.116 |
0.128 |
0.158 |
| R2 |
0.991 |
0.991 |
0.988 |
| Benzothiophene |
n |
1.60 |
1.66 |
1.86 |
| KF (L mmol−1) |
0.358 |
0.398 |
0.473 |
| R2 |
0.957 |
0.958 |
0.965 |
3.5 Kinetic study
3.5.1 Pseudo-first order, pseudo-second order models. The transport process of adsorbate from the solution into the pores on the adsorbent is a complicated process, containing external diffusion, pore diffusion, surface diffusion, and adsorption. NiCeY zeolites can adsorb the organic sulfur compounds mainly through two types of adsorption modes: π-complexation between Ni2+ ions and sulfur rings and direct coordination via S atoms with Ce4+ (S–M) interaction.30,31 Thus, to better understand the adsorption desulfurization process, the kinetic models was applied to fit the experimental data. Therefore, the pseudo-first order model, pseudo-second model were used to analyze the adsorption kinetics of the process on NiCeY zeolites.The pseudo-first order rate equation can be expressed as:32
| |
 | (7) |
where
qt (mmol g
−1) is the adsorption capacity of sulfur on the NiCeY at time
t (min),
k1 (min
−1) is the pseudo-first order rate constant and
qe (mmol g
−1) is the equilibrium adsorption capacity. After integration and applying the initial conditions,
t = 0,
qt = 0. The
eqn (8) can be written as:
| | |
qt = qe(1 − exp(−k1t))
| (8) |
The pseudo-second order rate equation is:33
| |
 | (9) |
where
qe is the equilibrium adsorption capacity (mmol g
−1),
k2 is the pseudo-second order rate constant (g mmol
−1 min
−1). The integrated form of
eqn (10) take the form:
| |
 | (10) |
In this section, the two adsorption kinetic models such as pseudo-first-order model and pseudo-second-order model were used to fit the kinetic data of the TP and BT adsorption process on NiCeY. As can be seen in Fig. 6 and 7, the two adsorption kinetic models can fit to the experimental data well. In Tables 4 and 5, the calculated correlation coefficient R2 of the pseudo-first-order model are less than the correlation coefficient R2 of the pseudo-second-order model (>0.990), indicating that the pseudo-second-order model is slightly more favorable to fit the kinetics of the thiophene and benzothiophene adsorption (Fig. 8).
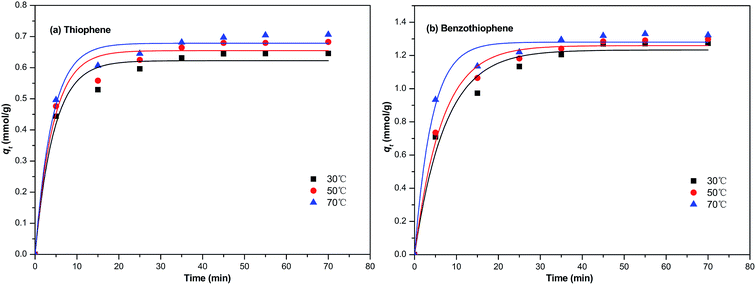 |
| | Fig. 6 The pseudo-first order model equation used for the adsorption of (a) TP and (b) BT on NiCeY zeolites at different temperatures (30 °C, 50 °C, 70 °C). | |
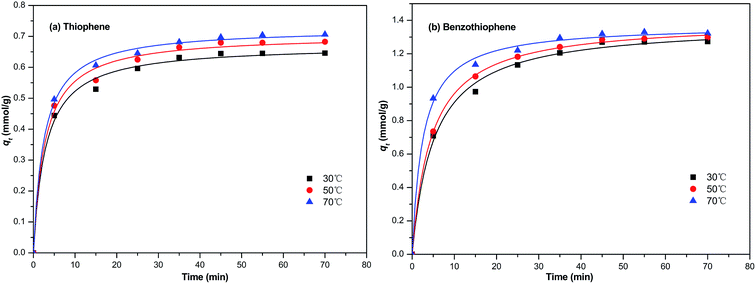 |
| | Fig. 7 The pseudo-second order model equation used for the adsorption of (a) TP and (b) BT on NiCeY zeolites at different temperatures (30 °C, 50 °C, 70 °C). | |
Table 4 The pseudo-first order kinetic parameters obtained at 30, 50, 70 °C by the nonlinear fitting
| |
Parameters |
30 °C |
50 °C |
70 °C |
| Thiophene |
K1 (min−1) |
0.225 |
0.235 |
0.247 |
| qe (mmol g−1) |
0.62 |
0.65 |
0.68 |
| R2 |
0.972 |
0.969 |
0.982 |
| Benzothiophene |
k1 (min−1) |
0.127 |
0.165 |
0.243 |
| qe (mmol g−1) |
1.23 |
1.25 |
1.28 |
| R2 |
0.975 |
0.987 |
0.982 |
Table 5 The pseudo-second order kinetic parameters obtained at 30, 50, 70 °C by the nonlinear fitting
| |
Parameters |
30 °C |
50 °C |
70 °C |
| Thiophene |
k2 (g mmol−1 min−1) |
0.519 |
0.493 |
0.553 |
| qe (mmol g−1) |
0.67 |
0.72 |
0.73 |
| R2 |
0.993 |
0.992 |
0.997 |
| Benzothiophene |
k2 (g mmol−1 min−1) |
0.140 |
0.158 |
0.282 |
| qe (mmol g−1) |
1.37 |
1.39 |
1.40 |
| R2 |
0.996 |
0.999 |
0.997 |
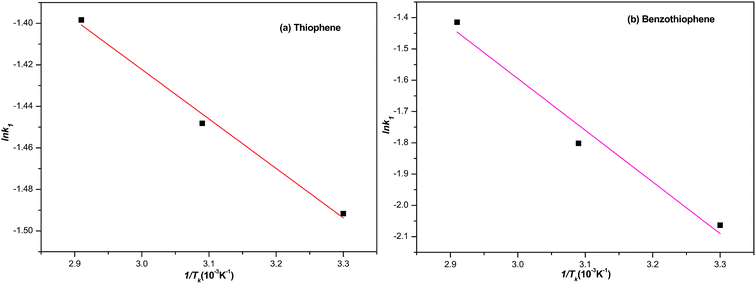 |
| | Fig. 8 The plot of ln![[thin space (1/6-em)]](https://www.rsc.org/images/entities/char_2009.gif) k1 to 1/T. k1 to 1/T. | |
3.5.2 The effect of temperature on the adsorption kinetics. Generally, the temperature has two main effects on the adsorption process: (1) increasing the adsorption temperature will increase the rate of diffusion of the adsorbate in the solution due to the decrease of the velocity of the solution. (2) Changing the adsorption temperature of the process will lead to a new equilibrium adsorption capacity of the zeolites. Fig. 7 present the effect of temperature on the adsorption kinetics with model fuel M1 and M6.The experimental date was fitted with the non-linear pseudo-first order equation. The calculated parameters are shown in Table 5. It is seen that the equilibrium adsorption capacity and pseudo-second rate constant for the removal of TP and BT all increase with the increase of temperature. The date shows that the adsorption of TP and BT on NiCeY is much more effective at higher temperature.
The effect of adsorption temperature on the adsorption rate can be expressed with the Arrhenius equation:34
| |
 | (11) |
where
k0 (g mmol
−1 min
−1) is the temperature independent factor;
Ea (kJ mol
−1) is the activation energy of adsorption process;
Tk is the absolute temperature in Kelvin;
Rg (8.314 J mol
−1 K
−1) is the universal gas constant, respectively. The equation can be written as:
| |
 | (12) |
Generally, the slope of the plot of ln![[thin space (1/6-em)]](https://www.rsc.org/images/entities/char_2009.gif) k1 to 1/T is applied to calculate Ea based on the data shown in Table 4. Typically, the adsorption desulfurization process can be regarded as mass transfer control if the obtained activation energy is less than 21 kJ mol.35 The activation energy 1.98 and 13.73 kJ mol−1 calculated lower than 21 kJ mol−1 for the adsorption of TP and BT on NiCeY zeolites indicate that the adsorption process is mass transfer controlled. The similar results can be found in ref. 36 and 37.
k1 to 1/T is applied to calculate Ea based on the data shown in Table 4. Typically, the adsorption desulfurization process can be regarded as mass transfer control if the obtained activation energy is less than 21 kJ mol.35 The activation energy 1.98 and 13.73 kJ mol−1 calculated lower than 21 kJ mol−1 for the adsorption of TP and BT on NiCeY zeolites indicate that the adsorption process is mass transfer controlled. The similar results can be found in ref. 36 and 37.
3.5.3 Diffusion study. The sorption of organic sulfur compounds on Y zeolites is a complex process. The adsorption can be controlled by the following steps: (1) the adsorbate diffuses from the diesel solution to the boundary layer of solution. (2) The adsorbate diffuses through the liquid film; (3) the pore diffusion and adsorption. One or two processes may be involved in the adsorption and the control of the adsorption is the slowest one.A widely accepted kinetic model developed by Weber and Morris38 shows that the sorption process may be diffusion controlled if the rate is dependent on the adsorbate and adsorbent diffusing towards one another. The intra-particle model is as:
where
ki (mmol g
−1 min
−0.5) is the intra-particle diffusion rate constant and
C (mmol g
−1) is the constant related to the energy of adsorption. The intraparticle diffusion model constants can be calculated by the slope and intercept of the linear plot of
q versus t1/2, respectively.
The straight line of qt to t0.5 indicates the sorption process is diffusion controlled. However, if the data can be fitted with multiple lines, implying that more than one process is controlling the adsorption process. As can be seen from Fig. 9, the plots are not linear, showing that adsorption is controlled by two processes. The initial portion indicates the boundary layer diffusion effect,39 and the final linear portion is the result of intraparticle diffusion effect.40
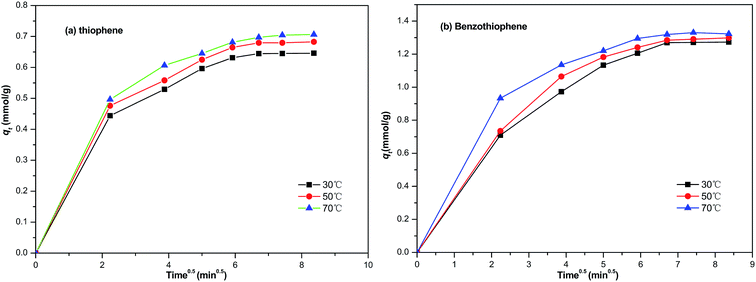 |
| | Fig. 9 The intra-particle diffusion model used for the adsorption of (a) TP and (b) BT on NiCeY zeolites. | |
3.6 Thermodynamic
The thermodynamic parameters such as free energy of sorption (ΔG), the heat of sorption and entropy changes (ΔH and ΔS) can be evaluated according to the following equations:41where Kd is sorption distribution coefficient.
The Kd values are usually used to calculate the Gibbs free energy of sorption process at different temperatures.
| |
ΔG = −RgTk![[thin space (1/6-em)]](https://www.rsc.org/images/entities/char_2009.gif) ln ln![[thin space (1/6-em)]](https://www.rsc.org/images/entities/char_2009.gif) Kd Kd
| (15) |
where Δ
G is the free energy of sorption (kJ mol
−1);
T is the absolute temperature in Kelvin and
Rg is the universal gas constant (8.314 J mol
−1 K
−1).
The sorption distribution coefficient can be written as a function of temperature in the following:
| |
 | (16) |
where Δ
H is the reaction heat of sorption process and Δ
S is the enthalpy change of adsorption.
The thermodynamic parameters such as the heat of sorption (ΔH), free energy of sorption (ΔG) and enthalpy change of adsorption (ΔS) were calculated using eqn (4)–(6). The temperature used was ranging from 30 to 70 °C. The Gibbs free energy (ΔG) means the degree of spontaneity of the sorption process and the higher negative value reflects a more energetically favourable sorption. ΔH and ΔS were obtained from the intercept and slop of a plot of ln![[thin space (1/6-em)]](https://www.rsc.org/images/entities/char_2009.gif) Kd against 1/Tk (Fig. 10). The calculated parameters are listed in Table 6. The negative value of Gibbs free energy change (ΔG < 0) indicates that the adsorption of either TP or BT on NiCeY zeolites is a spontaneous process. The value of ΔG becomes more negative with temperature increase. This indicates that the adsorption process is favoured with the increase of temperature. The negative value of ΔH manifest that the adsorption of TP or BT was exothermic and the positive value of ΔS shows the increase of freedom at liquid/solid interface during the adsorption process.
Kd against 1/Tk (Fig. 10). The calculated parameters are listed in Table 6. The negative value of Gibbs free energy change (ΔG < 0) indicates that the adsorption of either TP or BT on NiCeY zeolites is a spontaneous process. The value of ΔG becomes more negative with temperature increase. This indicates that the adsorption process is favoured with the increase of temperature. The negative value of ΔH manifest that the adsorption of TP or BT was exothermic and the positive value of ΔS shows the increase of freedom at liquid/solid interface during the adsorption process.
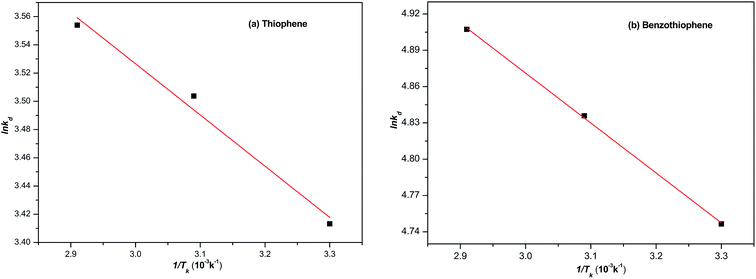 |
| | Fig. 10 The plot of ln![[thin space (1/6-em)]](https://www.rsc.org/images/entities/char_2009.gif) kd with 1/Tk. kd with 1/Tk. | |
Table 6 Thermodynamic parameters calculated for adsorption of TP and BT on NiCeY
| |
ΔH (kJ mol−1) |
ΔS (J mol−1 K−1) |
ΔG (kJ mol−1) |
| 30 °C |
50 °C |
70 °C |
| Thiophene |
−3.01 |
50.78 |
−8.60 |
−9.41 |
−10.13 |
| Benzothiophene |
−3.43 |
38.37 |
−11.96 |
−12.98 |
−14.00 |
3.7 Investigation of adsorption capacity comparison and regeneration
Due to the difficulty in comparing the sulfur adsorption performance using zeolites here with previous ones, the adsorption comparison may be favorable for the future works. The materials used as adsorbents previously reported, together with the experimental conditions and adsorption capacity are compared in Table 7. As shown in Table 7, We list the comparisons including the adsorption of thiophene, benzothiophene and dibenzothiophene compounds because much work has been done in adsorption desulfurization area.
Table 7 Comparison of the adsorption capacity for different materials
| Adsorbent |
Adsorbate/solvent |
C0 |
Adsorption mode |
qe |
Ref. |
| Activated carbon |
BT/n-octane |
300 ppm |
Batch |
1.29 |
42 |
| Activated carbon |
Real diesel |
72 ppm |
Fixed bed |
0.05 |
43 |
| NiY zeolites |
Real diesel |
297.2 ppm |
Fixed bed |
0.275 |
44 |
| CeY zeolites |
TP/n-heptane |
3529 ppm |
Fixed bed |
1.15 |
45 |
| MCM-41 |
FCC diesel |
— |
Fixed bed |
— |
46 |
| SBA-15 |
DBT/diesel |
564 ppm |
Batch |
0.31 |
47 |
| NiCeY |
TP/BT/n-octane |
1000 ppm |
Batch |
0.64/1.27 |
This work |
Finally, regeneration of the NiCeY zeolites was investigated, the common applied regeneration methods were thermal treatment and solvent extraction. In our work, we applied both methods to investigate the adsorption performance of NiCeY zeolites. After the first adsorption, the zeolites was separated by centrifugation, dried at 200 °C overnight and then calcinated at 500 °C for 4 h in air atmosphere for the next adsorption run. We also investigated a solvent extraction method for regenerating the adsorbent. The zeolites used was separated by centrifugation, washed with ethanol at room temperature, and then dried for the next adsorption run.
As shown in Fig. 11, the zeolites regenerated by solvent extraction has higher adsorption capacity compared with thermal treatment regeneration method. And the sulfur adsorption capacity declined slightly after the fourth run, indicating the satisfactory reusability of the NiCeY zeolite.
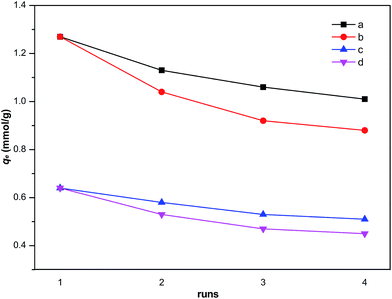 |
| | Fig. 11 Regeneration adsorption of thiophene and benzothiophene for NiCeY zeolites by thermal treatment and solvent extraction (initial sulfur concentration: 1000 ppm; T = 30 °C; (a) benzothiophene, solvent extraction; (b) benzothiophene, thermal treatment; (c) thiophene, solvent extraction; (d) thiophene, thermal treatment). | |
4. Conclusions
In this work, the NiCeY zeolites was prepared and used to adsorb sulfur compounds in diesel. The experimental results showed that NiCeY zeolites could effectively remove thiophene and benzothiophene, and the adsorption capacity for TP and BT reach 0.70 and 1.32 mmol g−1, respectively. The equilibrium adsorption on NiCeY zeolites was achieved for 60 min and the adsorption capacity of TP or BT increased with an increase of initial sulfur content and adsorption temperature. The equilibrium isotherms indicate that the adsorption can be described by the Langmuir model better than the Freundlich model. The kinetics analysis show that the adsorption processes can be fitted suitably by the pseudo-second order model with higher R2. The calculated activation energies for the adsorption of TP and BT on NiCeY zeolites are 1.98 and 13.73 kJ mol−1, suggesting the adsorption is mass transfer controlled. Besides, the Diffusion study indicates that the adsorption of TP and BT on NiCeY zeolites was controlled by two steps. The analysis of the thermodynamics indicate that the adsorption of TP and BT are spontaneous and exothermic.
References
- J. H. Shan, L. Chen and L. B. Sun, et al., Energy Fuels, 2011, 25(7), 3093–3099 CrossRef CAS
 .
. - C. Song, Catal. Today, 2003, 86(1), 211–263 CrossRef CAS
 .
. - J. Xiao, X. Wang and M. Fujii, et al., AIChE J., 2013, 59(5), 1441–1445 CrossRef CAS
 .
. - L. Wu, J. Xiao and Y. Wu, et al., Langmuir, 2014, 30(4), 1080–1088 CrossRef CAS PubMed
 .
. - EPA, US Environmental Protection Agency, April 2003, http://www.epa.gov/nonroad/f03008.htm#q3.
- H. Tang, Q. Li and Z. Song, et al., Catal. Commun., 2011, 12(12), 1079–1083 CrossRef CAS
 .
. - Y. Sun and R. Prins, Angew. Chem., Int. Ed., 2008, 47(44), 8478–8481 CrossRef CAS PubMed
 .
. - F. Tian, X. Yang and Y. Shi, et al., J. Nat. Gas Chem., 2012, 21(6), 647–652 CrossRef CAS
 .
. - V. C. Srivastava, RSC Adv., 2012, 2(3), 759–783 RSC
 .
. - C. Song and X. Ma, Appl. Catal., B, 2003, 41(1), 207–238 CrossRef CAS
 .
. - M. Breysse, G. Djega-Mariadassou and S. Pessayre, et al., Catal. Today, 2003, 84(3), 129–138 CrossRef CAS
 .
. - W. Zhu, J. Zhang and H. Li, et al., RSC Adv., 2012, 2(2), 658–664 RSC
 .
. - A. D. Bokare and W. Choi, J. Hazard. Mater., 2016, 304, 313–319 CrossRef CAS PubMed
 .
. - G. Mohebali and A. S. Ball, Int. Biodeterior. Biodegrad., 2016, 110, 163–180 CrossRef CAS
 .
. - A. Pathak, D. J. Kim and B. G. Kim, International Journal of Environmental, Chemical, Ecological, Geological and Geophysical Engineering, World Academy of Science, Engineering and Technology, 2016, vol. 8(8), pp. 618–621 Search PubMed
 .
. - X. Ma, L. Sun and C. Song, Catal. Today, 2002, 77(1), 107–116 CrossRef CAS
 .
. - A. J. Hernández-Maldonado and R. T. Yang, J. Am. Chem. Soc., 2004, 126(4), 992–993 CrossRef PubMed
 .
. - M. Muzic, K. Sertic-Bionda and Z. Gomzi, Chem. Eng. Technol., 2008, 31(3), 355–364 CrossRef CAS
 .
. - M. T. Timko, J. A. Wang and J. Burgess, et al., Fuel, 2016, 163, 223–231 CrossRef CAS
 .
. - G. I. Danmaliki and T. A. Saleh, J. Cleaner Prod., 2016, 117, 50–55 CrossRef CAS
 .
. - V. Selvavathi, V. Chidambaram and A. Meenakshisundaram, et al., Catal. Today, 2009, 141(1), 99–102 CrossRef CAS
 .
. - S. Velu, X. Ma and C. Song, et al., Energy Fuels, 2005, 19(3), 1116–1125 CrossRef CAS
 .
. - Y. Wang, R. T. Yang and J. M. Heinzel, Ind. Eng. Chem. Res., 2008, 48(1), 142–147 CrossRef
 .
. - A. Shams, A. M. Dehkordi and I. Goodarznia, Energy Fuels, 2007, 22(1), 570–575 CrossRef
 .
. - Y. Shi, W. Zhang and H. Zhang, et al., Fuel Process. Technol., 2013, 110, 24–32 CrossRef CAS
 .
. - H. Song, Y. Chang and X. Wan, et al., Ind. Eng. Chem. Res., 2014, 53(14), 5701–5708 CrossRef CAS
 .
. - J. Wang, F. Xu and W. Xie, et al., J. Hazard. Mater., 2009, 163(2), 538–543 CrossRef CAS PubMed
 .
. - I. Langmuir, J. Am. Chem. Soc., 1917, 3(9), 1848–1906 CrossRef
 .
. - H. M. F. Freundlich, J. Phys. Chem., 1906, 57, 385–471 CAS
 .
. - A. J. Hernández-Maldonado, F. H. Yang and G. Qi, et al., Appl. Catal., B, 2005, 56(1), 111–126 CrossRef
 .
. - H. Wang, L. Song and H. Jiang, et al., Fuel Process. Technol., 2009, 90(6), 835–838 CrossRef CAS
 .
. - S. Lagergren, PA Norstedt & soner, 1898, 24(4), 1–39.
- Y. S. Ho and G. McKay, Process Biochem., 1999, 34(5), 451–465 CrossRef CAS
 .
. - K. J. Laidler, J. Chem. Educ., 1984, 61(6), 494 CrossRef CAS
 .
. - R. Haque, F. T. Lindstrom and V. H. Freed, et al., Environ. Sci. Technol., 1968, 2(3), 207–211 CrossRef CAS
 .
. - J. Jiang and F. T. T. Ng, Adsorption, 2010, 16(6), 549–558 CrossRef CAS
 .
. - K. Banerjee, P. N. Cheremisinoff and S. L. Cheng, Water Res., 1997, 31(2), 249–261 CrossRef CAS
 .
. - W. J. Weber and J. C. Morris, Journal of the Sanitary Engineering Division, 1963, 89(2), 31–60 Search PubMed
 .
. - M. Montazerolghaem, A. Rahimi and F. Seyedeyn-Azad, Appl. Surf. Sci., 2010, 257(2), 603–609 CrossRef CAS
 .
. - D. Reichenberg, J. Am. Chem. Soc., 1953, 75(3), 589–597 CrossRef CAS
 .
. - N. Bektaş, B. A. Agım and S. Kara, J. Hazard. Mater., 2004, 112(1), 115–122 CrossRef PubMed
 .
. - Y. Shi, X. Zhang and G. Liu, ACS Sustainable Chem. Eng., 2015, 3(9), 2237–2246 CrossRef CAS
 .
. - C. Mariin-Rosas, L. F. Ramiírez-Verduzco and F. R. Murrieta-Guevara, et al., Ind. Eng. Chem. Res., 2010, 49(9), 4372–4376 CrossRef
 .
. - A. J. Hernandez-Maldonado and R. T. Yang, Ind. Eng. Chem. Res., 2004, 43(4), 1081–1089 CrossRef CAS
 .
. - L. Lin, Y. Zhang and H. Zhang, et al., J. Colloid Interface Sci., 2011, 360(2), 753–759 CrossRef CAS PubMed
 .
. - B. S. Liu, D. F. Xu and J. X. Chu, et al., Energy & fuels, 2007, 21(1), 250–255 CrossRef CAS
 .
. - Y. Shi, G. Liu and X. Zhang, Ind. Eng. Chem. Res., 2017, 56, 2557–2564 CrossRef CAS
 .
.
Footnote |
| † The two authors contributed equally to this paper. |
|
| This journal is © The Royal Society of Chemistry 2017 |
Click here to see how this site uses Cookies. View our privacy policy here.  Open Access Article
 *
*
![[thin space (1/6-em)]](https://www.rsc.org/images/entities/char_2009.gif) :
:![[thin space (1/6-em)]](https://www.rsc.org/images/entities/char_2009.gif) 1. After ion exchange, the obtained NiY zeolites was filtered, washed thoroughly with distilled water to remove the residuary Ni2+. The filtered cake was then dried at 110 °C for 5 h and calcined at 500 °C for 4 h. Both the obtained NiY and 0.1 mol L−1 Ce(NO3)3 aqueous solution were added to three-neck flask, and kept at 50 °C for 4 h. After filtering, washing, drying at 110 °C for 5 h, the zeolite was calcined at 500 °C for 4 h and we get the NiCeY zeolites. The color of the zeolites NiCeY changed from white to yellow after calcination, suggesting the oxidation of Ce3+ to Ce4+.
1. After ion exchange, the obtained NiY zeolites was filtered, washed thoroughly with distilled water to remove the residuary Ni2+. The filtered cake was then dried at 110 °C for 5 h and calcined at 500 °C for 4 h. Both the obtained NiY and 0.1 mol L−1 Ce(NO3)3 aqueous solution were added to three-neck flask, and kept at 50 °C for 4 h. After filtering, washing, drying at 110 °C for 5 h, the zeolite was calcined at 500 °C for 4 h and we get the NiCeY zeolites. The color of the zeolites NiCeY changed from white to yellow after calcination, suggesting the oxidation of Ce3+ to Ce4+.


![[thin space (1/6-em)]](https://www.rsc.org/images/entities/char_2009.gif) k1 to 1/T is applied to calculate Ea based on the data shown in Table 4. Typically, the adsorption desulfurization process can be regarded as mass transfer control if the obtained activation energy is less than 21 kJ mol.35 The activation energy 1.98 and 13.73 kJ mol−1 calculated lower than 21 kJ mol−1 for the adsorption of TP and BT on NiCeY zeolites indicate that the adsorption process is mass transfer controlled. The similar results can be found in ref. 36 and 37.
k1 to 1/T is applied to calculate Ea based on the data shown in Table 4. Typically, the adsorption desulfurization process can be regarded as mass transfer control if the obtained activation energy is less than 21 kJ mol.35 The activation energy 1.98 and 13.73 kJ mol−1 calculated lower than 21 kJ mol−1 for the adsorption of TP and BT on NiCeY zeolites indicate that the adsorption process is mass transfer controlled. The similar results can be found in ref. 36 and 37.![[thin space (1/6-em)]](https://www.rsc.org/images/entities/char_2009.gif) ln
ln![[thin space (1/6-em)]](https://www.rsc.org/images/entities/char_2009.gif) Kd
Kd

![[thin space (1/6-em)]](https://www.rsc.org/images/entities/char_2009.gif) Kd against 1/Tk (Fig. 10). The calculated parameters are listed in Table 6. The negative value of Gibbs free energy change (ΔG < 0) indicates that the adsorption of either TP or BT on NiCeY zeolites is a spontaneous process. The value of ΔG becomes more negative with temperature increase. This indicates that the adsorption process is favoured with the increase of temperature. The negative value of ΔH manifest that the adsorption of TP or BT was exothermic and the positive value of ΔS shows the increase of freedom at liquid/solid interface during the adsorption process.
Kd against 1/Tk (Fig. 10). The calculated parameters are listed in Table 6. The negative value of Gibbs free energy change (ΔG < 0) indicates that the adsorption of either TP or BT on NiCeY zeolites is a spontaneous process. The value of ΔG becomes more negative with temperature increase. This indicates that the adsorption process is favoured with the increase of temperature. The negative value of ΔH manifest that the adsorption of TP or BT was exothermic and the positive value of ΔS shows the increase of freedom at liquid/solid interface during the adsorption process..
.
.
.
.
.
.
.
.
.
.
.
.
.
.
.
.
.
.
.
.
.
.
.
.
.
.
.
.
.
.
.
.
.
.
.
.
.
.
.
.
.
.
.
.


