
 Open Access Article
 This Open Access Article is licensed under a Creative Commons Attribution-Non Commercial 3.0 Unported Licence
Specific pH effect for selective colorimetric assay of glutathione using anti-aggregation of label-free gold nanoparticles†
Jian-Fang Li,
Peng-Cheng Huang and
Fang-Ying Wu *
*
College of Chemistry, Nanchang University, Nanchang 330031, China. E-mail: fywu@ncu.edu.cn; Tel: +86 79183969882
First published on 28th February 2017
Abstract
An operationally simple colorimetric method for measuring glutathione (GSH) concentration was developed using anti-aggregation of gold nanoparticles (AuNPs) in this work. At a pH of 5.8, cysteine (Cys) could rapidly induce the aggregation of AuNPs, thereby resulting in color change and AuNPs absorbance ratio (A650 nm/A520 nm) change. However, the added glutathione (GSH) can cause the anti-aggregation process to occur. This method was based on the regulation of pH, which on one hand can selectively detect GSH over Cys by the process of anti-aggregation of AuNPs and on the other hand can distinguish GSH from homocysteine (Hcys), and cystine (Cye) through specific selectivity. Under optical conditions, the detection of GSH can be finished within 5 min. The concentration range of the probe is 0.1–1.0 μM and the limit of detection (LOD) can be reached to 20.3 nM.
Introduction
Compounds with thiol (–SH) functionality are very important as low molecular weight aliphatic thiols containing amino acids (Cys, Cye and Hcys) and peptides (GSH) play pivotal roles in biological systems. For example, Cys deficiency is associated with many syndromes such as slow growth in children, hair depigmentation, edema, lethargy, liver damage, loss of muscle and fat, skin lesions, and weakness.1 On the other hand, an elevated plasma Hcys level is a strong, independent risk factor for the development of dementia and Alzheimer's disease. It also seems to be a particularly strong predictor of cardiovascular mortality.2,3 Theoretically, sequestration of Cye in the lysosomes, a consequence of defective cystinosin, may result in cytosolic deficit in Cys, which is the primary limiting factor for the synthesis of the main intracellular antioxidant glutathione (GSH).4 As the most abundant nonprotein thiol, GSH has multiple functions within cells: detoxification of free radicals and peroxides, regulation of cell growth and protein function, and maintenance of immune function.5 Individuals infected with human immune deficiency virus (HIV) have a decrease of GSH in plasma which may potentiate HIV replication and accelerate disease progression. Moreover, GSH deficiency contributes to an overall depression of immune functions.6 Therefore, designing an assay to detect and differentiate it from other thiol compounds has plenty of significance. GSH exists in both reduced and oxidized states, while the majority (95%) of cellular glutathione exists in the reduced form.7,8 Thus the sensing of reduced GSH over other compounds with thiols (Cys, Hcy, and Cye) is focused in this study.In recent decades, a host of detection approaches are utilized to monitor or quantify the variations of GSH in previous literatures, involving flow injection analysis,9 high performance liquid chromatography (HPLC),10 surface-enhanced Raman scattering (SERS),11 electrogenerated chemiluminescence sensor (ECL),12 electrochemical,13 mass spectrometry (MS),14 liquid chromatography followed by tandem mass spectrometry (LC-MS/MS),15 nuclear magnetic resonance (NMR),16 fluorescence spectroscopy,17 and colorimetry,18–21 which could quantitatively detect and identify thiols but with drawbacks of complicated manipulations and low selectivity.
AuNPs exhibit a large extinction coefficient due to localized surface plasmon resonance (LSPR), which is the origin of the color of gold colloids.22,23 Because LSPR is highly sensitive to the interparticle distance, gold colloids often change color in the presence of certain analytes via analyte-induced aggregation or disaggregation (dispersion), enabling fast and convenient colorimetric assays for the measurement of the analyte concentration. Thus, among all existing and emerging materials, AuNPs remain one of the best candidates for biochemical assays.
However, due to the similar structures and activities of Cys, Hcy, Cye and GSH (Fig. S1†), many developed probes only can be used to detect GSH without discrimination from other biothiols and the determination of GSH has been a focus and challenge for the scientific communities.24–26 A feasible approach that enables GSH evaluation with ease and straightforward readout from other thiol compounds is thus desirable. Herein, we report a remarkably simple but versatile probe (Scheme 1) that can be used for detection of GSH over Cys/Hcy/Cye. This probe shows quite exceptional properties. First, it exhibits a rapid response (within a few minutes) with highly selective and sensitive detection for GSH over Cys/Hcy/Cye due to the pH regulation. What's more, the system itself can distinguish GSH from Cys since Cys plays the part of aggregation reagent and GSH plays the anti-aggregation reagent. Second, it offers an apparent colorimetric signal which can be seen by naked eyes. And third, it is operable in biological samples like human serum and human urine samples.
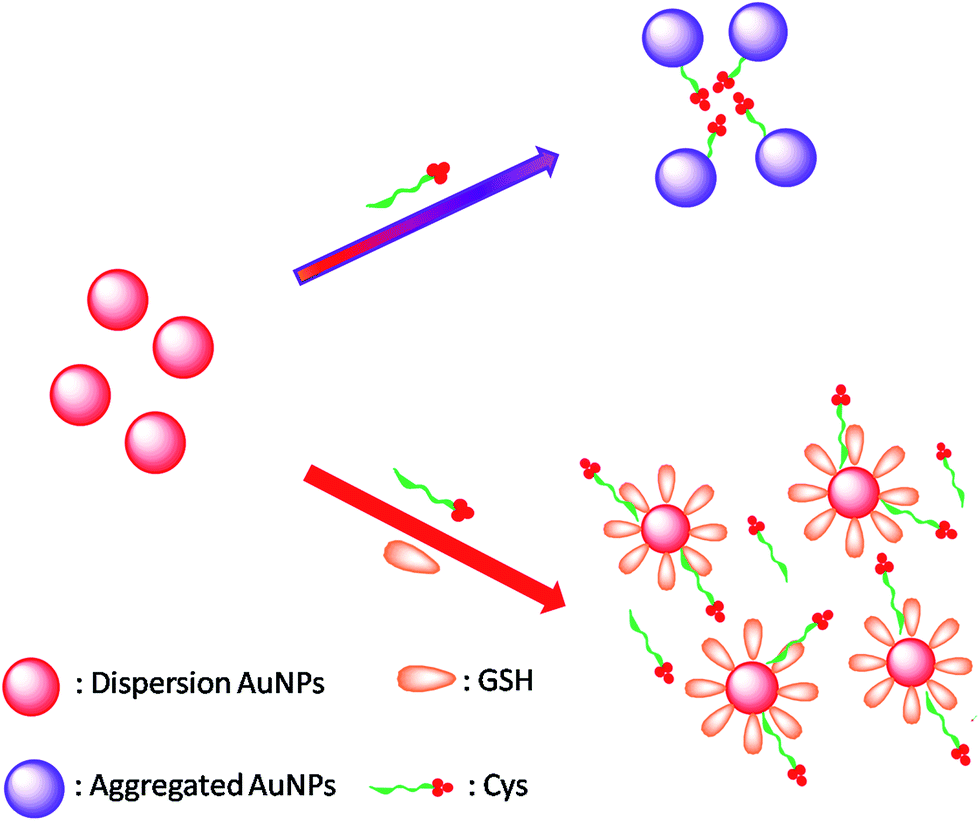 | ||
| Scheme 1 Schematic representation of GSH-induced anti-aggregation of AuNPs with the use of Cys as aggregation agent. | ||
Experimental
Human serum and human urine sample collection
Human serum and human urine samples were obtained from Nanchang University Hospital from healthy donors. And the preparations of the two samples were shown in ESM. The institutional committee(s) of College of Chemistry of Nanchang University has approved the experiments. The statement that informed consent was obtained has also been obtained. Ethical approval for the study was obtained from the Ethics Committee of Nanchang University Hospital prior to the collection and analysis of human serum and human urine samples. Our all experiments were performed in compliance with relevant laws or guidelines.Chemicals and apparatus
Hydrogen tetrachloroaurate hydrate (HAuCl4·4H2O) was bought from Sinopharm Chemical Reagent Co. Ltd. (Shanghai, China). Amino acids including alanine (Ala), arginine (Arg), asparagine (Asn), aspartic acid (Asp), cystine (Cye), cysteine (Cys), glutamic acid (Glu), glutamine (Gln), glutathione (GSH), glycine (Gly), homocysteine (Hcys), histidine (His), isoleucine (Ile), leucine (Leu), lysine (Lys), methionine (Met), phenylalanine (Phe), proline (Pro), serine (Ser), threonine (Thr), tyrosine (Tyr), tryptophan (Trp), and valine (Val) were purchased from Shanghai Jingchun Technology Co. Ltd. (Shanghai, China). KCl, NaCl, and NaH2PO4 were purchased from Shanghai Qingxi Technology Co. Ltd. (Shanghai, China). All the reagents were of analytical grade (99.0%) and used without purification. All aqueous solutions were prepared using ultrapure water from a Milli-Q system.UV-vis absorption spectra were recorded using UV-2550 spectrophotometer (Shimadzu, Kyoto, Japan) with a 1.0 cm quartz cell at 25 °C, which is the room temperature. Transmission electron microscopy (TEM) was carried out with a JEM-2100 transmission electron microscope (JEOL Ltd. Japan). The samples were prepared by drop-coating the AuNPs solution onto the carbon-coated copper grid and were loaded onto a specimen holder for the purpose of TEM. The data of dynamic light scattering (DLS) were obtained on NPA152 nanoparticle size analyzer (MicrotracInc, USA).
Preparation of colloidal AuNPs
All glasswares were cleaned in prepared aqua regia (3![[thin space (1/6-em)]](https://www.rsc.org/images/entities/char_2009.gif) :1; HCl/HNO3) and washed thoroughly in Milli-Q-purified distilled water, then dried in the dry oven. AuNPs was prepared by the trisodium citrate reduction method as previous literature.27 A standard procedure for the preparation of AuNPs is summarized as follows: trisodiumcitrate (10.0 mL, 38.8 mM) was rapidly added to a boiling solution of HAuCl4 (10.3 mL, 4.0 g L−1). The concentration and size of the prepared AuNPs was 15.0 nM and 13 nm as determined by UV-visible spectrometer and TLC-CL method, respectively.28,29 The color changed from pale yellow to purple in 5 min, then to dark red, and to wine red in the end. After about 30 min, the heating was stopped. The solution was stirred continuously about 15 min until it cooled to room temperature. Finally, the cooled solution was diluted to 100 mL with water and stored in the refrigerator at 4 °C for further use.
:1; HCl/HNO3) and washed thoroughly in Milli-Q-purified distilled water, then dried in the dry oven. AuNPs was prepared by the trisodium citrate reduction method as previous literature.27 A standard procedure for the preparation of AuNPs is summarized as follows: trisodiumcitrate (10.0 mL, 38.8 mM) was rapidly added to a boiling solution of HAuCl4 (10.3 mL, 4.0 g L−1). The concentration and size of the prepared AuNPs was 15.0 nM and 13 nm as determined by UV-visible spectrometer and TLC-CL method, respectively.28,29 The color changed from pale yellow to purple in 5 min, then to dark red, and to wine red in the end. After about 30 min, the heating was stopped. The solution was stirred continuously about 15 min until it cooled to room temperature. Finally, the cooled solution was diluted to 100 mL with water and stored in the refrigerator at 4 °C for further use.
Colorimetric assay based on anti-aggregation of AuNPs
For the detection of GSH, different concentrations of GSH were mixed well with Cys in 1650 μL of PBS buffer solution (NaH2PO4–Na2HPO4) and then the Cys–GSH solution was mixed with 330 μL of AuNPs and incubated for 5 min. The total volume of the solution was 2.0 mL and the final concentration of AuNPs was 2.5 nM, Cys was 4.0 μM. Photographs and UV-vis spectra were taken after Cys–GSH was added to the AuNPs dispersion for 5 min. And finally the concentration of GSH was quantified by A650 nm/A520 nm (ratio of the absorbance value at 650 nm to that at 520 nm in the UV-vis spectra).Results and discussion
The availability of the system
When the AuNPs are well dispersed in solution, the colloid exhibit wine red color with a strong absorption peak at 520 nm and an extremely high extinction coefficients.30 However, the color changes from red to purple and a red shift of surface plasmon absorption would occur after aggregation of the AuNPs.31 And the addition of GSH can efficiently prevent the aggregation of AuNPs. As clearly shown in Fig. 1, the label free AuNPs as blank sample were in dispersed state (a), AuNPs became aggregated (b) in the presence of only Cys, and AuNPs were dispersed when added GSH (c).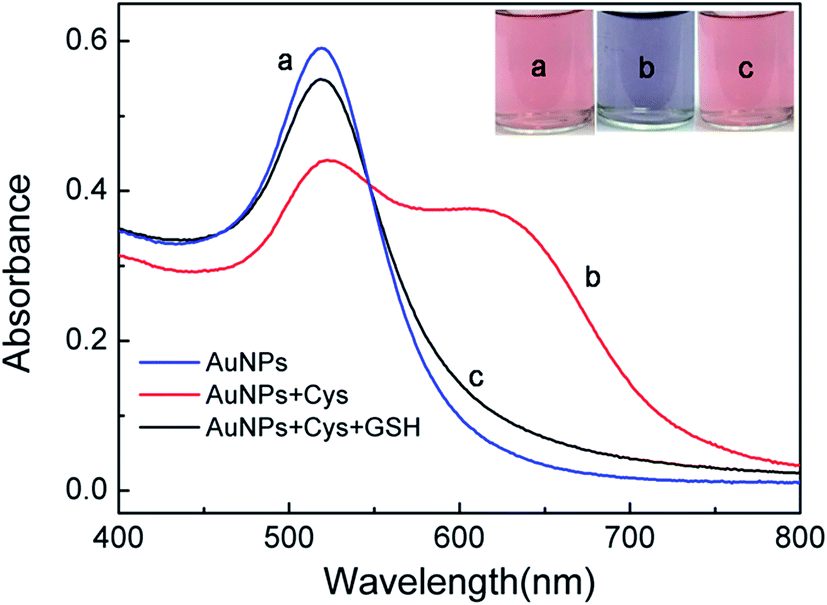 | ||
| Fig. 1 UV-vis absorption spectra and colors of (a) AuNPs, (b) AuNPs in the presence of 4.0 μM Cys, (c) AuNPs in the presence of 4.0 μM Cys and 1.0 μM GSH. | ||
Characterization of AuNPs
Cys and GSH added AuNP solutions were further investigated using TEM and DLS. As can be seen from the TEM images for citrate capped AuNPs, AuNPs were well dispersed on the TEM grid (Fig. 2a). On the other hand, large aggregates were observed for Cys-added solution (Fig. 2b). And AuNPs remained dispersed with the addition of Cys and GSH (Fig. 2c).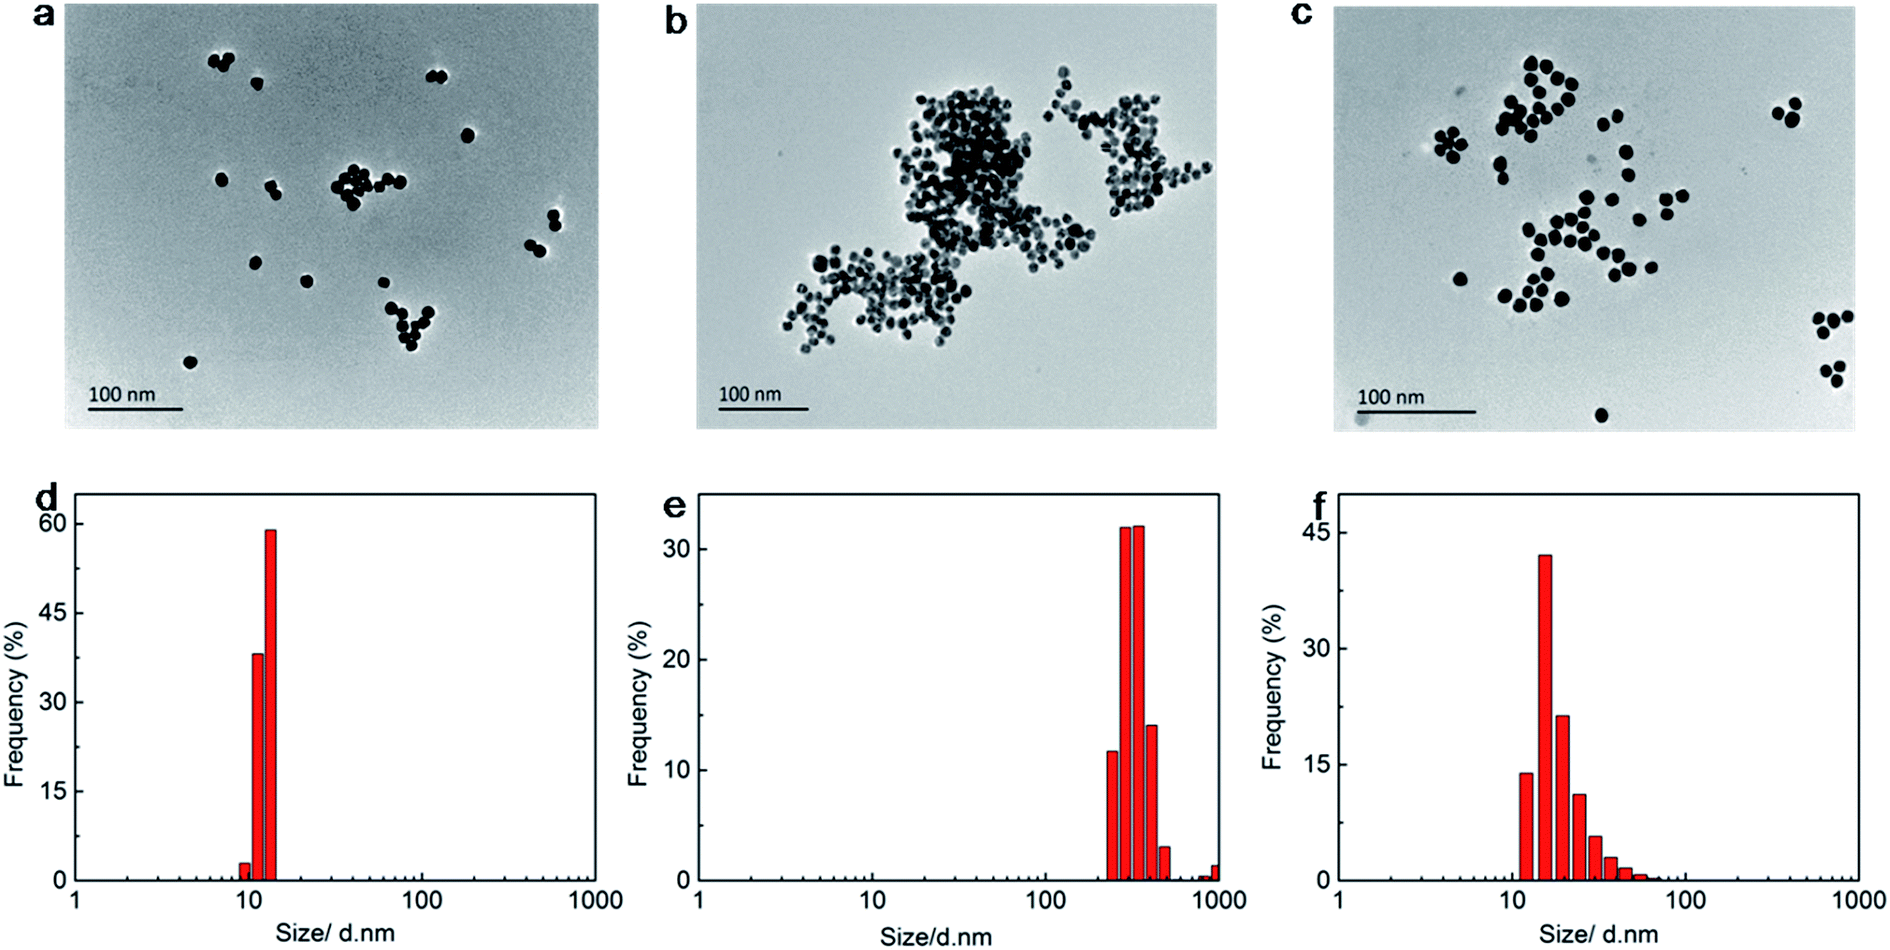 | ||
| Fig. 2 TEM images of (a) AuNPs, (b) in the presence of 4.0 μM Cys, (c) in the presence of 4.0 μM Cys and 1.0 μM GSH; histograms of intensity contribution versus diameter of (d) AuNPs only, (e) in the presence of 4.0 μM Cys, (f) in the presence of 4.0 μM Cys and 1.0 μM GSH. | ||
DLS images of the citrate-stabilized AuNPs at different conditions demonstrated the influence of Cys and GSH on the stability of the AuNPs. The AuNPs without Cys and GSH is well dispersed (Fig. 2d) with a size distribution around 13 nm, which is used as a control. The AuNPs incubated with 4.0 μM of Cys aggregate (Fig. 2e) with a bigger size compared with the control. However, further introduction of GSH may inhibit the aggregation to some extent (Fig. 2f).
Mechanism of the assay
Cysteine and glutathione induced aggregation of AuNPs by different mechanisms, the first by interparticle zwitterionic interaction and the second by interparticle hydrogen bonding.32 In the Hcys-mediated assembly of AuNPs, the first step involves the binding of Hcys via its thiol group to the Au surface. The second step involves a head-to-head zwitterion-type electrostatic interaction between amino acids groups of Hcys attached to AuNPs.33 Adsorption of the Cys in solution on AuNPs induces aggregation, while Cye does not, although it dissociated into two cysteinate moieties upon adsorption on the AuNPs. Cys produces a denser layer than Cye34 and the surface coverage is lower for Cye adsorption than for Cys. Calculations35,36 indicate that at lower adsorbate density, the amino nitrogen interacts with the surface more easily. Altering the pH, however, induced immediate aggregation by changing the charge state of the carboxylic groups, proving that the behavior is not simply a result of lower density. Thus, both the lower adsorbate density and different charge states contribute to preventing aggregation.The ionic states of thiol compounds at various pH values, based on published pKa values.37–39 The pH values of the resulting solutions were 5.8 ± 0.1 for Cys/AuNPs.31 For GSH, the pKa of GSH can be slightly shifted to a higher value in the presence of AuNPs40–42 and the color of the solution changed from red to blue. AuNPs aggregated instantly and the solution has a final pH of 3.7.43 The GSH-mediated assembly is inhibited at high pH in the solution so when the pH was above 4.5, the assembly was hindered or not favored. And the solution of the as-synthesized nanoparticles and Hcys was allowed to react when pH is 6.32.35 The pH of Hcys at 5.8 can also induce the aggregation of AuNPs, however, it can exert much smaller influence on the aggregation than Cys. As to the bithiol Cye, the lower adsorbate density and different charge state contribute to preventing aggregation, only when modifying the pH to 1.5, the surface species become cationic (neutral COOH and protonated NH3+), and aggregation of Cye/AuNPs occurs immediately by interparticle hydrogen bonding. Thus, we choose Cys as the aggregation reagent. As to GSH, the possibility of steric hindrance from the glutamate moiety could have played an important role in determining the nature of the interparticle interaction43 so that the GSH can prefer to the AuNPs and exhibits the anti-aggregation of AuNPs and the relative ratio between GSH and Cys determined the aggregation degree of AuNPs. As we can see, the regulation of pH can decide whether the AuNPs aggregated or not. Therefore, the determination of GSH is established based on above principles.
Optimization of the responsive conditions
The pH value of the AuNP dispersion, the concentration of AuNPs, the concentration of Cys, time of the system and the influence of salt were further optimized according to the sensing effect of our proposed detection system towards GSH. A650 nm/A520 nm was used to quantify the concentration of GSH.Effect of pH
The pH value for the colorimetric detection of GSH plays a key role and was optimized in our assay in the first place. Cys leads to the aggregation of AuNPs at the pH of 5.8, however, other kinds of thiol compounds cannot cause the phenomenon at the same pH, which on the other hand reflects the high selectivity of the assay (Fig. 3).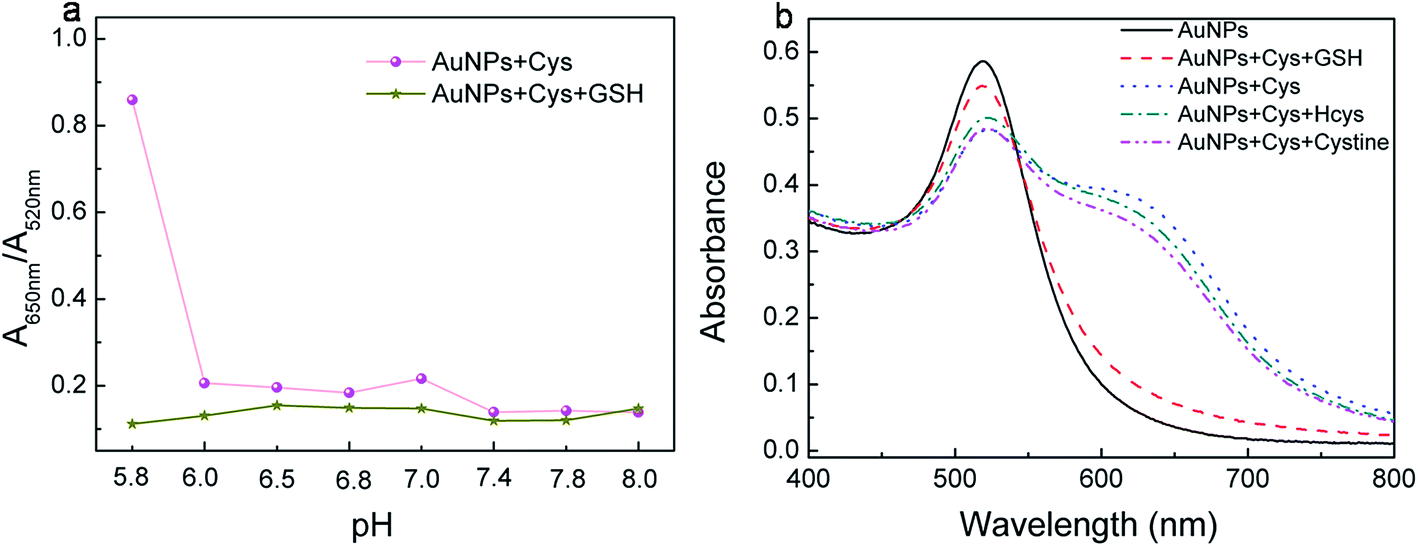 | ||
| Fig. 3 (a) The influence of different pH to Cys; (b) the response of Cys, Cye, Hcys and GSH to AuNPs at the pH 5.8. | ||
Effects of the gold nanoparticle concentrations, Cys concentration, time and NaCl
To determine how the gold nanocolloid particle concentration affects the equilibrium, different particle concentrations of AuNPs solutions were prepared and used for detecting GSH. The size of the AuNPs prepared in this study was approximately 13 nm with the extinction maximum at 520 nm. The particle concentration can be estimated as 15.0 nM.43–45 The absorbance ratio values at 520 and 650 nm with different particle concentrations in the presence and absence of GSH were examined, and the results are plotted in Fig. S2a.† Because the presence of GSH cannot induce the anti-aggregation of AuNPs in a low gold nanocolloid particle concentration (<2.5 nM), the absorbance ratio values showed small difference between the AuNPs solutions with and without GSH. Likewise, the aggregation of gold nanocolloids tended to be insignificant as the particle concentration of AuNPs increased to 15.0 nM, because the aggregation agent became relatively limited under this condition. And we picked up the concentration 2.5 nM as the optimized concentration in the following experiments. As shown in Fig. S2b,† when the concentration of Cys arrives at 4.0 μM, both the aggregation and the anti-aggregation of AuNPs presents the most obvious results. Thus, we choose the 4.0 μM as the optimum concentration in the following experiments. Fig. S2c† displayed the time-dependent changes of A650 nm/A520 nm in the absence and presence of GSH. It attained equilibrium during 3–10 min, however, considering the operation and measurement time-consuming, 5 min incubation time was chosen for further studies. As we all know, the concentration of salt can exert great effect to AuNPs, and when the salt concentration reaches to 3.0 mM then the AuNPs began to aggregate, which can also be seen in Fig. S2d.† However, the concentration is much far bigger than the GSH concentration we detected so that we consider the system has a great resistance of salt.The selectivity of the system
To investigate the selectivity of the sensor toward GSH over other compounds, including amino acids (Ala, Arg, Asn, Asp, Glu, Gln, Gly, His, Ile, Leu, Lys, Met, Phe, Pro, Val, Thr, Tyr, Trp, Ser), disulfide (Cye), analogous biothiols (Hcy), cations (K+, Na+, and NH4+) and anions (H2PO4−), the responses were recorded under the optimized experimental conditions. As shown in Fig. 4, these species gave absorbance ratios comparable to the blank sample, indicating they had no anti-aggregation effect on AuNPs induced by GSH. On the other hand, the concentration of the interferences was also investigated when existed with GSH (1000 folds: Ala, Asn, Gly, Ile, Leu, Phe, Pro, Val, Thr, Ser, H2PO4−, 500 folds: Met, K+, Na+, Gln, 100 folds: Arg, Glu, His, Lys, Trp, 80 folds: Asp, 70 folds: Hcy, 50 folds: Tyr, Cye). As clearly seen in the above experiments, the assay presents a strong selectivity to other compounds especially for the thiol compounds under the modification of pH, which is also the advantage of system.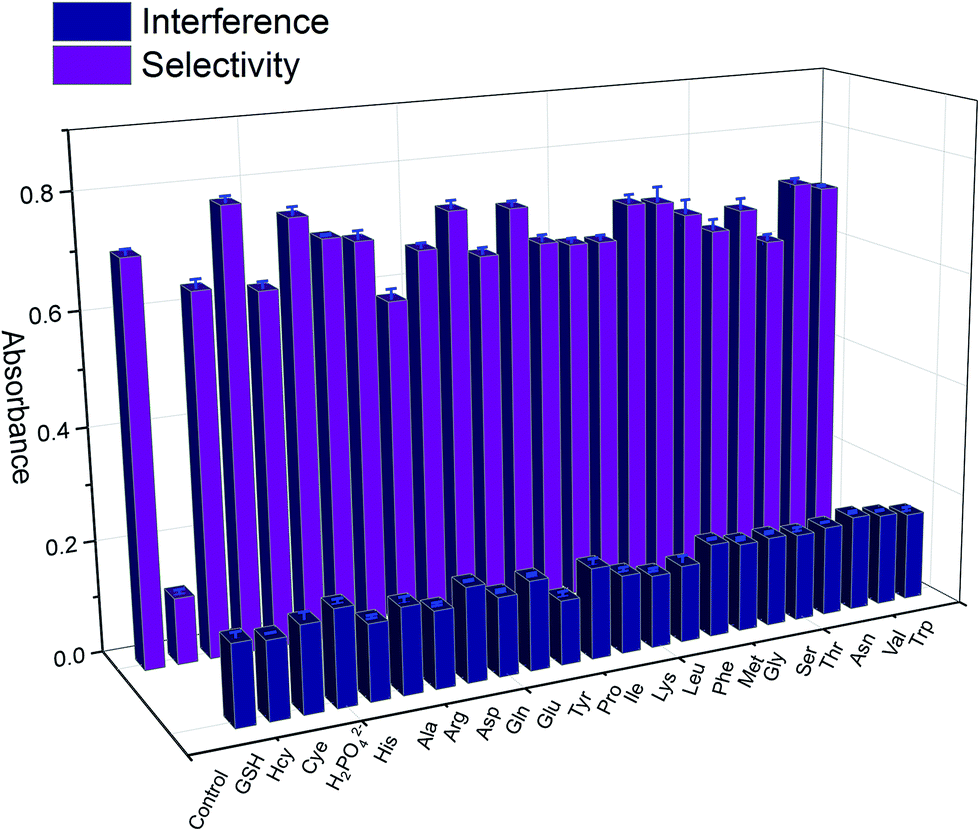 | ||
Fig. 4 The absorbance ratio A650 nm/A520 nm of Cys–AuNPs when different kinds of foreign ions and compounds was added alone ( ) and along with GSH 1.0 μM ( ) and along with GSH 1.0 μM ( ) in pH 5.8 PBS buffer solution. ) in pH 5.8 PBS buffer solution. | ||
The colorimetric detection of GSH of the assay
The sensitivity of the optimal sensing system towards the detection of GSH was determined by examining different concentrations of GSH. As shown in Fig. 5, the ratio A650 nm/A520 nm increased linearly over the GSH concentration ranging from 0.1 to 1.0 × 10⁻⁶ M. The detection limit was estimated to be 20.3 nM, which is defined by the equation LOD = 3S0/K, where S0 is the standard deviation of blank measurements (n = 10) and K is the slope of calibration line. And the LOD is lower or comparable to those of most sensors (Table 1). The calibration equation was: Y = 0.731 − 0.502X with the satisfactory correlation coefficient (R2 = 0.996), where Y referred to the absorbance ratio A650 nm/A520 nm and X was the concentration of GSH in 1.0 μM.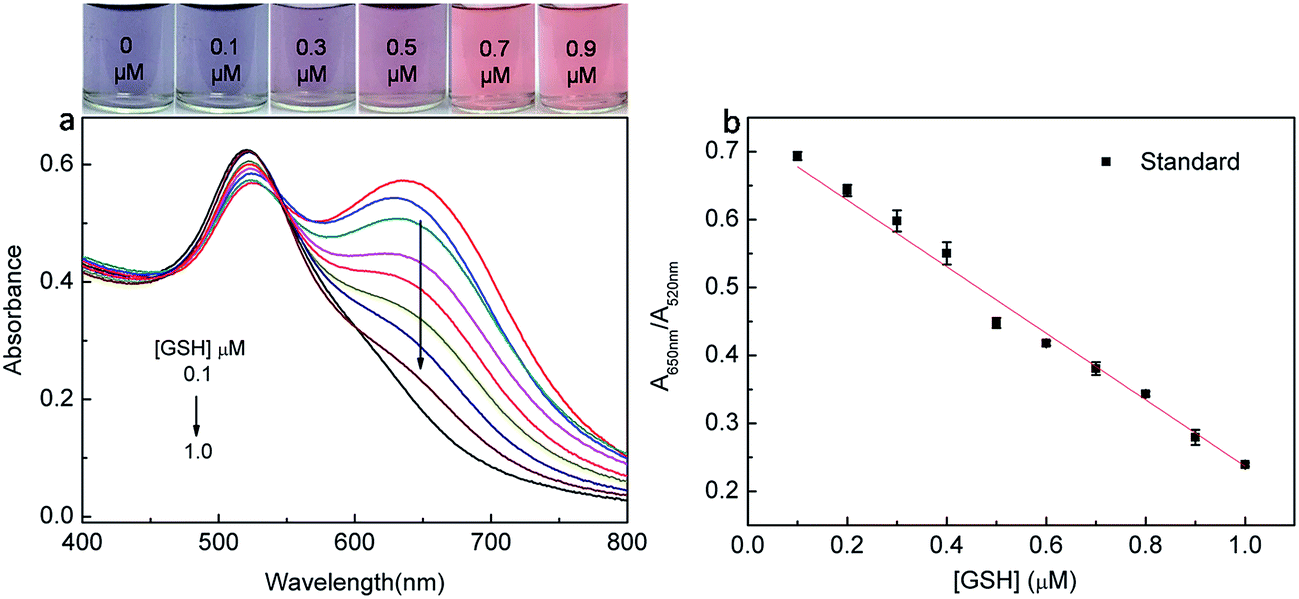 | ||
| Fig. 5 (a) Photographic images of the Cys–AuNPs formed in the presence of different concentrations of GSH (0, 0.1, 0.3, 0.5, 0.7, and 0.9 μM); UV-vis absorption spectra of the Cys–AuNPs generated in the presence of different concentrations of GSH (0, 0.1, 0.2, 0.3, 0.4, 0.5, 0.6, 0.7, 0.8, 0.9, and 1.0 μM); (b) the plot of A650 nm/A520 nm against the GSH concentrations. | ||
| Probe | Mode | Linear range | LOD | Remark | Ref. |
|---|---|---|---|---|---|
| a Piperazinebisdithiocarbamate.b Polyethyleneimine. | |||||
| Ppzdtca–AuNPs | Colorimetry | 8–250 nM | 8 nM | Difficult synthesis of ppzdtc time consuming | 18 |
| Arg–AuNPs | Colorimetry | 25–375 nM | 10.9 nM | Complicated operation | 46 |
| Inhibition of formation of AuNPs | Colorimetry | 0–300 μM | 65 μM | Strong response to Cys and Hcy | 20 |
| Quasi stabled AuNPs | Colorimetry | 0.5–1.25 μM | 500 nM | Bigger LOD | 19 |
| AuNC conjugated with water-soluble polymer | Colorimetry | 0–6 μM | 29 nM | Strong response to Cys | 47 |
| g-C3N4–Ag+ | Fluorescence | 0.02–100 μM | 9.6 nM | Strong response to Cys and Hcy time consuming | 48 |
| PEIb-capped AgNCs | Fluorescence | 0.5–6 μM | 380 nM | Strong response to Cys and Hcy | 49 |
| AuNCs–Hg2+ | Fluorescence | 0–250 μM | 9.4 nM | Strong response to Cys and Hcy | 50 |
| Cys–AuNPs | Colorimetry | 0.1–1.0 μM | 20.3 nM | High selectivity and low LOD | Our assay |
Real sample tests
To evaluate the application of the presented method in real samples, we utilized it to sense GSH in human serum and human urine samples. The preparations of the two samples were shown in ESM. None of them contained GSH, so they were spiked with three levels of GSH, 0.2 μM, 0.4 μM, 0.6 μM for human serum and 0.3 μM, 0.5 μM, 0.7 μM for human urine, respectively (Fig. S3†). Satisfying recoveries were obtained in the two different real samples, 95.0–110% for human serum samples and 90.0–103% for human urine samples (Table S1†). The experimental results clearly demonstrated that this colorimetric assay provided a potential application for the detection of GSH in clinical samples.Conclusion
In this work, combining the unique property of AuNPs and special interaction of Cys with AuNPs at the pH of 5.8, which is based on anti-aggregation mechanism of AuNPs, has been developed for detecting GSH. One of the significant features of the present system is its ability to detect GSH by monitoring the color change with naked eye. Furthermore, our protocol provides a rapid response (within a few minutes) with highly selective and sensitive detection for GSH over other α-amino acids and some other thiol compounds, including Cys, Cye, Hcys due to the pH regulation. The system itself can distinguish GSH from Cys since Cys plays the part of aggregation reagent and GSH plays the anti-aggregation reagent. Compared with the previously reported colorimetric detection methods, our approach is simple and it has reasonable sensitivity and selectivity.Acknowledgements
This work was financially supported by Natural Science Foundation of China (no. 21365014, 21505067).References
- S. Shahrokhian, Anal. Chem., 2001, 73, 5972 CrossRef CAS PubMed.
- H. Refsum, P. M. Ueland, O. Nygard and S. E. Vollset, Annu. Rev. Med., 1998, 49, 31 CrossRef CAS PubMed.
- S. Seshadri, A. Beiser, J. Selhub, P. F. Jacques, I. H. Rosenberg, R. B. D'Agostino, P. W. F. Wilson and P. A. Wolf, N. Engl. J. Med., 2002, 346, 476 CrossRef CAS PubMed.
- R. Sumayao, B. McEvoy, P. Newsholme and T. McMorrow, J. Physiol., 2016, 594, 3353 CrossRef CAS PubMed.
- W. A. Kleinman and J. P. Richie, Biochem. Pharmacol., 2000, 60, 19 CrossRef CAS PubMed.
- F. J. T. Staal, S. W. Ela, M. Roederer, M. T. Anderson and L. A. Herzenberg, Lancet, 1992, 339, 909 CrossRef CAS.
- R. E. Hansen, D. Roth and J. R. Winther, Proc. Natl. Acad. Sci. U. S. A., 2009, 106, 422 CrossRef CAS PubMed.
- A. Saha and N. R. Jana, Anal. Chem., 2013, 85, 9221 CrossRef CAS PubMed.
- A. Waseem, M. Yaqoob and A. Nabi, Chem. Res. Chin. Univ., 2010, 26, 893 CAS.
- L. Ma, H. Shi, K. Lian, Y. F. Diao, Y. Chen, C. L. Ma and W. J. Kang, Food Chem., 2017, 218, 422 CrossRef CAS PubMed.
- W. K. Wang, L. M. Zhang, L. Li and Y. Tian, Anal. Chem., 2016, 88, 9518 CrossRef CAS PubMed.
- W. Y. Gao, Z. Y. Liu, L. M. Qi, J. P. Lai, S. A. Kitte and G. B. Xu, Anal. Chem., 2016, 88, 7654 CrossRef CAS PubMed.
- Y. Lv, L. L. Yang, X. X. Mao, M. J. Lu, J. Zhao and Y. M. Yin, Biosens. Bioelectron., 2016, 85, 664 CrossRef CAS PubMed.
- P. Liu, Y. Q. Huang, W. J. Cai, B. F. Yuan and Y. Q. Feng, Anal. Chem., 2014, 86, 9765 CrossRef CAS PubMed.
- D. Carroll, D. Howard, H. N. Zhu, C. M. Paumi, M. Vore, S. Bondada, Y. Liang, C. Wang and D. K. St Clair, Free Radical Biol. Med., 2016, 97, 85 CrossRef CAS PubMed.
- L. G. Kaiser, M. Marjanska, G. B. Matson, I. Iltis, S. D. Bush, B. J. Soher, S. Mueller and K. Young, J. Magn. Reson., 2010, 202, 259 CrossRef CAS PubMed.
- Y. Y. Huang, J. Zhou, H. Feng, J. Y. Zheng, H. M. Ma, W. D. Liu, C. Tang, H. Ao, M. Z. Zhao and Z. S. Qian, Biosens. Bioelectron., 2016, 86, 748 CrossRef CAS PubMed.
- Y. Li, P. Wu, H. Xu, H. Zhang and X. H. Zhong, Analyst, 2011, 136, 196 RSC.
- B. Hu, X. Cao and P. Zhang, New J. Chem., 2013, 37, 3853 RSC.
- Y. L. Jung, J. H. Park, M. Kim and H. G. Park, Nanotechnology, 2016, 27, 055501 CrossRef PubMed.
- Y. Zhou, Y. Xie, N. X. Wang, Z. Wang and X. Y. Jiang, Small, 2015, 11, 5510 CrossRef PubMed.
- P. K. Jain, X. Huang, I. H. E. Sayed and M. A. E. Sayed, Acc. Chem. Res., 2008, 41, 1578 CrossRef CAS PubMed.
- M. E. Stewart, C. R. Anderton, L. B. Thompson, J. Maria, S. K. Gray, J. A. Rogers and R. G. Nuzzo, Chem. Rev., 2008, 108, 494 CrossRef CAS PubMed.
- X. Chen, Y. Zhou, X. Peng and J. Yoon, Chem. Soc. Rev., 2010, 39, 2120 RSC.
- H. S. Jung, X. Chen, J. S. Kim and J. Yoon, Chem. Soc. Rev., 2013, 42, 6019 RSC.
- C. Yin, F. Huo, J. Zhang, R. M. Mánez, Y. Yang, H. Lv and S. Li, Chem. Soc. Rev., 2013, 42, 6032 RSC.
- I. E. Paul, A. Rajeshwari, T. C. Prathna, A. M. Raichur, N. Chandrasekaran and A. Mukherjee, Anal. Methods, 2015, 7, 1453 RSC.
- N. Yan, Z. L. Zhu, D. He, L. L. Jin, H. T. Zheng and S. H. Hu, Sci. Rep., 2016, 6, 24577 CrossRef CAS PubMed.
- H. S. Kim, Y. S. Seo, K. Kim, J. W. Han, Y. Park and S. Cho, Nanoscale Res. Lett., 2016, 11, 230 CrossRef PubMed.
- R. Jin, G. Wu, Z. Li, C. A. Mirkin and G. C. Schatz, J. Am. Chem. Soc., 2003, 125, 1643 CrossRef CAS PubMed.
- Z. Zhang, J. Zhang, T. Lou, D. Pan, L. Chen, C. Qu and Z. Chen, Analyst, 2012, 137, 400 RSC.
- R. G. Acres, V. Feyer, N. Tsud, E. Carlino and K. C. Prince, J. Phys. Chem. C, 2014, 118, 10481 CAS.
- I. I. S. Lim, W. Ip, E. Crew, P. N. Njoki, D. Mott, C. J. Zhong, Y. Pan and S. Q. Zhou, Langmuir, 2007, 23, 826 CrossRef CAS PubMed.
- G. Hager and A. G. Brolo, J. Electroanal. Chem., 2003, 550, 291 CrossRef.
- D. R. Felice, A. Selloni and E. Molinari, J. Phys. Chem. B, 2002, 107, 1151 CrossRef.
- I. L. Buimaga and C. Morari, J. Phys. Chem. C, 2013, 117, 20351 Search PubMed.
- A. Mocanu, I. Cernica, G. Tomoaia, L. D. Bobos and O. Horovitz, Colloids Surf., A, 2009, 338, 93 CrossRef CAS.
- A. Vallee, V. Humblot, C. M. Thivier and C. M. Pradier, Surf. Interface Anal., 2008, 40, 395 CrossRef CAS.
- T. R. Ralph, M. L. Hitchman, J. P. Millington and F. C. Walsh, J. Electroanal. Chem., 1994, 375, 1 CrossRef CAS.
- M. Li, X. Wu, Y. Wang, Y. Li, W. Zhu and T. James, Chem. Commun., 2014, 50, 1751 RSC.
- W. X. Zheng, M. M. Maye, F. L. Leibowitz and C. J. Zhong, Analyst, 2000, 125, 17 RSC.
- J. Luo, N. Kariuki, L. Han, M. M. Maye, L. W. Moussa and S. R. Kowaleski, J. Phys. Chem. B, 2002, 106, 9313 CrossRef CAS.
- I. I. S. Lim, D. Mott, W. Ip, P. N. Njoki, Y. Pan, S. Q. Zhou and C. J. Zhong, Langmuir, 2008, 24, 8857 CrossRef CAS PubMed.
- X. Liu, M. Atwater, J. Wang and Q. Huo, Colloids Surf., B, 2007, 58, 3 CrossRef CAS PubMed.
- D. D. Evanoff and G. Chumanov, J. Phys. Chem. B, 2004, 108, 13957 CrossRef CAS.
- Y. L. X. Yu, Y. Z. Y. Xie, N. X. Wang, Z. Wang and X. Y. Jiang, Small, 2015, 11, 5510 CrossRef PubMed.
- N. Uehara, K. Ookubo and T. Shimizu, Langmuir, 2010, 26, 6818 CrossRef CAS PubMed.
- Y. R. Tang, H. J. Song, Y. Y. Su and Y. Lv, Anal. Chem., 2013, 85, 11876 CrossRef CAS PubMed.
- N. Zhang, F. Qu, H. Q. Luo and N. B. Li, Biosens. Bioelectron., 2013, 42, 214 CrossRef CAS PubMed.
- K. S. Park, M. I. Kim, M. A. Woo and H. G. Park, Biosens. Bioelectron., 2013, 45, 65 CrossRef CAS PubMed.
Footnote |
| † Electronic supplementary information (ESI) available. See DOI: 10.1039/c7ra00399d |
| This journal is © The Royal Society of Chemistry 2017 |