DOI:
10.1039/C7RA00376E
(Paper)
RSC Adv., 2017,
7, 21352-21359
Halloysite clay nanotubes as effective nanocarriers for the adsorption and loading of vancomycin for sustained release
Received
10th January 2017
, Accepted 8th April 2017
First published on 18th April 2017
Abstract
Ensuring the adequate delivery of local antibiotic concentrations to infected bone is crucial. Accordingly, we developed a new and simple controlled release system with halloysite clay nanotubes (HNTs) as nanocarriers of vancomycin (Van), a potent antibiotic drug, for the simple preparation of a local drug delivery system. Noncytotoxic HNTs served as barriers against cell ingrowth for the delivery system. The preparation conditions of HNTs–Van were optimized. With the mass ratio of Van and HNTs controlled at 2![[thin space (1/6-em)]](https://www.rsc.org/images/entities/char_2009.gif) :
:![[thin space (1/6-em)]](https://www.rsc.org/images/entities/char_2009.gif) 1, HNTs–Van obtained the highest Van loading content under suitable preparation conditions. HNTs–Van allowed the effective and extended release of the drug over a period of 33 days, compared with only 1 day with the direct release of pristine Van. The feasibility of the highly effective local antibacterial activity of HNTs–Van in treating infections was confirmed through the Kirby–Bauer assay. This work suggests that HNTs are efficient for the local delivery of antibiotics in bacterial infection treatment.
1, HNTs–Van obtained the highest Van loading content under suitable preparation conditions. HNTs–Van allowed the effective and extended release of the drug over a period of 33 days, compared with only 1 day with the direct release of pristine Van. The feasibility of the highly effective local antibacterial activity of HNTs–Van in treating infections was confirmed through the Kirby–Bauer assay. This work suggests that HNTs are efficient for the local delivery of antibiotics in bacterial infection treatment.
Introduction
Bone and soft tissue infections, such as osteomyelitis or infected diabetic foot, are prolonged inflammatory diseases that are difficult to treat.1,2 Clinically, these infections are treated by surgically removing the necrotic portion of bone tissue, followed by antibiotic therapy.3 The treatment effect of traditional blood flow is relatively poor under these pathological conditions, and biofilm formation protects infecting bacteria against the action of systemic antibiotics.4 In addition, prolonged systemic antibiotic treatment can cause toxic side effects, such as cytotoxicity, ototoxicity, and nephrotoxicity.5 Moreover, subeffective antibiotic concentrations can lead to the development of microbial drug resistance. These shortcomings motivate the development of advanced therapies based on the local delivery of a drug that can provide a high antibiotic dosage to the problematic region. Local drug delivery systems are needed to achieve effective antibiotic levels and thus improve the treatment effect on bone and soft tissue infections. Such local drug delivery systems reduce not only the required doses with long-term effective antimicrobial concentration but also the risk of side effects compared with systemic administration. Drug carriers with excellent physical, chemical, and biological properties are important in the application of drug delivery systems. Various carriers, such as nanoparticles, organic molecules, and supramolecular assemblies, have been applied to construct delivery systems.6,7 Although these systems have been investigated as controlled drug release systems or potential drug delivery vehicles, they hold many critical drawbacks, such as poor biocompatibility and toxicity. Recent studies on antibiotic-delivering carriers for the local treatment of infections have concentrated on polymers and inorganic biominerals.8 These materials not only supply a high local drug concentration over a fixed amount of time but also release their entire antibiotic content. However, the preparation of a simple, effective, controlled release and low-toxicity drug delivery system remains a difficult but interesting task of current demand.
Halloysite, an alumosilicate tubular clay with an external diameter of 50 nm, an inner cavity of 15–50 nm, and a length of 500–1000 nm, is a natural biocompatible nanomaterial available in thousands of tons at a low price.9,10 As such, halloysite clay is a good candidate for nanoarchitectural composites.11 The material possesses a nanoscale organization with promising properties, such as high specific surface area, good biocompatibility, thermal stability, and affordability.12–14 Halloysite clay is especially used as a corrosion-resistant coating additive and fireproof material in materials science.15,16 It has an inner lumen with a tubular structure for the encasing and sustained release of macromolecules, including drugs, DNA, and proteins. Given their narrow lumen and chemically active external and internal surfaces, halloysite particles can be used as a cheap nanocontainer for the controlled release of active agents.11,17–19 Drugs can be loaded into halloysite nanotubes (HNTs) from saturated drug solutions or a melt of low-water-soluble drugs. HNT coating showed excellent biocompatibility and low cytotoxicity, which had been assessed for the application in cell cultures20 and animal tissues.21,22 Previous investigations23 confirmed that the viability of fibroblast cells is retained at high halloysite concentrations (up to 100 mg L−1). Compared with the toxic effects of carbon nanotubes, halloysite is considerably much more biosafe to fibroblast cells.24–26 These results illustrate that HNTs hold great potential as drug carriers due to its biosafety. In addition, HNTs enhance the stability and loadage of drugs.27–29
However, insufficient data are available about the use of HNTs as drug carriers and medicinal materials. Moreover, the design of drug release systems with halloysite as pore blockers remains a significant challenge. In this study, HNTs were applied as a one-component material, in which solid drugs were physically dispersed in solution. Vancomycin (Van) was loaded into the HNTs internal cavity with different mass ratios of Van and HNTs via sonicating and vacuuming as a drug release system designated as HNTs–Van. The drug release kinetics and antibacterial activity were studied over a period of up to 33 days. The antimicrobial effect of the released Van from HNTs–Van at different periods was also investigated in Staphylococcus aureus and Beta-hemolytic streptococcus.
Experimental
Materials
Vancomycin hydrochloride was obtained from VIANEX S.A. (Greece). High purity halloysiteclay nanotubes (HNTs) with the linear formula of Al2Si2O5(OH)4·2H2O were obtained from Sigma-Aldrich (USA). Hydrochloric acid (HCl), sodium chloride (NaCl), disodium hydrogen phosphate (Na2HPO4·12H2O), sodium dihydrogen phosphate (NaH2PO4·12H2O) and other chemical reagents were of analytical reagent grade and obtained from Sinopharm Chemical Reagent Co., Ltd. (Shanghai, China). All of the reagents were used without any further purification. TNF-α, IL-1 and IFN-γ level were determined using their respective ELISA kits which were obtained from Thermo Fisher Scientific (China) Co., Ltd. (Shanghai, China). The ELISA kits were tested according to the protocol. SD rats weighing about 200 g were obtained from Laboratory animal center of Fujian Medical University. This study was performed in strict accordance with the Ministry of Science and Technology of the People's Republic of China guidelines on the treatment of laboratory animals and was approved by the Animal Ethics Committees (AECs) of Fujian Medical University (Fuzhou, China). The Staphylococcus aureus (S. aureus) and Beta-hemolytic streptococcus (B. streptococcus) were provided from the microbiology laboratory of Fujian Medical University. All solutions were prepared with ultrapure water (Milli-Q).
Instruments
A vacuum drying oven DZF-6050 (Jinghong experimental equipment Co., Ltd, Shanghai, China) was used for discharging the air under negative pressure condition. UV-Vis absorption spectra were conducted on Shimadzu UV2600 spectrophotometer. Transmission electron microscopy (TEM) images were acquired using a JEOL JEM-2100 (JEOL, Japan) at an acceleration voltage of 200 kV. Scanning electron microscopy (SEM) images were obtained from S-4800 (Hitachi, Japan). The pH was determined and adjusted using a digital pH meter UltraBasic-7 (DENVER INSTRUMENT, USA). Zeta potentials of the nanoparticle were analysed using a Zetasizer Nano Z3000 (Particle Sizing Systems Ltd, USA). Heal Force Neofuge 18R (Shanghai, China) and Water-bathing Constant Temperature Vibrator SHA-B (Changzhou GuoHua electric appliance Co., Ltd) were used. Fourier Transform Infrared (FT-IR) spectra were recorded on a Bruker Vertex 70 spectrometer (Madison, USA). All things needed to sterilized were using by Portable stainless steel pressure steam sterilizer (Shanghai Shenan medical instrument factory).
In vitro cell cytotoxicity of HNTs
The MTT texting is one of the important biological test methods for checking the biocompatibility of a material. The in vitro cell cytotoxicity of HNTs had been investigated using HL-60 cell lines. Briefly, 180 μL of HL-60 cell lines which counted approximately 6000 cells per well was added into a flat bottomed 96-well plate, and then mixed with 20 μL different concentration of HNTs at 37 °C in a humidified atmosphere (95% air and 5% CO2). HNTs and HNTs–Van were added separately in three different rows around 100 mg mL−1 of the medium. Cell rows left untreated and treated with NaCl were used as positive control and negative control, respectively. After incubated for 24 h, 20 μL 5 mg mL−1 MTT was added into each well in the plate and incubated for 4 h in 37 °C and 5% CO2. After centrifuging at 4600 rpm for 8 min, remove the supernatant from every well. 100 μL DMSO was added to each well to extract and solubilize the formed azan crystal in 20 min. Finally, the absorption of the plate was tested at 570 nm wavelength. Each compound and control was operated in triplicate. The percentage of proliferation was calculated by the following formula: proliferation (%) = [(ODsample − ODcontrol)/ODcontrol] × 100.
In vivo immune toxicity of HNTs
The rats weighing about 200 g were divided into four groups: blank group (saline), low dose group (1.25 g kg−1 of HNTs), middle dose group (2.5 g kg−1 of HNTs) and high dose group (10 g kg−1 of HNTs). Every group was six rats, half male and half female. Gavage administration of different doses of HNTs was operated every other day and continued two months. After two month dose, three cytokines of TNF-α, IL-1 and IFN-γ from orbital venous blood were tested. Compared with the results of blank group, the possible immunological stress and immunosuppression were investigated through the measurement of TNF-α, IL-1 and IFN-γ from different dosage groups.
Optimization and preparation of HNTs–Van
The HNTs–Van was fabricated according to the following procedure. First, HNTs (20 mg) was dispersed in 5 mL of double distilled water for 10 min. Then different amount of Van were added into above solution to determine the highest tube content that could be doped, and the mass ratio of Van![[thin space (1/6-em)]](https://www.rsc.org/images/entities/char_2009.gif) :
:![[thin space (1/6-em)]](https://www.rsc.org/images/entities/char_2009.gif) HNTs is 1
HNTs is 1![[thin space (1/6-em)]](https://www.rsc.org/images/entities/char_2009.gif) :
:![[thin space (1/6-em)]](https://www.rsc.org/images/entities/char_2009.gif) 10, 1
10, 1![[thin space (1/6-em)]](https://www.rsc.org/images/entities/char_2009.gif) :
:![[thin space (1/6-em)]](https://www.rsc.org/images/entities/char_2009.gif) 8, 1
8, 1![[thin space (1/6-em)]](https://www.rsc.org/images/entities/char_2009.gif) :
:![[thin space (1/6-em)]](https://www.rsc.org/images/entities/char_2009.gif) 5, 1
5, 1![[thin space (1/6-em)]](https://www.rsc.org/images/entities/char_2009.gif) :
:![[thin space (1/6-em)]](https://www.rsc.org/images/entities/char_2009.gif) 2, 1
2, 1![[thin space (1/6-em)]](https://www.rsc.org/images/entities/char_2009.gif) :
:![[thin space (1/6-em)]](https://www.rsc.org/images/entities/char_2009.gif) 1, 1.5
1, 1.5![[thin space (1/6-em)]](https://www.rsc.org/images/entities/char_2009.gif) :
:![[thin space (1/6-em)]](https://www.rsc.org/images/entities/char_2009.gif) 1, 2
1, 2![[thin space (1/6-em)]](https://www.rsc.org/images/entities/char_2009.gif) :
:![[thin space (1/6-em)]](https://www.rsc.org/images/entities/char_2009.gif) 1, 3
1, 3![[thin space (1/6-em)]](https://www.rsc.org/images/entities/char_2009.gif) :
:![[thin space (1/6-em)]](https://www.rsc.org/images/entities/char_2009.gif) 1. Next, this slurry was sonicated for 40 min and then vacuumed. Subsequently, the tubes were washed three times with water accompanied with centrifugation separation at 4000 rpm for 10 min, respectively. Finally, the loading of the drug into tubes were dried at 60 °C and grinded. In addition, the influence of the drug-loading effectiveness of the different load ways was compared. The load of Van was calculated according to a calibration curve from the difference amount of the initial Van solution and the remaining Van solution by the absorbance method at 280 nm using a UV-vis spectrometer. The loading efficiency (LE) and encapsulation efficiency (EE) of Van were calculated by the following formula:
1. Next, this slurry was sonicated for 40 min and then vacuumed. Subsequently, the tubes were washed three times with water accompanied with centrifugation separation at 4000 rpm for 10 min, respectively. Finally, the loading of the drug into tubes were dried at 60 °C and grinded. In addition, the influence of the drug-loading effectiveness of the different load ways was compared. The load of Van was calculated according to a calibration curve from the difference amount of the initial Van solution and the remaining Van solution by the absorbance method at 280 nm using a UV-vis spectrometer. The loading efficiency (LE) and encapsulation efficiency (EE) of Van were calculated by the following formula:
Releasing experiments
In inflamed tissues, inflammatory blood cells that can actively pump lactic acid, consequently, high proton concentrations with a pH down to 5.0 can be identified in their neighbourhood. Releasing solution with different pH values was applied to investigate the release process of HNTs–Van. HNTs–Van (20 mg) was encapsulated in a dialysis bag with 1 mL phosphate buffer solution (PBS, 20 mmol L−1) and suspended in 7 mL PBS at pH 7.4 and 5.5 outside, which mimic the pH environments of healthy and inflamed tissues, respectively.30,31 The release study was performed for more than a month at 37 °C in an incubator with an orbital platform shaker, at a constant shaking rate of 100 rpm. At predetermined intervals, an aliquot (4 mL) of the media was taken out and replaced with fresh PBS buffer. The amount of vancomycin released in aqueous solutions was determined by a UV-vis assay at 280 nm. Release profiles were obtained by plotting the absorbance intensities of released drugs vs. time. All experiments were performed in triplicate and release curve was drawn based on the average results of three measurements.
Determination of minimum inhibitory concentration (MIC) and minimum bactericidal concentration (MBC) of HNTs–Van
The MIC and MBC of the prepared HNTs–Van were evaluated using S. aureus and B. streptococcus as model aerobic bacterium, which are commonly found in the marrow cavity in an infection.32 The MIC is defined as the lowest concentration of an antimicrobial agent that inhibits the growth of a microorganism and the MBC test determines the lowest concentration at which an antimicrobial agent will kill a particular microorganism. MIC was determined by tube dilution method. The HNTs–Van solution (1280 mg mL−1) was serially diluted with nutrient broth as 1![[thin space (1/6-em)]](https://www.rsc.org/images/entities/char_2009.gif) :
:![[thin space (1/6-em)]](https://www.rsc.org/images/entities/char_2009.gif) 2, 1
2, 1![[thin space (1/6-em)]](https://www.rsc.org/images/entities/char_2009.gif) :
:![[thin space (1/6-em)]](https://www.rsc.org/images/entities/char_2009.gif) 4, 1
4, 1![[thin space (1/6-em)]](https://www.rsc.org/images/entities/char_2009.gif) :
:![[thin space (1/6-em)]](https://www.rsc.org/images/entities/char_2009.gif) 8, 1
8, 1![[thin space (1/6-em)]](https://www.rsc.org/images/entities/char_2009.gif) :
:![[thin space (1/6-em)]](https://www.rsc.org/images/entities/char_2009.gif) 16, 1
16, 1![[thin space (1/6-em)]](https://www.rsc.org/images/entities/char_2009.gif) :
:![[thin space (1/6-em)]](https://www.rsc.org/images/entities/char_2009.gif) 32, 1
32, 1![[thin space (1/6-em)]](https://www.rsc.org/images/entities/char_2009.gif) :
:![[thin space (1/6-em)]](https://www.rsc.org/images/entities/char_2009.gif) 64, 1
64, 1![[thin space (1/6-em)]](https://www.rsc.org/images/entities/char_2009.gif) :
:![[thin space (1/6-em)]](https://www.rsc.org/images/entities/char_2009.gif) 128 and 1
128 and 1![[thin space (1/6-em)]](https://www.rsc.org/images/entities/char_2009.gif) :
:![[thin space (1/6-em)]](https://www.rsc.org/images/entities/char_2009.gif) 256 to bring 1280 mg mL−1, 640 mg mL−1, 320 mg mL−1, 160 mg mL−1, 80 mg mL−1, 40 mg mL−1, 20 mg mL−1, 10 mg mL−1, 5 mg mL−1 concentrations, respectively. One drop (10 μL) of the standardized bacteria was then added to each of the test tubes. Two test tubes containing nutrient broth without HNTs–Van were added in each test. Further, they were incubated at 37 °C for 24 hours. The lowest concentration, at which there was no turbidity and produce a visible colour change, was regarded as MIC value of the HNTs–Van. MBC was determined by streaking 10 μL of the test dilutions from MIC tubes on nutrient agar incubating at 37 °C for 24 hours. The lowest concentration that kills 99.9% of the bacterial colony on the plates was defined as MBC. The experiment was carried out in triplicates.
256 to bring 1280 mg mL−1, 640 mg mL−1, 320 mg mL−1, 160 mg mL−1, 80 mg mL−1, 40 mg mL−1, 20 mg mL−1, 10 mg mL−1, 5 mg mL−1 concentrations, respectively. One drop (10 μL) of the standardized bacteria was then added to each of the test tubes. Two test tubes containing nutrient broth without HNTs–Van were added in each test. Further, they were incubated at 37 °C for 24 hours. The lowest concentration, at which there was no turbidity and produce a visible colour change, was regarded as MIC value of the HNTs–Van. MBC was determined by streaking 10 μL of the test dilutions from MIC tubes on nutrient agar incubating at 37 °C for 24 hours. The lowest concentration that kills 99.9% of the bacterial colony on the plates was defined as MBC. The experiment was carried out in triplicates.
In Vitro antibacterial activity
The effectiveness of the sustained drug release effect of HNTs–Van against bacteria was investigated through the Kirby–Bauer assay.33 S. aureus (vancomycin MIC is 1.5 μg mL−1 (ref. 34)) and B. streptococcus (vancomycin MIC is 4 μg mL−1 (ref. 35)) were used to determine the antibacterial ability of Van released from the prepared HNTs–Van with different periods. Zones of inhibition (ZOIs) of bacterial growth around the test disks were chosen and calculated for determining the antibiotic released from the prepared HNTs–Van. The nutrient agar was autoclaved at 121 °C for 2 h prior to filling it into 100 mm Petri dishes to be the test disks of ZOIs. The thickness of the culture medium was adjusted to 2 mm. S. aureus and B. streptococcus were respectively cultured aerobically onto agar plates and blood agar plates at 37 °C overnight. An 18 h preculture of two bacterial strains was made in agar plates. These precultures were diluted with 0.9% NaCl to a concentration of approximately 108 bacteria per mL matched with 0.5 the McIntosh turbidometric tube, previously prepared with the appropriate culture medium for each bacterium tested. 350 μL of this bacterial suspension was homogeneously dispersed with a sterile cotton swab on every agar plate. Test cement disks (6 mm diameter made by puncher) had been autoclaved at 121 °C for 2 h and then pre-soaked in 20 μL released solution obtained from the above releasing experiments in different periods. After dried at 37 °C and sterilized by ultraviolet light, the disks were gently placed on the surface of the as-prepared agar plate. After 24 h of incubation at 37 °C, the images of the plates of the inhibition effect were obtained with a digital camera. And then, the diameters of the ZOIs for each sample were measured using the obtained images. The average and standard deviations of the diameters of ZOIs were also calculated.
Results and discussion
Characterization of HNTs
The morphology and particle distribution of the HNTs was measured through SEM, as shown in Fig. 1a. HNTs showed a rod-like structure with uniform width of about 65 nm. The distribution of the length of HNTs was statistically calculated and analysed in Fig. 1b. The mean length of HNTs was estimated to be 550 nm with the property of polydispersity. The morphology of the external and inner diameters of the HNTs was further investigated through transmission electron microscopy (Fig. 1c and d). Rod-like structures with variable lengths were also found in accord with the result of SEM. The HNTs possessed a uniform external diameter of 50 ± 10 nm and were accompanied by a homogeneous inner cavity with a diameter of 15 ± 5 nm. The double-layer structure of the nanotubes also verified the internal cavity structure of the HNTs.
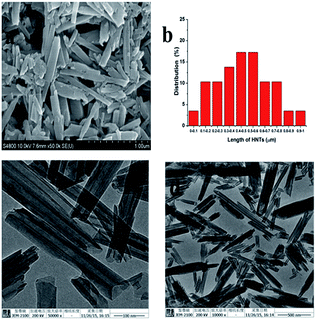 |
| | Fig. 1 SEM image (a) and distribution of the length (b) of halloysite. TEM images (c, d) of halloysite with different magnifications. | |
The variable zeta potentials of HNTs can affect drug loading. Therefore, the zeta potentials of HNTs in solutions of different pH values should be tested and discussed before fabricating a delivery system. The surface zeta potential of the HNTs was negative in the tested pH (Fig. 2).9,11,20 The surface zeta potential of the HNTs (−0.16 mV) quickly reduced to −7.45 mV when the pH was increased from 1.21 to 2.65. Then, the surface zeta potential changed to a platform with about −7.0 mV in the range of pH 2.65–5.03. Finally, when the pH was varied from 5.03 to 7.98, the surface potential rapidly decreased and then slightly rose within the pH range of 7.98–7.98, with the minimum zeta potential of −13.96 mV. The HNTs dispersed well in the water after ultrasonication and displayed no obvious sinking within a short time. This effect revealed that the dispersion exhibited a certain stability derived from the internal negative potential of HNTs in water. Given the cation structure of Van in water, the water dispersion of HNTs with negative zeta potentials in neutral deionized water was suitable for the fabrication of a drug loading system.
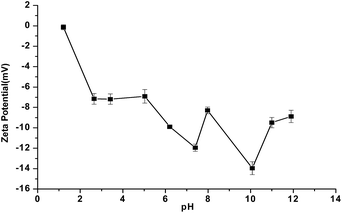 |
| | Fig. 2 Zeta potential curves for 0.1 mg mL−1 HNTs in PBS with different pH values (error bars represent the SDs of three independent testing). | |
Biosafety of HNTs
The biosafety of HNTs was studied through in vitro cell cytocoxicity and in vivo immune toxicity. The potential in vitro cell cytotoxicity of the HNTs was first investigated through MTT assay. The percentage of live cells as determined by celltiter96 reagent was measured at different concentrations of the HNTs, and NaCl served as the negative control. As expected, the HL-60 cells demonstrated excellent growth and activity in the medium with different concentrations of the HNTs (Fig. 3a) after 24 h of incubation. The HNTs exhibited no significant cytotoxicity even at the high concentration of 100 mg mL−1. Furthermore, HNTs–Van yielded 94% ± 26% of live cells (Fig. 3b). A subtle increase in cell number was observed, suggesting that the HNTs cannot affect cell growth and proliferation, similar to the result of the proved biocompatibility using fibroblast cells and other cancer cell.23 Therefore, the MTT result indicates that the HNTs can be utilized as an environment-friendly and noncytotoxic component in drug delivery systems.
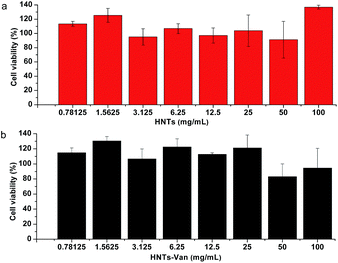 |
| | Fig. 3 Results of the in vitro cytotoxicity of HNTs (a) and HNTs–Van (b) to HL-60 cells cultured for 24 h (error bars represent the SDs of three independent testing). | |
Considering the further in vivo application of HNTs–Van, the in vivo immune toxicity of HNTs in rats was performed through gavage administration, and then the varied cytokines of rats were tested and summarized. The variable levels of cytokines and inflammatory factors in peripheral blood serum reflect the whole immune function. As shown in Table 1, the effects of different doses of HNTs on the two cytokines of TNF-α and IL-1 in rats were not significantly different to blank group, suggesting that HNTs had almost no significant effect on the inflammatory response and monocyte factor in rats. Low and middle doses of HNTs could partly inhibit the secretion of IFN-γ to reduce nonspecific immunity of organism and reduce the immune function. While high dose of HNTs can enhance the secretion of IFN-γ to strengthen the nonspecific immune regulation. The variable secretion of IFN-γ showed that different doses of HNTs can activate the body's immune regulatory mechanism to a certain extent. Low dose of HNTs can cause immune suppression, while high dose of HNTs cause the immune stimulation of organism. The results showed that the effect of the dose of HNTs on rat's immune function may be bidirectional. As a whole, the body's immune system can be regulated with the change of HNTs dose to adapt to the foreign substances, like HNTs herein. Combined with the testing results of the changes of the three cytokines of TNF-α, IL-1 and IFN-γ of the in vivo experiments, we can preliminarily judge that HNTs has good biological safety.
Table 1 Effects of HNTs on peripheral serum cytokines in rats (n = 6, ![[x with combining macron]](https://www.rsc.org/images/entities/i_char_0078_0304.gif) ± s)a
± s)a
| Group |
TNF-α (pg mL−1) |
IL-1 (pg mL−1) |
IFN-γ (pg mL−1) |
| Compared with the blank group, ΔΔP < 0.01. |
| Blank |
26.67 ± 1.07 |
13.68 ± 2.32 |
7.08 ± 0.62 |
| Low dose |
31.98 ± 7.77 |
15.26 ± 2.40 |
4.88 ± 0.33ΔΔ |
| Middle dose |
25.67 ± 4.07 |
15.03 ± 3.09 |
4.70 ± 0.34ΔΔ |
| High dose |
26.09 ± 5.01 |
12.06 ± 5.27 |
11.26 ± 2.67ΔΔ |
Assay of the HNTs–Van
LE and EE are important in the preparation of a drug loading system. Thus, the LE and EE of different ratios of Van and HNTs under different preparation conditions were compared to evaluate the prepared HNTs–Van. The loading of Van increased by an order of magnitude when the drug concentration was increased (Fig. 4a). Then, the drug load no longer increased when the drug ratio in the prepared system was further increased because the loading on the HNTs became saturated.18 When the mass ratio of Van![[thin space (1/6-em)]](https://www.rsc.org/images/entities/char_2009.gif) :
:![[thin space (1/6-em)]](https://www.rsc.org/images/entities/char_2009.gif) HNTs was controlled to 2
HNTs was controlled to 2![[thin space (1/6-em)]](https://www.rsc.org/images/entities/char_2009.gif) :
:![[thin space (1/6-em)]](https://www.rsc.org/images/entities/char_2009.gif) 1, the drug load content increased (14.98 wt% Van) with 8.83% EE. Although the drug EE was high when the mass ratio of Van was low, the drug content was much smaller (Fig. 4a). In general, the mass ratio of Van
1, the drug load content increased (14.98 wt% Van) with 8.83% EE. Although the drug EE was high when the mass ratio of Van was low, the drug content was much smaller (Fig. 4a). In general, the mass ratio of Van![[thin space (1/6-em)]](https://www.rsc.org/images/entities/char_2009.gif) :
:![[thin space (1/6-em)]](https://www.rsc.org/images/entities/char_2009.gif) HNTs = 2
HNTs = 2![[thin space (1/6-em)]](https://www.rsc.org/images/entities/char_2009.gif) :
:![[thin space (1/6-em)]](https://www.rsc.org/images/entities/char_2009.gif) 1 was preferred as an optimum condition with high LE and acceptable EE. In addition, the drug LEs of the suspension dealing with different routes, such as individual sonication, separate shaking, and the combination of sonication and vacuum, were compared in Fig. 4b. Results showed that negative HNTs could efficiently load a positively charged Van by electrostatic adsorption with higher LE and EE through the combination of sonication and vacuum.
1 was preferred as an optimum condition with high LE and acceptable EE. In addition, the drug LEs of the suspension dealing with different routes, such as individual sonication, separate shaking, and the combination of sonication and vacuum, were compared in Fig. 4b. Results showed that negative HNTs could efficiently load a positively charged Van by electrostatic adsorption with higher LE and EE through the combination of sonication and vacuum.
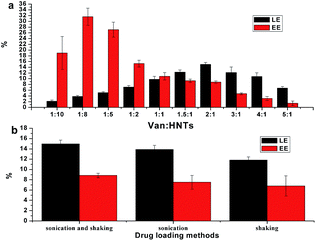 |
| | Fig. 4 Effect of different quality ratios (a) and different drug loading methods (b) on the preparation of HNTs–Van (error bars represent the SDs of three independent testing). | |
Characterization of HNTs–Van
A comparison the UV-vis spectra of Van and HNT loading with or without Van was conducted, as shown in Fig. 5a. Pure HNTs showed no obvious absorption peak in the scanning scope, while there were two peaks at 280 nm and 205 nm for pure Van. When Van molecules were wrapped into HNTs to be HNTs–Van, the peaks at 280 nm and 205 nm ascribed to Van were also simultaneously observed. A comparison of FTIR spectra of Van and HNT loading with or without Van was shown in Fig. 5b. The characteristic peaks at 1651 cm−1 were assigned to NH2 bending vibration, whereas the bands at 1504, 1587, and 1400 cm−1 were attributed to C–C bending vibration in the aromatic rings and C–H bending vibration. The above FTIR characteristic peaks confirmed the structure of Van. The spectrum of HNTs–Van was similar to the spectrum of pure HNTs, which both existed as bands at 3694 and 3621 cm−1 assigned to O–H stretching vibration. Aside from the characteristic peaks of the HNTs and the overlapping peaks at 1399 and 1634 cm−1, HNTs–Van exhibited the specific band at 1504 cm−1 assigned to C–C bending vibration in the aromatic rings because of the load of Van. Furthermore, the presence of the element of C and N in the XPS survey (Fig. 5c) of HNTs–Van compared with the survey of HNTs further confirmed the successful encapsulation of Van in the HNTs–Van system. Based on the spectral analysis, it concluded that Van was successfully wrapped in HNTs and that the HNTs did not affect the chemical structure of Van.
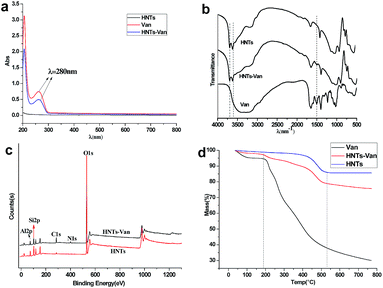 |
| | Fig. 5 The UV-vis (a), FTIR (b) spectra and thermogravimetric analysis (d) of HNTs, Van and HNTs–Van. And the XPS survey (c) of HNTs and HNTs–Van. | |
The weight ratio of the loading of Van in HNTs–Van was investigated through thermogravimetric analysis (Fig. 5d). Pristine halloysite showed approximately 10.35% weight loss in the range of 37–770 °C derived from the loss of absorbed water and crystal water.36 Compared with raw HNTs, HNTs–Van showed additional weight loss than raw HNTs in the range of 37–770 °C. At temperatures higher than 197 °C, the Van in HNTs–Van began to decompose with the same weight loss temperature of pure Van. The total weight loss of the HNTs–Van was about 25%. This result indicated that except for the water loss in original HNTs, the weight ratio of Van was about 15% in HNTs–Van, which was very close to the calculated LE (14.98 wt%).
In vitro drug release of HNTs–Van
The in vitro release profile of the HNTs–Van for 33 days was monitored in PBS with pH 5.0 and 7.4, respectively. The behaviours of Van released from HNTs–Van were almost the same in PBS with different pH values of 5.0 and 7.4 (Fig. 6). An initial burst of Van was observed in the first 3 days under different pH values. About 53.4% of Van was released from HNTs–Van within 1 day at pH 5.0, and approximately 50.2% of Van was released within 1 day at pH 7.4. This result may be attributed to the lack of specific binding affinity between the free Van and the relatively large-surface-area HNTs. The initial burst was followed by the sustained release in the long latter period. After 5 weeks, the percentages of the total Van released from HNTs were 84.8% and 74.8% at pH 5.0 and 7.4, respectively. By contrast, a relatively rapid release of pure Van without the HNT coating occurred. The fast initial release of antibiotics followed by a sustained and steady release benefitted the treatment of bone infections.37,38 The in vitro release results indicated that the HNT coating could effectively control the Van release rate of HNTs–Van as a local drug delivery system for the real treatment of infections.
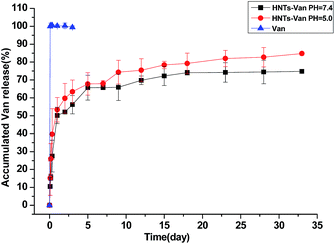 |
| | Fig. 6 In vitro release curves of HNTs–Van in phosphate buffers with different pH values (error bars represent the SDs of three independent testing). | |
In Vitro antibacterial activity
The MIC and MBC of HNTs–Van were given in Table 2. HNTs–Van showed good inhibition against S. aureus and B. streptococcus at 20 μg mL−1 and 80 μg mL−1 concentrations, respectively. The higher values of MIC of HNTs–Van to S. aureus and B. streptococcus may be due to the following two reasons: one is the wrapped of Van in HNTs to be the sustained release system, and the other is that the weight ratio of Van was about 15% in HNTs–Van. The MBC of HNTs–Van against B. streptococcus was found to be the same as MIC. While the MBC for S. aureus was two-fold larger than the corresponding MIC result.
Table 2 MIC and MBC of HNTs–Van to S. aureus and B. streptococcus
| Bacteria |
The concentration of HNTs–Van (μg mL−1) |
| 0 |
5 |
10 |
20 |
40 |
80 |
160 |
320 |
640 |
1280 |
| S. aureus |
MIC |
+ |
+ |
+ |
− |
− |
− |
− |
− |
− |
− |
| MBC |
+ |
+ |
+ |
+ |
− |
− |
− |
− |
− |
− |
| B. streptococcus |
MIC |
+ |
+ |
+ |
+ |
+ |
− |
− |
− |
− |
− |
| MBC |
+ |
+ |
+ |
+ |
+ |
− |
− |
− |
− |
− |
Fig. 7 showed the inhibitory effect of the reaction of S. aureus and B. streptococcus strains with HNTs–Van, pure HNT as negative control and Van as positive control. Bacterial inhibition zones with different diameters were clearly observed around different concentration released Van from HNTs–Van of different releasing periods. By contrast, pure HNT sample did not show any inhibitory area. The membranes of the releasing solution of HNTs–Van inhibited bacterial growth in a diameter larger than the membrane size because of drug diffusion into agar. In the case of S. aureus and B. streptococcus, large inhibition zones were found in the formulations released in the initial period (first 3 days), followed by small but sustained effective inhibition areas in the latter disks. The inhibition zone diameters at different release times are calculated and presented in Fig. 8. The regularity of the inhibitory diameter in the culture was consistent with the release process of HNTs–Van shown in Fig. 6. The ZOIs around the disks of the released solution of HNTs–Van towards S. aureus and B. streptococcus strains also reached 7.8 ± 0.4 mm and 7.2 ± 0.4 mm at the 33rd day, respectively. The results suggested the fact that the concentration of the released Van exceeded the MIC of Van against S. aureus and B. streptococcus. These findings indicated that the extended release system exerted an effective antibacterial activity in the whole sustained period. Although the inhibition zones for S. aureus were smaller than for those for B. streptococcus, the differences were not statistically significant. These phenomena confirmed that the encapsulation of Van in HNTs did not adversely affect the drug. Furthermore, the Van released from halloysite retained a long-lasting antibacterial activity.
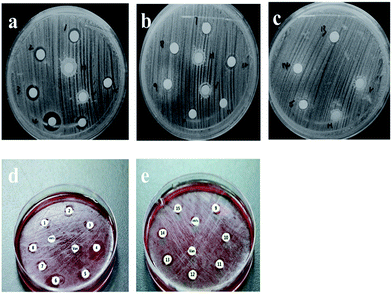 |
| | Fig. 7 Bacteriostatic ring after the agar plate bacterial culture for a certain period. Antibacterial effect of S. aureus in the first 3 days (no. 1–6 represent the results for 2, 4, and 8 h and 1, 2, and 3 days) (a), 5–18 days (no. 7–12 represent the results for 5, 7, 9, 12, 15, and 18 days) (b), and 23–33 days (no. 13–15 represent the results for 23, 28 and 33 days) (c). Antibacterial effect of B. streptococcus during the first 7 days (no. 1–8 represent the 2, 4, and 8 h and 1, 2, 3, 5, and 7 days, respectively) (d) and 23–33 days (no. 13–15 represent the results for 23, 28 and 33 days) (e). | |
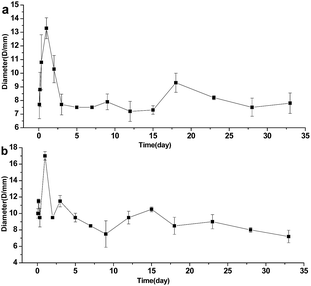 |
| | Fig. 8 Variation trends of bacteriostatic ring diameters of S. aureus (a) and B. streptococcus (b) at different releasing times (error bars represent the SDs of three independent testing). | |
Conclusion
A sustained release system for Van loading using nontoxic cost-effective HNTs as nanocarriers was conveniently developed in this work. Under optimal fabricating conditions, the loading of Van in HNTs to be HNTs–Van can obtain a high LE accompanied with acceptable EE. Such a release system can maintain drug concentrations higher than the MIC for most pathogens over a long period since the release process in the pH 7.4 and 5.0 buffers. The released drug exhibited high antibacterial activity to S. aureus and B. streptococcus even after the long release period of 33 days. Furthermore, halloysite is a promising “green” local antibiotic delivery system that does not require exfoliation or other complicated energy-consuming process, permitting the storage and controlled release of molecules. As such, these tiny containers are desirable for applications in drug delivery, antimicrobial materials, self-healing polymeric composites, and regenerative medicine that entail time-extended functions.
Acknowledgements
The authors gratefully acknowledge for financial support from the National Natural Science Foundation of China (21405016) the National Science Foundation of Fujian Province (2016I0004, 2015J01043, 2015J01494, 2016J01767), the Major Program of Medical and Health Foundation of Nanjing Military Region (12Z39) and the Innovation and Entrepreneurship Training Programs for College Students of Fujian Medical University (201510392037).
Notes and references
- A. G. Gristina, M. Oga, L. X. Webb and C. D. Hobgood, Science, 1985, 228, 990 CAS.
- G. A. James, E. Swogger, R. Wolcott, E. D. Pulcini, P. Secor, J. Sestrich, J. W. Costerton and P. S. Stewart, Wound Repair Regen., 2008, 16, 37 CrossRef PubMed.
- N. Emanuel, Y. Rosenfeld, O. Cohen, Y. H. Applbaum, D. Segal and Y. Barenholz, J. Controlled Release, 2012, 160, 353 CrossRef CAS PubMed.
- P. S. Stewart and J. W. Costerton, Lancet, 2001, 358, 135 CrossRef CAS.
- P. Wu and D. W. Grainger, Biomaterials, 2006, 27, 2450 CrossRef CAS PubMed.
- B. Snoddy and A. C. Jayasuriya, Mater. Sci. Eng., C, 2016, 67, 822 CrossRef CAS PubMed.
- J. S. Suk, Q. G. Xu, N. Kim, J. Hanes and L. M. Ensign, Adv. Drug Delivery Rev., 2016, 99, 28 CrossRef CAS PubMed.
- M. Goldberg and R. Langer, J. Biomater. Sci., Polym. Ed., 2007, 18, 241 CrossRef CAS PubMed.
- Y. Lvov and E. Abdullayev, Prog. Polym. Sci., 2013, 38, 1690 CrossRef CAS.
- M. Du, B. Guo and D. Jia, Polym. Int., 2010, 59, 574 CAS.
- Y. M. Lvov, D. G. Shchukin, H. Möhwald and R. R. Price, ACS Nano, 2008, 2, 814 CrossRef CAS PubMed.
- P. Podsiadlo, A. Kaushik, E. Arruda, A. Waas, B. Shim, J. Xu, H. Nandivadu, B. Pumplin, J. Lahann, A. Ramamoorthy and N. Kotov, Science, 2007, 318, 80 CrossRef CAS PubMed.
- Y. C. Li, J. Schulz, S. Mannen, C. Delhom, B. Condon, S. C. Chang, M. Zammaran and J. Grunlan, ACS Nano, 2010, 4, 3325 CrossRef CAS PubMed.
- E. Ruiz-Hitzky, M. Dardera, F. Fernandes, B. Wicklein, A. Alcantar and P. Aranda, Prog. Polym. Sci., 2013, 38, 1392 CrossRef CAS.
- E. Abdullayev, R. Price, D. Shchukin and Y. Lvov, ACS Appl. Mater. Interfaces, 2009, 1, 1437 CAS.
- D. C. O. Marney, L. J. Russell, D. Y. Wu, T. Nguyen, D. Cramm, N. Rigopoulos, N. Wright and M. Greaves, Polym. Degrad. Stab., 2008, 93, 1971 CrossRef CAS.
- R. R. Price, B. P. Gaber and Y. Lvov, J. Microencapsulation, 2001, 18, 713 CrossRef CAS PubMed.
- H. M. Kelly, P. B. Deasy, E. Ziaka and N. Claffey, Int. J. Pharm., 2004, 274, 167 CrossRef CAS PubMed.
- R. Price, B. Gaber and Y. Lvov, J. Microencapsulation, 2001, 18, 713 CrossRef CAS PubMed.
- V. Vergaro, E. Abdullayev, R. Cingolani, Y. Lvov and S. Leporatti, Biomacromolecules, 2010, 11, 820 CrossRef CAS PubMed.
- G. Fakhrullina, F. Akhatova, Y. Lvov and R. Fakhrullin, Environ. Sci.: Nano, 2015, 2, 54 RSC.
- J. Cervini-Silva, A. Nieto-Camacho, E. Palacios, J. A. Montoya, V. Gómez-Vidales and M. T. Ramírez-Apán, Colloids Surf., B, 2013, 111, 651 CrossRef CAS PubMed.
- N. G. Veerabadran, D. Mongayt, V. Torchilin, R. R. Price and Y. M. Lvov, Macromol. Rapid Commun., 2009, 30, 99 CrossRef CAS PubMed.
- D. X. Cui, F. R. Tian, C. S. Ozkan, M. Wang and H. J. Gao, Toxicol. Lett., 2005, 155, 73 CrossRef CAS PubMed.
- L. H. Ding, J. Stilwell, T. T. Zhang, O. Elboudwarej, H. J. Jiang, J. P. Selegue, P. A. Cooke, J. W. Gray and F. Q. Chen, Nano Lett., 2005, 5, 2448 CrossRef CAS PubMed.
- N. A. Monteiro-Riviere, R. J. Nemanich, A. O. Inman, Y. Y. Y. Wang and J. E. Riviere, Toxicol. Lett., 2005, 155, 377 CrossRef CAS PubMed.
- M. X. Liu, B. C. Guo, M. L. Du, Y. D. Lei and D. M. Jia, J. Polym. Res., 2008, 15, 205 CrossRef CAS.
- Y. P. Ye, H. B. Chen, J. S. Wu and L. Ye, Polymer, 2007, 48, 6426 CrossRef CAS.
- P. Pasbakhsh, H. Ismail, M. N. A. Fauzi and A. A. Bakar, Polym. Test., 2009, 28, 548 CrossRef CAS.
- K. H. Steen, A. E. Steen and P. W. Reeh, J. Neurosci., 1995, 15, 3982 CAS.
- S. Mariotto, A. C. de Prati, E. Cavalieri, E. Amelio, E. Marlinghaus and H. Suzuki, Curr. Med. Chem., 2009, 16, 2366 CrossRef CAS PubMed.
- B. Signat, C. Roques, P. Poulet and D. Duffaut, Curr. Issues Mol. Biol., 2011, 13, 25 CAS.
- J. Xue, M. He, H. Liu, Y. Niu, A. Crawford, P. D. Coates, D. Chen, R. Shi and L. Zhang, Biomaterials, 2014, 35, 9395 CrossRef CAS PubMed.
- U. Joosten, A. Joist, G. Gosheger, U. Liljenqvist, B. Brandt and C. von Eiff, Biomaterials, 2005, 26, 5251 CrossRef CAS PubMed.
- C. Park, M. Nichols and S. J. Schrag, N. Engl. J. Med., 2014, 370, 885–886 CrossRef CAS PubMed.
- J. R. Feng, H. L. Fan, D. A. Zha, L. Wang and Z. X. Jin, Langmuir, 2016, 32, 10377 CrossRef CAS PubMed.
- M. F. Chung, W. T. Chia, H. Y. Liu, C. W. Hsiao, H. C. Hsiao, C. M. Yang and H. W. Sung, Adv. Healthcare Mater., 2014, 3, 1854 CrossRef CAS PubMed.
- S. Radin, G. El-Bassyouni, E. J. Vresilovic, E. Schepers and P. Ducheyne, Biomaterials, 2005, 26, 1043 CrossRef CAS PubMed.
Footnote |
| † Both of the authors contributed equally. |
|
| This journal is © The Royal Society of Chemistry 2017 |
Click here to see how this site uses Cookies. View our privacy policy here.  Open Access Article
 *a,
Yanjie Zhenga and
Liying Huang*a
![[thin space (1/6-em)]](https://www.rsc.org/images/entities/char_2009.gif) :
:![[thin space (1/6-em)]](https://www.rsc.org/images/entities/char_2009.gif) 1, HNTs–Van obtained the highest Van loading content under suitable preparation conditions. HNTs–Van allowed the effective and extended release of the drug over a period of 33 days, compared with only 1 day with the direct release of pristine Van. The feasibility of the highly effective local antibacterial activity of HNTs–Van in treating infections was confirmed through the Kirby–Bauer assay. This work suggests that HNTs are efficient for the local delivery of antibiotics in bacterial infection treatment.
1, HNTs–Van obtained the highest Van loading content under suitable preparation conditions. HNTs–Van allowed the effective and extended release of the drug over a period of 33 days, compared with only 1 day with the direct release of pristine Van. The feasibility of the highly effective local antibacterial activity of HNTs–Van in treating infections was confirmed through the Kirby–Bauer assay. This work suggests that HNTs are efficient for the local delivery of antibiotics in bacterial infection treatment.![[thin space (1/6-em)]](https://www.rsc.org/images/entities/char_2009.gif) :
:![[thin space (1/6-em)]](https://www.rsc.org/images/entities/char_2009.gif) HNTs is 1
HNTs is 1![[thin space (1/6-em)]](https://www.rsc.org/images/entities/char_2009.gif) :
:![[thin space (1/6-em)]](https://www.rsc.org/images/entities/char_2009.gif) 10, 1
10, 1![[thin space (1/6-em)]](https://www.rsc.org/images/entities/char_2009.gif) :
:![[thin space (1/6-em)]](https://www.rsc.org/images/entities/char_2009.gif) 8, 1
8, 1![[thin space (1/6-em)]](https://www.rsc.org/images/entities/char_2009.gif) :
:![[thin space (1/6-em)]](https://www.rsc.org/images/entities/char_2009.gif) 5, 1
5, 1![[thin space (1/6-em)]](https://www.rsc.org/images/entities/char_2009.gif) :
:![[thin space (1/6-em)]](https://www.rsc.org/images/entities/char_2009.gif) 2, 1
2, 1![[thin space (1/6-em)]](https://www.rsc.org/images/entities/char_2009.gif) :
:![[thin space (1/6-em)]](https://www.rsc.org/images/entities/char_2009.gif) 1, 1.5
1, 1.5![[thin space (1/6-em)]](https://www.rsc.org/images/entities/char_2009.gif) :
:![[thin space (1/6-em)]](https://www.rsc.org/images/entities/char_2009.gif) 1, 2
1, 2![[thin space (1/6-em)]](https://www.rsc.org/images/entities/char_2009.gif) :
:![[thin space (1/6-em)]](https://www.rsc.org/images/entities/char_2009.gif) 1, 3
1, 3![[thin space (1/6-em)]](https://www.rsc.org/images/entities/char_2009.gif) :
:![[thin space (1/6-em)]](https://www.rsc.org/images/entities/char_2009.gif) 1. Next, this slurry was sonicated for 40 min and then vacuumed. Subsequently, the tubes were washed three times with water accompanied with centrifugation separation at 4000 rpm for 10 min, respectively. Finally, the loading of the drug into tubes were dried at 60 °C and grinded. In addition, the influence of the drug-loading effectiveness of the different load ways was compared. The load of Van was calculated according to a calibration curve from the difference amount of the initial Van solution and the remaining Van solution by the absorbance method at 280 nm using a UV-vis spectrometer. The loading efficiency (LE) and encapsulation efficiency (EE) of Van were calculated by the following formula:
1. Next, this slurry was sonicated for 40 min and then vacuumed. Subsequently, the tubes were washed three times with water accompanied with centrifugation separation at 4000 rpm for 10 min, respectively. Finally, the loading of the drug into tubes were dried at 60 °C and grinded. In addition, the influence of the drug-loading effectiveness of the different load ways was compared. The load of Van was calculated according to a calibration curve from the difference amount of the initial Van solution and the remaining Van solution by the absorbance method at 280 nm using a UV-vis spectrometer. The loading efficiency (LE) and encapsulation efficiency (EE) of Van were calculated by the following formula:![[thin space (1/6-em)]](https://www.rsc.org/images/entities/char_2009.gif) :
:![[thin space (1/6-em)]](https://www.rsc.org/images/entities/char_2009.gif) 2, 1
2, 1![[thin space (1/6-em)]](https://www.rsc.org/images/entities/char_2009.gif) :
:![[thin space (1/6-em)]](https://www.rsc.org/images/entities/char_2009.gif) 4, 1
4, 1![[thin space (1/6-em)]](https://www.rsc.org/images/entities/char_2009.gif) :
:![[thin space (1/6-em)]](https://www.rsc.org/images/entities/char_2009.gif) 8, 1
8, 1![[thin space (1/6-em)]](https://www.rsc.org/images/entities/char_2009.gif) :
:![[thin space (1/6-em)]](https://www.rsc.org/images/entities/char_2009.gif) 16, 1
16, 1![[thin space (1/6-em)]](https://www.rsc.org/images/entities/char_2009.gif) :
:![[thin space (1/6-em)]](https://www.rsc.org/images/entities/char_2009.gif) 32, 1
32, 1![[thin space (1/6-em)]](https://www.rsc.org/images/entities/char_2009.gif) :
:![[thin space (1/6-em)]](https://www.rsc.org/images/entities/char_2009.gif) 64, 1
64, 1![[thin space (1/6-em)]](https://www.rsc.org/images/entities/char_2009.gif) :
:![[thin space (1/6-em)]](https://www.rsc.org/images/entities/char_2009.gif) 128 and 1
128 and 1![[thin space (1/6-em)]](https://www.rsc.org/images/entities/char_2009.gif) :
:![[thin space (1/6-em)]](https://www.rsc.org/images/entities/char_2009.gif) 256 to bring 1280 mg mL−1, 640 mg mL−1, 320 mg mL−1, 160 mg mL−1, 80 mg mL−1, 40 mg mL−1, 20 mg mL−1, 10 mg mL−1, 5 mg mL−1 concentrations, respectively. One drop (10 μL) of the standardized bacteria was then added to each of the test tubes. Two test tubes containing nutrient broth without HNTs–Van were added in each test. Further, they were incubated at 37 °C for 24 hours. The lowest concentration, at which there was no turbidity and produce a visible colour change, was regarded as MIC value of the HNTs–Van. MBC was determined by streaking 10 μL of the test dilutions from MIC tubes on nutrient agar incubating at 37 °C for 24 hours. The lowest concentration that kills 99.9% of the bacterial colony on the plates was defined as MBC. The experiment was carried out in triplicates.
256 to bring 1280 mg mL−1, 640 mg mL−1, 320 mg mL−1, 160 mg mL−1, 80 mg mL−1, 40 mg mL−1, 20 mg mL−1, 10 mg mL−1, 5 mg mL−1 concentrations, respectively. One drop (10 μL) of the standardized bacteria was then added to each of the test tubes. Two test tubes containing nutrient broth without HNTs–Van were added in each test. Further, they were incubated at 37 °C for 24 hours. The lowest concentration, at which there was no turbidity and produce a visible colour change, was regarded as MIC value of the HNTs–Van. MBC was determined by streaking 10 μL of the test dilutions from MIC tubes on nutrient agar incubating at 37 °C for 24 hours. The lowest concentration that kills 99.9% of the bacterial colony on the plates was defined as MBC. The experiment was carried out in triplicates.


![[x with combining macron]](https://www.rsc.org/images/entities/i_char_0078_0304.gif) ± s)a
± s)a
![[thin space (1/6-em)]](https://www.rsc.org/images/entities/char_2009.gif) :
:![[thin space (1/6-em)]](https://www.rsc.org/images/entities/char_2009.gif) HNTs was controlled to 2
HNTs was controlled to 2![[thin space (1/6-em)]](https://www.rsc.org/images/entities/char_2009.gif) :
:![[thin space (1/6-em)]](https://www.rsc.org/images/entities/char_2009.gif) 1, the drug load content increased (14.98 wt% Van) with 8.83% EE. Although the drug EE was high when the mass ratio of Van was low, the drug content was much smaller (Fig. 4a). In general, the mass ratio of Van
1, the drug load content increased (14.98 wt% Van) with 8.83% EE. Although the drug EE was high when the mass ratio of Van was low, the drug content was much smaller (Fig. 4a). In general, the mass ratio of Van![[thin space (1/6-em)]](https://www.rsc.org/images/entities/char_2009.gif) :
:![[thin space (1/6-em)]](https://www.rsc.org/images/entities/char_2009.gif) HNTs = 2
HNTs = 2![[thin space (1/6-em)]](https://www.rsc.org/images/entities/char_2009.gif) :
:![[thin space (1/6-em)]](https://www.rsc.org/images/entities/char_2009.gif) 1 was preferred as an optimum condition with high LE and acceptable EE. In addition, the drug LEs of the suspension dealing with different routes, such as individual sonication, separate shaking, and the combination of sonication and vacuum, were compared in Fig. 4b. Results showed that negative HNTs could efficiently load a positively charged Van by electrostatic adsorption with higher LE and EE through the combination of sonication and vacuum.
1 was preferred as an optimum condition with high LE and acceptable EE. In addition, the drug LEs of the suspension dealing with different routes, such as individual sonication, separate shaking, and the combination of sonication and vacuum, were compared in Fig. 4b. Results showed that negative HNTs could efficiently load a positively charged Van by electrostatic adsorption with higher LE and EE through the combination of sonication and vacuum.


