 Open Access Article
Creative Commons Attribution 3.0 Unported Licence
Colorimetric detection of cholic acid based on an aptamer adsorbed gold nanoprobe†
Qiuyun Zhu‡
,
Tingting Li‡,
Yi Ma‡,
Zhaohui Wang,
Jinxin Huang,
Ruonan Liu and
Yueqing Gu *
*
Department of Biomedical Engineering, School of Engineering, China Pharmaceutical University, Nanjing 210009, China. E-mail: guengineering@cpu.edu.cn
First published on 31st March 2017
Abstract
Cholic acid (CA) has been proved as an effective clinical biomarker for disease diagnosis and treatment monitoring. However, traditional CA detection methods are tedious, time-consuming and expensive, and the results cannot be visualized. Herein, we present a facile, low-cost, fast and label-free biosensor platform based on a CA aptamer (48 nt) modified gold nanoprobe for CA detection. CA can bind with the surface-adsorbed CA aptamers competitively and detach the aptamer from the gold nanoparticles (Au NPs). Au NPs modified with aptamers of different densities will grow into morphologically varied nanostructures. The result can be observed visibly and quantified easily with the localized surface plasmon resonance (LSPR) spectra. The detection limit (LOD) was 1 μM, which was lower than the existing colorimetric detection methods based on Au NPs. Furthermore, the affinity between CA and 48 nt aptamer was verified for the first time by MicroScale Thermophoresis (MST) technology.
Introduction
Bile acid, the major metabolite of cholesterol, is a mixture of steroids, and plays an important physiological role in the elimination of cholesterol from the body and in facilitating the absorption of dietary lipids and fat-soluble vitamins by formation of micelles.1,2 The concentration of bile acids in the body is related to hepatitis, gallstones and other diseases. It has been shown that the concentration of bile acids in individuals with liver and intestinal diseases varies from 67 to 376 μmol L−1, while in healthy individuals the range is from 4 to 10 μmol L−1.3,4 Additionally, bile acids also have pharmacological activity, and some components of bile acids have important therapeutic applications in treating some diseases, such as primary biliary cirrhosis and cholesterol gallstones.5,6 Cholic acid (CA) comprises 31% of the total bile acids (TBA) produced in the liver. The concentration of cholic acid has been proved as an effective indicator in the diagnosis of liver and intestinal diseases.7 Hence, the quantification of bile acids, especially cholic acid is vital for diseases diagnosis and treatment monitoring. Traditional cholic acid detection involves spectroscopic and chromatographic methods such as HPLC and LC-MS, which are tedious, time-consuming, expensive and the results cannot be visualized.Localized surface plasmon resonance (LSPR) based biosensors are superior for in vitro detections (IVDs) because these methods are cost-effective, fast, simple and highly sensitive.8,9 Gold nanoparticles (Au NPs) have been recognized as a promising candidate for LSPR-based IVDs due to ultrahigh extinction coefficients, easy synthesis, tunable surface modification, favorable stability and biosafety.10,11 Through the precise control of the aggregation, shape and size, the LSPR absorption of Au NPs can be tuned, which is usually accompanied by color changes from red to purple or blue.12–15 Nucleic acid aptamers have attracted much attention over the past decades as a promising alternative to antibodies for IVD sensors. They are thermostable, fold reversible, inexpensive and can be readily synthesized via standard laboratory techniques such as PCR.16–18 Currently, novel LSPR biosensors based on aptamer–Au NPs probes have been extensively investigated.19–21 However, such sensing platforms are mostly based on Au NPs aggregation and can be easily affected by biological environment. Recently, Lu et al. demonstrated for the first time that single-stranded DNA (ssDNA) could be used to tune Au NPs morphology during crystal growth.22 Based on this principle, Stevens et al. first reported a novel colorimetric assay that couples aptamer–target recognition and aptamer-mediated control of Au NPs morphology for the sensitive and naked-eye detection of ochratoxin A, cocaine and 17β-estradiol.23
In this study, we designed a simple and fast aptamer–Au NPs biosensor for the in vitro naked eye detection of cholic acid. Cholic acid aptamers (48 nt) were adsorbed on Au NPs surface via Au–nucleoside affinity and charge-shielding effect of MgCl2. Cholic acid can regulate amounts of ssDNA strands from the Au NPs surface by aptamer–target interaction, which could affect the morphology of grown Au NPs, consequently producing solutions of different colors. Furthermore, we confirm the binding affinity of CA and the aptamer by MicroScale Thermophoresis (MST) for the first time and investigated the desorption process using FAM-labeled aptamer by fluorescence resonance energy transfer (FRET).
Experimental section
Materials and reagents
Chloroauric acid (HAuCl4) was purchased from Guoyao Reagent Corporation (Shanghai, China). Sodium citrate (Na3C6H5O7), magnesium chloride (MgCl2) and 5(6)-carboxyfluorescein (FAM) were purchased from Sinopharm Chemical Reagent Co., Ltd. (China). Hydroxylammonium chloride (NH2OH·HCl) and dimethylsulfoxide (DMSO) were obtained from Nanjing Chemical Reagent Co., Ltd. (China). Cholic acid (CA), deoxycholic acid (DCA), chenodeoxycholic acid (CDCA), glycocholic acid (GCA) and lithocholic acid (LCA) were purchased from Sigma-Aldrich Inc. (USA). All chemical reagents were analytical grade and were used without further purification. All solutions were prepared using deionized water (Milli-Q grade, Millipore) with a resistivity of 18.2 MΩ cm.The following sequences were synthesized by Sangon Biological Engineering Technology & Co. Ltd (Shanghai, China):
CA aptamer: 5′-GCA GGG TCA ATG GAA TTA ATG ATC AAT TGA CAG ACG CAA GTC TCC TGC-3′; CA aptamer complementary sequence: 5′-GCA GGA GAC TTG CGT CTG TCA ATT GAT CAT TAA TTC CAT TGA CCC TGC-3′; FAM-labeled CA aptamer: 5′-FAM-GCA GGG TCA ATG GAA TTA ATG ATC AAT TGA CAG ACG CAA GTC TCC TGC-3′.
Preparation of Au NPs
Au NPs (∼15 nm in diameter) were prepared by citrate reduction method. By quickly adding 10 mL trisodium citrate (38.8 mM) to a boiling 100 mL HAuCl4 solution (1 mM) with vigorous stirring, and the reaction last 30 min. Until the color turned to deep red, the solution was centrifuged at 5000 rpm for 5 min, and the supernatant was stored at 4 °C until use.Preparation of Apt–Au NPs and growth analysis
Amounts stated here refer to the preparation of Apt–Au NP from a single well (volume of 180 μL) in the 96-well plate (Corning, USA) and can be scaled up depending on the number of wells required. The facile synthesis of the Apt–Au NP probe was as follows, different volumes (0, 2.5, 5, 7.5, 10, 12.5 and 15 μL) of CA aptamer (2 μM) were added to given amounts (8, 16 and 24 μL) of ∼15 nm Au NPs (5 nM), with 20 μL of MgCl2 (1 mM), then supplementary water was added to 180 μL. Adsorption reactions were conducted overnight with gently shaking at room temperature. Finally, the Apt–Au NP probe was acquired.For the growth of Apt–Au NPs, NH2OH·HCl (5 μL, 167 mM) and HAuCl4 (10 μL, 2 mM) were sequentially added to the prepared probe solution. Another two aliquots of HAuCl4 were then added with about 5 min incubation between each addition. The solutions were mixed thoroughly using the pipet while adding to each well. The color change and UV-vis spectra of solutions were recorded with a camera and a POLARstar Omega multi-mode microplate reader (BMG LABTECH, Germany).
Characterizations
The morphology of the prepared Au NPs and Apt–Au NP were characterized by JEOL JEM-2100 transmission electron microscopy (TEM). The nanostructures with same concentrations of Au NPs were subjected to dynamic light scattering (Zetaplus nanoparticle size analyzer, Brookhaven) to measure the hydrodynamic diameter and zeta potential. An OD-1000+ UV-Vis spectrophotometer (One Drop® Technologies, China) was used for the detection of the absorption spectra of the aptamer, Au NPs and the Apt–Au NP probe.Interaction analysis of CA and CA aptamer
The concentrations of FAM labeled aptamer and FAM solution (negative control) were both kept constant at a concentration of 0.1 μM in MST optimized buffer (50 mM Tris–HCl buffer, pH 7.6 containing 150 mM NaCl, 10 mM MgCl2 and 0.05% Tween-20). The unlabeled binding partners (CA) were titrated in 1![[thin space (1/6-em)]](https://www.rsc.org/images/entities/char_2009.gif) :
:![[thin space (1/6-em)]](https://www.rsc.org/images/entities/char_2009.gif) 1 dilutions beginning at a final concentration of 500 μM with MST optimized buffer containing 4% DMSO. After 1
1 dilutions beginning at a final concentration of 500 μM with MST optimized buffer containing 4% DMSO. After 1![[thin space (1/6-em)]](https://www.rsc.org/images/entities/char_2009.gif) :
:![[thin space (1/6-em)]](https://www.rsc.org/images/entities/char_2009.gif) 1 mixing, the samples were incubated for 20 min and filed into standard treated capillaries (Cat#K002, NanoTemper Technologies, Germany). Next, a primary capillary scan determined the exact position of the capillaries on the holder and gave information on fluorescence quenching as well as the solubility of the aptamer and CA–aptamer complex. The measurements were conducted on a NanoTemper Monolith NT.115 instrument. And the analysis was performed at 20% “LED Power” and 40% “MST Power”, “Fluo. Before” time was 5 s, “MST on” time was 30 s and “Fluo. After” time was 5 s. Normalized fluorescence versus CA concentrations were analyzed using the NanoTemper analysis software (NTAnalysis_v1.5.41). Kd values were calculated according to the following equation (law of mass action): f(c) = unbound + (bound − unbound)/2 × (FluoConc + c + Kd − Sqrt((FluoConc + c + Kd)2 −4 × FluoConc × c)) where f(c) is the fluorescence intensity of the mixed solution of CA and aptamer; bound is the number of moles of the bounding of CA and aptamer; unbound is the number of moles of the unbounding of CA and aptamer; FluoConc is the concentration of FAM-apt; c is the concentration of CA; Kd is the affinity constant of CA and aptamer.
1 mixing, the samples were incubated for 20 min and filed into standard treated capillaries (Cat#K002, NanoTemper Technologies, Germany). Next, a primary capillary scan determined the exact position of the capillaries on the holder and gave information on fluorescence quenching as well as the solubility of the aptamer and CA–aptamer complex. The measurements were conducted on a NanoTemper Monolith NT.115 instrument. And the analysis was performed at 20% “LED Power” and 40% “MST Power”, “Fluo. Before” time was 5 s, “MST on” time was 30 s and “Fluo. After” time was 5 s. Normalized fluorescence versus CA concentrations were analyzed using the NanoTemper analysis software (NTAnalysis_v1.5.41). Kd values were calculated according to the following equation (law of mass action): f(c) = unbound + (bound − unbound)/2 × (FluoConc + c + Kd − Sqrt((FluoConc + c + Kd)2 −4 × FluoConc × c)) where f(c) is the fluorescence intensity of the mixed solution of CA and aptamer; bound is the number of moles of the bounding of CA and aptamer; unbound is the number of moles of the unbounding of CA and aptamer; FluoConc is the concentration of FAM-apt; c is the concentration of CA; Kd is the affinity constant of CA and aptamer.
Targets detection in solution
DCA, CDCA, GCA and LCA were prepared in DMSO with concentrations of 100 mM. Then the solutions were respectively diluted to the required concentration (1, 10, 50, 100, 300 μM) with double distilled water as samples. Different concentrations of samples (20 μL) were added to 180 μL of Apt–Au NP probes in each well respectively followed by incubation for 30 min. The Au NPs solution, containing MgCl2 (20 μL, 1 mM), was served as the negative control group. Then NH2OH·HCl (5 μL, 167 mM) and different aliquots of HAuCl4 (10 μL, 2 mM) were sequentially added to each well in every 5 min with sufficient mixing. The color change and UV-vis spectra of solutions were recorded with a camera and a POLARstar Omega multi-mode microplate reader (BMG LABTECH, Germany).Aptamer desorption analysis
4 μL of FAM-modified CA aptamer (2 μM) was added to 16 μL of Au NPs (15 nm, 5 nM), 20 μL of MgCl2 (1 mM), and 140 μL of water. Then the mixture was reacted overnight in dark. Then 20 μL of CA solutions at various concentrations were added and incubated at room temperature for 30 min. After centrifugation (16![[thin space (1/6-em)]](https://www.rsc.org/images/entities/char_2009.gif) 000 rpm, 10 min), the fluorescence of the supernatant was measured (λex = 485 ± 12 nm, λem = 520 ± 10 nm) using a POLARstar Omega multi-mode microplate reader (BMG LABTECH, Germany).
000 rpm, 10 min), the fluorescence of the supernatant was measured (λex = 485 ± 12 nm, λem = 520 ± 10 nm) using a POLARstar Omega multi-mode microplate reader (BMG LABTECH, Germany).
Statistical methods
MST data were processed by NT Analysis 1.5.41 software. Descriptive statistical analyses were performed using Origin 8.0 for calculating the means and the standard error of the mean. Results were expressed as the mean ± standard deviation (SD).Results and discussions
Fabrication and characterizations of Apt–Au NP
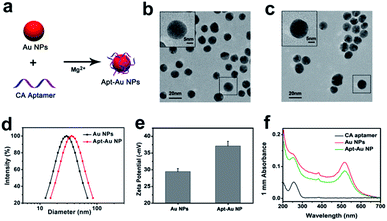
The CA aptamers were synthesized by Sangon Biological Engineering Technology & Co. Ltd (Shanghai, China). The Tm of the aptamer was 70.67 °C. The aggregate MW was detected by Thermo LCQ Deca XP and the result was shown in Fig. S1.† Au NPs were prepared by citrate reduction method at first. Then, CA aptamers and Au NPs were linked together via physical adsorption of Au–nucleoside affinity (Fig. 1a).24,25 During the synthetic procedures of the Apt–Au NP probe, Mg2+ played a vital role in the absorption of ssDNA to negatively charged Au NPs surfaces, as the grown solution of Apt–Au NPs turned purplish red with ∼10 nm LSPR shift in the absence of Mg2+, which was negligible in the group adding Mg2+ (Fig. S2†). Hence, we supposed that moderate Mg2+ could facilitate the adsorption process by charge-shielding effect. TEM images showed that both of Au NPs (Fig. 1b) and Apt–Au NP (Fig. 1c) were spherical and monodisperse with an average size of ∼15 nm. Compared with Au NPs, a thin halo layer was observed around Apt–Au NP from the enlarged image, which was indicative of a successful aptamer adsorption. However, there was a slight particle aggregation in Fig. 1c, which was caused by extra addition of Mg2+ (0.25 mM). DLS data showed that the hydrodynamic diameters of Au NPs and Apt–Au NP were 29.2 ± 0.2 nm and 36.1 ± 1.3 nm respectively (Fig. 1d), and the addition of ssDNA aptamers caused the zeta-potential of Au NPs (Fig. 1e) to change from −29.5 ± 0.91 mV to −37.2 ± 1.4 mV (without CA aptamer adsorption), indicating that the negatively charged nucleic acid has stranded onto the surface of Au NPs. Moreover, the absorption spectra showed that Apt–Au NP possessed the same absorption peak at 520 nm with the bare Au NPs and 260 nm with the ssDNA aptamers (Fig. 1f). The above results, therefore, indicated the successful preparation of CA aptamers modified Au NPs.Adsorption of ssDNA on Au NPs is well known for enhancing the electrostatic repulsion between Au NPs and preventing them from salt-induced aggregation.26,27 Hence, we incubated CA aptamer sequences with Au NPs, and then challenged the Au NPs and Apt–Au NP solution with NaCl (25 mM and 50 mM). As shown in Fig. S3,† aggregation of bare Au NPs happened immediately with color change and there was a platykurtic UV-vis absorption spectrum at 25 mM NaCl solution. The solution turned colorless with visible particulate suspended and the LSPR of Au NPs was faded as NaCl increased to 50 mM, while Au NPs incubated with CA aptamer sequences remained stable and maintained their native burgundy color. Since the stability of the Au NPs was enhanced at salt solution by adsorption of ssDNA on its surface.
Binding of CA to CA aptamer
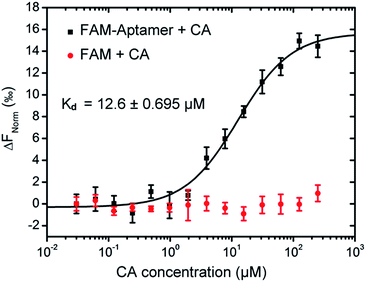
In 2000, Kato28 had screened several DNA aptamers which bind to CA from a pool of approximately 9 × 10¹⁴ DNA molecules by in vitro selection. And the affinity of CA with aptamers was analyzed by the equilibrium-filtration method. Results suggested that the ssDNA with 48 nucleotide length was a better alternative for binding to cholic acid immobilized selection column due to the highest affinity (Kd = 5 μM) and the relatively shorter nucleotide length. We used MST to further validate the binding affinity between CA and aptamer because of its robust and fast analysis. FAM modified CA aptamers were used at a constant concentration of 0.1 μM, and judging from 14 capillaries scan which was carried out before each MST measurement. Any aggregation or strong non-specific binding to the capillary could probably be excluded as it would have yielded a different peak shape (Fig. S4a†). Then we tested the interaction of aptamer with CA. The binding curve was shown in Fig. S4b† and the shape of the MST curves for the FAM labeled aptamer–CA interaction with a calculated Kd of 12.6 ± 0.695 μM (Fig. 2). However, to ensure that no FAM effects contributed to the binding processes, CA was further co-incubated with FAM to analyze the potential interaction, but no apparent binding was observed from the curve. Above all, the specific binding capacity of the CA molecule to the aptamer was fully vindicated, which also implied that in the presence of CA, the aptamer–CA interaction could result in the desorption of aptamers from the surface of Au NPs.Preparation of Apt–Au NP probe
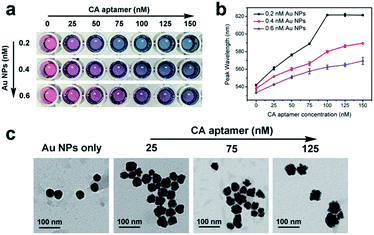
The amount of adsorbed aptamers remaining on the Au NP surface was vital for the morphology change of grown Au NPs and was a highly sensitive barometer of the CA concentration. During the growth analysis of Apt–Au NPs, we found that twice addition of HAuCl4 could achieve better color differentiation with limited aptamers concentration (Fig. S5†). In addition, to obtain a largest LSPR shift of Apt–Au NP probes at the LOD, amounts of added Au NPs and ssDNA were further investigated. As evident in Fig. 3a, after treated with NH2OH·HCl and twice addition of HAuCl4 to proceed the growth reaction, increasing amounts of adsorbed aptamers gave rise to color change from red to blue, and a red shift in the UV-vis spectra of grown Au NPs was observed (Fig. 3b). Notably, a higher Au NPs concentration led to the requirement of more CA aptamer at the same LSPR shift of the grown Au NPs. As the aptamers less than 150 nM, an obvious color gradient was seen with addition of 0.4 nM Au NPs compared with other concentrations, and corresponded to a peak wavelength 590 nm, where the solution turned blue and remained constant. Therefore, we used 0.4 nM Au NPs as a better parameter for fabrication of Apt–Au NPs to detect CA in vitro. Additionally, increasing amounts of adsorbed CA aptamer gave rise to a more irregular shape of grown Au NPs from TEM images (Fig. 3c). These results have shown that grown Apt–Au NP solutions were lyons blue or deep blue when ratios of Au NPs and aptamer were 1![[thin space (1/6-em)]](https://www.rsc.org/images/entities/char_2009.gif) :
:![[thin space (1/6-em)]](https://www.rsc.org/images/entities/char_2009.gif) 250, 1
250, 1![[thin space (1/6-em)]](https://www.rsc.org/images/entities/char_2009.gif) :
:![[thin space (1/6-em)]](https://www.rsc.org/images/entities/char_2009.gif) 312.5 and 1
312.5 and 1![[thin space (1/6-em)]](https://www.rsc.org/images/entities/char_2009.gif) :
:![[thin space (1/6-em)]](https://www.rsc.org/images/entities/char_2009.gif) 375. Therefore, we chose the case of 1
375. Therefore, we chose the case of 1![[thin space (1/6-em)]](https://www.rsc.org/images/entities/char_2009.gif) :
:![[thin space (1/6-em)]](https://www.rsc.org/images/entities/char_2009.gif) 250 to prepare the probe, which can produce the largest LSPR shift at LOD.
250 to prepare the probe, which can produce the largest LSPR shift at LOD.
Detection of CA with Apt–Au NP probe
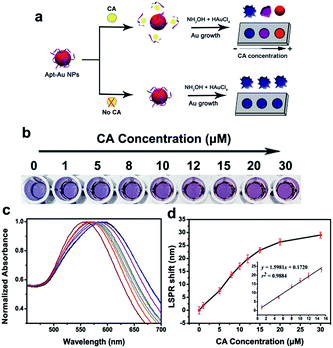
Currently, there are few methods for the detection of bile acids, especially cholic acid. Based on the principle of gold nanoparticle aggregation leading to the color change, Chávez et al. reported a method to detect four kinds of molecules, including cholic acid.29 He et al. reported a liquid crystal based sensors to detect the cholic acid molecule.30 Wu et al. designed a molecularly imprinted photonic hydrogels for CA detection.31 Herein, we designed a simple and fast aptamer–Au NPs biosensor for the in vitro naked eye detection of cholic acid. The above four methods have been compared in Table 1. The mechanism for the colorimetric detection of CA was shown in Fig. 4a. In the presence of CA, specific aptamer–target interaction led to desorption of aptamers from the Au NPs surface. On the NPs, the higher concentration of CA, the lower amounts of adsorbed aptamers. Then, addition of NH2OH·HCl and HAuCl4 will trigger the homogeneous growth of Au NPs, and low aptamer coverage induced formation of the spherical-shaped Au NPs, with resultant red-color solutions. And high aptamer coverage caused grown Au NPs to exhibit a flower-like morphology, with resultant blue-color solutions. In summary, the morphology of grown Au NPs changes from flower-like to spherical NPs with the increasing concentrations of CA, along with a gradient color change of solutions from blue to purple, and finally to red. Such morphological and color changes can be characterized by a LSPR shift of grown Au NPs.| Methods | Advantages | Disadvantages |
|---|---|---|
| Chávez | Convenient; fast | Low sensitivity; LOD was larger than 10 μM; false positive |
| He's | Facile; fast | Interference factors such as pH and ionic strength |
| Wu's | High sensitivity; good specificity; can be recycled | The result cannot be observed visibly |
| Ours | Facile; low-cost; fast; the result can be observed visibly | Interference factor such as similar molecules to CA |
The ratio 1![[thin space (1/6-em)]](https://www.rsc.org/images/entities/char_2009.gif) :
:![[thin space (1/6-em)]](https://www.rsc.org/images/entities/char_2009.gif) 250 of Apt–Au NP probes were adapted to detect CA in vitro. The NH2OH·HCl and two aliquots of HAuCl4 were added to trigger the growth reaction of Apt–Au NP probes after CA samples incubation for 20 min. The increasing CA concentration caused grown Au NPs to change from blue to red gradually (Fig. 4b), accompanied by a corresponding blue shift of the UV-vis spectra (Fig. 4c). Then a dose–response curve could be achieved with the LSPR shift (Fig. 4d). The linear relationship between the CA concentrations and the LSPR shift was shown in the inner Fig. 4d. The linear range was from 1 to 15 μM (r2 = 0.9884).
250 of Apt–Au NP probes were adapted to detect CA in vitro. The NH2OH·HCl and two aliquots of HAuCl4 were added to trigger the growth reaction of Apt–Au NP probes after CA samples incubation for 20 min. The increasing CA concentration caused grown Au NPs to change from blue to red gradually (Fig. 4b), accompanied by a corresponding blue shift of the UV-vis spectra (Fig. 4c). Then a dose–response curve could be achieved with the LSPR shift (Fig. 4d). The linear relationship between the CA concentrations and the LSPR shift was shown in the inner Fig. 4d. The linear range was from 1 to 15 μM (r2 = 0.9884).
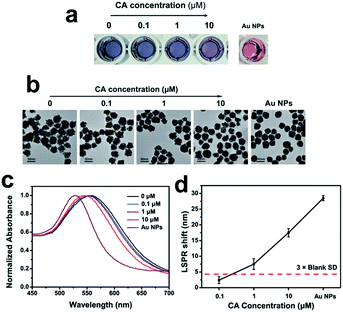
To further study the detection limit of CA, we set another group with different CA concentration (0, 0.1, 1 and 10 μM). The increasing CA concentration caused grown Au NPs (Fig. 5a). Additionally, increasing amounts of CA concentration gave rise to a more regular shape of grown Au NPs from TEM images (Fig. 5b). The UV-vis spectra was shown in Fig. 5c. The LOD was determined to 1 μM by reference to 3 times the blank SD (Fig. 5d). The detection limit can be improved by decreasing the particle size of gold nanoparticles and adjusting the ratio of Au nanoparticles and aptamers.
To further confirm that the 1![[thin space (1/6-em)]](https://www.rsc.org/images/entities/char_2009.gif) :
:![[thin space (1/6-em)]](https://www.rsc.org/images/entities/char_2009.gif) 250 ratios of Au NPs and aptamers was the best choice for CA detection, the ratios 1
250 ratios of Au NPs and aptamers was the best choice for CA detection, the ratios 1![[thin space (1/6-em)]](https://www.rsc.org/images/entities/char_2009.gif) :
:![[thin space (1/6-em)]](https://www.rsc.org/images/entities/char_2009.gif) 312.5 and 1
312.5 and 1![[thin space (1/6-em)]](https://www.rsc.org/images/entities/char_2009.gif) :
:![[thin space (1/6-em)]](https://www.rsc.org/images/entities/char_2009.gif) 375 were set as controlling experiments. In the case of 1
375 were set as controlling experiments. In the case of 1![[thin space (1/6-em)]](https://www.rsc.org/images/entities/char_2009.gif) :
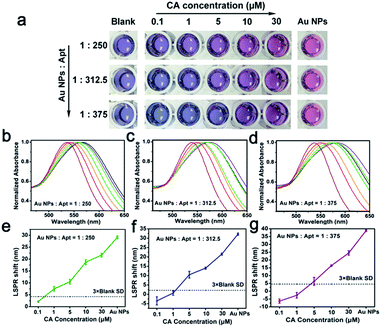
:![[thin space (1/6-em)]](https://www.rsc.org/images/entities/char_2009.gif) 250, increasing CA concentration caused grown Au NPs to change from blue to red gradually (Fig. 6a), accompanied by a corresponding blue shift of the UV-vis spectra (Fig. 6b). Then a dose–response curve could be achieved with the LSPR shift (Fig. 6e), from which the LOD was determined to 1 μM by reference to 3 times the blank SD. However, it is worth noting that larger amounts of aptamers led to lower detection sensitivity of CA. From the colorimetric results, a Apt–Au NP with ratio of 1
250, increasing CA concentration caused grown Au NPs to change from blue to red gradually (Fig. 6a), accompanied by a corresponding blue shift of the UV-vis spectra (Fig. 6b). Then a dose–response curve could be achieved with the LSPR shift (Fig. 6e), from which the LOD was determined to 1 μM by reference to 3 times the blank SD. However, it is worth noting that larger amounts of aptamers led to lower detection sensitivity of CA. From the colorimetric results, a Apt–Au NP with ratio of 1![[thin space (1/6-em)]](https://www.rsc.org/images/entities/char_2009.gif) :
:![[thin space (1/6-em)]](https://www.rsc.org/images/entities/char_2009.gif) 312.5 and 1
312.5 and 1![[thin space (1/6-em)]](https://www.rsc.org/images/entities/char_2009.gif) :
:![[thin space (1/6-em)]](https://www.rsc.org/images/entities/char_2009.gif) 375 caused the grown Au NPs solution bluer compared with the blank after adding a small amount of CA, and a red shift of the UV-vis spectra was witnessed (Fig. 6c and d), which produced a higher LOD (5 μM for 1
375 caused the grown Au NPs solution bluer compared with the blank after adding a small amount of CA, and a red shift of the UV-vis spectra was witnessed (Fig. 6c and d), which produced a higher LOD (5 μM for 1![[thin space (1/6-em)]](https://www.rsc.org/images/entities/char_2009.gif) :
:![[thin space (1/6-em)]](https://www.rsc.org/images/entities/char_2009.gif) 312.5 and 10 μM for 1
312.5 and 10 μM for 1![[thin space (1/6-em)]](https://www.rsc.org/images/entities/char_2009.gif) :
:![[thin space (1/6-em)]](https://www.rsc.org/images/entities/char_2009.gif) 375, Fig. 6f and g). Therefore, 1
375, Fig. 6f and g). Therefore, 1![[thin space (1/6-em)]](https://www.rsc.org/images/entities/char_2009.gif) :
:![[thin space (1/6-em)]](https://www.rsc.org/images/entities/char_2009.gif) 250 was the optimal ratio of Apt–Au NP for CA detection.
250 was the optimal ratio of Apt–Au NP for CA detection.
Initially, the morphology of grown Apt–Au NPs was highly irregular. As the concentration of CA increased, grown Apt–Au NPs became more spherical, with an increasingly smooth surface. And grown Apt–Au NPs in the solution containing 10 μM CA displayed a spherical morphology and appeared more similar to grown Au NPs without aptamer adsorption. Hence, LSPR shift of the solution was due to localized low-energy plasmon at the tips of the flower-like morphology rather than particle aggregation along with the particle diameter analysis of grown Apt–Au NP (Fig. S6†). Moreover, free aptamers did not influence the growth reaction as well from the control experiment (Fig. S7†).
To determine the desorption process of aptamers on the surface of Au NPs via aptamer–target affinity, we used a fluorophore (FAM) labeled CA aptamer for Apt–Au NP preparation. The fluorescence analysis showed that the addition of CA to the Apt–Au NP probe caused aptamer desorption from the Au NP surface (Fig. S8a†). Increasing concentrations of CA caused fluorescence recovery of FAM, before that, the fluorescence of FAM-labeled CA aptamer absorbed on Au NPs was quenched by FRET effect.32,33 To eliminate the influence of pH on the fluorescence intensity, FAM-Apt was treated with increasing concentrations of CA solution, and the change of fluorescence intensity was determined by a multi-mode microplate reader. As shown in Fig. S8b,† CA in water solution was acidulous and the pH tailed off to 87% compared with double distilled water as 10 μM. Correspondingly, fluorescence intensity of FAM-Apt declined 14% (Fig. S8c†) owing to the cationic, neutral and anionic forms of fluorescein in aqueous solution,34,35 which was weaker than the desorption effect. Furthermore, in order to investigate the possibility of nonspecific interactions between CA and Au NPs, the Au NP growth reaction was conducted after incubating bare Au NPs with different concentrations of CA. It showed negligible LSPR shifts (Fig. S9†) of re-growth particles even at the highest CA concentration (10 μM), indicating that CA did not affect the re-growth of Apt–Au NP. For control, the solution became dark in blue after addition of complementary DNA sequence of CA aptamer (Fig. S10†), indicating that the complementary sequence hybridized to the aptamer and increased the amount of total DNA absorbed on the Au NPs surface, which induced more irregular growth of Au NPs. These results demonstrated that only addition of targets could cause the desorption of aptamers from the surface of Au NPs via aptamer–target binding.
Selectivity of detection
Four fairly similar molecules from the family of bile acid were detected as well to testify the specificity of the sensor (DCA, CDCA, GCA and LCA, structures shown in Fig. S11†). A similar phenomenon (Fig. S12†) of color change and LSPR shift as different concentrations of the family of bile acid were added to the Apt–Au NP probes. Increasing the concentration of DCA and CDCA caused grown Au NPs to change from blue to red color, accompanied by a corresponding blue shift (∼25 nm) of LSPR spectra. And GCA by contrast, was shown a lower response by the probe with ∼16 nm LSPR shift at high concentration (10 μM). Nevertheless, even much lower sensitivity was observed at higher LCA concentrations (10 μM) both from color and LSPR results. The selectivity can be enhanced by using aptamer with stronger affinity for cholic acid.Conclusions
In summary, we have demonstrated a versatile gold nanoprobe for rapid colorimetric detection of CA based on the aptamer–target recognition and the aptamer controlled growth of Au NPs. In this work, we could visually detect as low as 1 μM CA in an hour without any sophisticated instrument or highly qualified personnel. The LOD was lower than the physiological limits of CA and the sensitivity was higher than the existing colorimetric detection method for CA based on Au NPs, which was resulted from the mechanism that even small differences in the amount of adsorbed aptamer could produce morphologically significant variations in grown Au NPs with visible color changes and obvious LSPR shifts. Furthermore, we verified the affinity between CA and 48 nt aptamer (Kd = 12.6 ± 0.695 μM) for the first time by MST technology, which is reconcilable compared with the results from equilibrium-filtration method as reported. This research shows that nanoprobe can detect an array of bile acids rapidly and making it applicable for combined diagnosis. Given the advantages of colorimetric assay based on Au NPs, the assay is well-poised as a POC tool for the naked eye detection of CA.Notes
The authors declare no competing financial interest.Acknowledgements
The authors are grateful to National Basic Research Program of China 973 Program Grant No 2015CB755500 and Natural Science Foundation Committee of China (NSFC 81220108012, 61335007, 81371684, 81000666, 81171395 and 81328012) for their financial support.Notes and references
- S. Mukhopadhyay and U. Maitra, Curr. Sci., 2004, 87, 1666–1683 CAS.
- C. Huang, Y. Guo and J. Yuan, Poult. Sci., 2014, 93, 1475–1483 CrossRef CAS PubMed.
- K. Rani, P. Garg and C. S. Pundir, Anal. Biochem., 2004, 332, 32–37 CrossRef CAS PubMed.
- W. J. Griffiths and J. Sjovall, J. Lipid Res., 2010, 51, 23–41 CrossRef PubMed.
- I. Burkard, A. von Eckardstein and K. M. Rentsch, J. Chromatogr. B: Anal. Technol. Biomed. Life Sci., 2005, 826, 147–159 CrossRef CAS PubMed.
- Y. Wang, J. Zhang, X. X. Zhu and A. Yu, Polymer, 2007, 48, 5565–5571 CrossRef CAS.
- S. He, W. Liang, C. Tanner, K.-L. Cheng, J. Fang and S.-T. Wu, Anal. Methods, 2013, 5, 4126–4130 RSC.
- K. M. Mayer and J. H. Hafner, Chem. Rev., 2011, 111, 3828–3857 CrossRef CAS PubMed.
- Y. Zhang, Y. Tang, Y. H. Hsieh, C. Y. Hsu, J. Xi, K. J. Lin and X. Jiang, Lab Chip, 2012, 12, 3012–3015 RSC.
- E. Hutter and J. H. Fendler, Adv. Mater., 2004, 16, 1685–1706 CrossRef CAS.
- W. Zhou, X. Gao, D. Liu and X. Chen, Chem. Rev., 2015, 115, 10575–10636 CrossRef CAS PubMed.
- S. J. Chen, Y. F. Huang, C. C. Huang, K. H. Lee, Z. H. Lin and H. T. Chang, Biosens. Bioelectron., 2008, 23, 1749–1753 CrossRef CAS PubMed.
- F. Xia, X. Zuo, R. Yang, Y. Xiao, D. Kang, A. Vallée-Bélisle, X. Gong, J. D. Yuen, B. B. Hsu and A. Heeger, Proc. Natl. Acad. Sci. U. S. A., 2010, 107, 10837–10841 CrossRef CAS PubMed.
- D. Liu, J. Yang, H. F. Wang, Z. Wang, X. Huang, Z. Wang, G. Niu, A. R. Hight Walker and X. Chen, Anal. Chem., 2014, 86, 5800–5806 CrossRef CAS PubMed.
- J. N. Anker, W. P. Hall, O. Lyandres, N. C. Shah, J. Zhao and R. P. Van Duyne, Nat. Mater., 2008, 7, 442–453 CrossRef CAS PubMed.
- M. J. Taussig, O. Stoevesandt, C. A. Borrebaeck, A. R. Bradbury, D. Cahill, C. Cambillau, A. de Daruvar, S. Dübel, J. Eichler and R. Frank, Nat. Methods, 2007, 4, 13–17 CrossRef CAS PubMed.
- E. J. Cho, J. W. Lee and A. D. Ellington, Annu. Rev. Anal. Chem., 2009, 2, 241–264 CrossRef CAS PubMed.
- J. Wang, Q. Gong, N. Maheshwari, M. Eisenstein, M. L. Arcila, K. S. Kosik and H. T. Soh, Angew. Chem., 2014, 53, 4796–4801 CrossRef CAS PubMed.
- J. Wang, J. Lu, S. Su, J. Gao, Q. Huang, L. Wang, W. Huang and X. Zuo, Biosens. Bioelectron., 2015, 65, 171–175 CrossRef CAS PubMed.
- H. Jiao, J. Chen, W. Li, F. Wang, H. Zhou, Y. Li and C. Yu, ACS Appl. Mater. Interfaces, 2014, 6, 1979–1985 CAS.
- F. Wang, S. Liu, M. Lin, X. Chen, S. Lin, X. Du, H. Li, H. Ye, B. Qiu, Z. Lin, L. Guo and G. Chen, Biosens. Bioelectron., 2015, 68, 475–480 CrossRef CAS PubMed.
- Z. Wang, J. Zhang, J. M. Ekman, P. J. Kenis and Y. Lu, Nano Lett., 2010, 10, 1886–1891 CrossRef CAS PubMed.
- J. H. Soh, Y. Lin, S. Rana, J. Y. Ying and M. M. Stevens, Anal. Chem., 2015, 87, 7644–7652 CrossRef CAS PubMed.
- J. J. Storhoff, R. Elghanian, C. A. Mirkin and R. L. Letsinger, Langmuir, 2002, 18, 6666–6670 CrossRef CAS.
- M. Östblom, B. Liedberg, L. M. Demers and C. A. Mirkin, J. Phys. Chem. B, 2005, 109, 15150–15160 CrossRef PubMed.
- Z. D. Liu, H. Y. Zhu, H. X. Zhao and C. Z. Huang, Talanta, 2013, 106, 255–260 CrossRef CAS PubMed.
- H. Li and L. J. Rothberg, J. Am. Chem. Soc., 2004, 126, 10958–10961 CrossRef CAS PubMed.
- T. Kato, T. Takemura, K. Yano, K. Ikebukuro and I. Karube, Biochim. Biophys. Acta, Gen. Subj., 2000, 1493, 12–18 CrossRef CAS.
- J. L. Chávez, J. K. Leny and S. Witt, Analyst, 2014, 139, 6214–6222 RSC.
- S. He, W. Liang and C. Tanner, Anal. Methods, 2013, 5, 4126–4130 RSC.
- Z. Wu, X. Hu and C. Tao, J. Mater. Chem., 2008, 18, 5452–5458 RSC.
- L. Stryer and R. P. Haugland, Proc. Natl. Acad. Sci. U. S. A., 1967, 58, 719–726 CrossRef CAS.
- K. Saha, S. S. Agasti, C. Kim, X. Li and V. M. Rotello, Chem. Rev., 2012, 112, 2739–2779 CrossRef CAS PubMed.
- W. Shi, S. He, M. Wei, D. G. Evans and X. Duan, Adv. Funct. Mater., 2010, 20, 3856–3863 CrossRef CAS.
- R. Sjöback, J. Nygren and M. Kubista, Spectrochim. Acta, Part A, 1995, 51, L7–L21 CrossRef.
Footnotes |
| † Electronic supplementary information (ESI) available: Synthesis, photo physical, and experiments additional figures and images (Fig. S1–S11). See DOI: 10.1039/c7ra00255f |
| ‡ These authors contributed equally. |
| This journal is © The Royal Society of Chemistry 2017 |

