
 Open Access Article
 This Open Access Article is licensed under a
 Creative Commons Attribution 3.0 Unported Licence
Facile preparation of a Na2MnSiO4/C/graphene composite as a high performance cathode for sodium ion batteries†
Hai Zhu,
Juntao Wang,
Xiaoling Liu and
Xiaoming Zhu *
*
R & D Center for Non-power Nuclear Technology, School of Nuclear Technology and Chemistry & Biology, Hubei University of Science and Technology, Xianning 437100, China. E-mail: energy603@163.com
First published on 2nd March 2017
Abstract
A new class of Na2MnSiO4/carbon/graphene (Na2MnSiO4/C/G) composite is successfully prepared and investigated for use as a cathode material for Na ion batteries. X-ray diffraction confirms that formation of a monoclinic structure with Pn space group. Morphological characterization shows that Na2MnSiO4 nanoparticles, about 30–40 nm in size with high density, are homogeneously anchored on the whole surface of the crumpled micrometer-size graphene nanosheets. The sodium insertion–extraction process of Na2MnSiO4 is similar to that of Li2MnSiO4 as a cathode in Li ion batteries. Compared with the Na2MnSiO4/C composite, the Na2MnSiO4/C/G composite shows much better electrochemical performance, including excellent rate performance and capacity retention. At the rate of 0.1C (1C = 139 mA h g−1), the discharge capacity of the initial cycle is 182.4 mA h g−1, corresponding to 1.31 Na+ insertion per Na2MnSiO4 molecule. Even at high rates of 1C, 2C and 5C, the composite exhibits discharge capacities of 106.9, 80.3 and 60.7 mA h g−1, respectively. The enhanced electrochemical performance arises from the conductive graphene nanosheets, which facilitate the electronic conductivity of the composite, improve the contact area for the electrode/electrolyte interface and decrease the particles sizes of Na2MnSiO4, as well as can reduce the diffusion length of Na+ ions.
1. Induction
Recently, in order to solve the problem of energy shortage and environmental pollution, rechargeable batteries for large-scale electrical storage applications have been developed rapidly.1,2 With high power density, high energy conversion efficiency and long cycling life, lithium ion batteries have been widely considered to be one of the most promising electrochemical secondary battery technologies.3,4 However, there are still several significant challenges for its further development due to the shortage of the limited lithium resource and safety issues. In contrast to lithium ion batteries, sodium ion batteries have many advantages, such as more abundant resources, lower cost, better safety performance and sodium's physical and chemical properties are similar to those of Li.5–7 Therefore, sodium ion batteries have gained increased recognition as a reasonable candidate to replace lithium ion batteries for energy conversion and storage systems.So far, many sodium ion based materials have been investigated to develop desirable cathode materials for sodium ion batteries. Among the compounds, most of the studies are focused on the layered compounds (NaxCoO2,8,9 NaxMnO2,10,11 NaFeO2,12 Na2/3Co2/3Mn1/3O2,13) and polyanionic compounds (Na3V2(PO4)3,14,15 NaFePO4,16 Na2Fe2(SO4)3 (ref. 17)). Although the layered compounds with unique layered structure is conducive to Na+ insertion/extraction and these materials as Na ion storage materials with high capacities and voltage platform, their capacity retention capability is unsatisfactory. For instance, Morales et al.18 showed the layered P2-Na0.6MnO2 with an initial discharge capacity of 150 mA h g−1, but its capacity retention is less than 50% after only 10 cycles. In general, polyanionic compounds exhibit better capacity retention and thermal stability than the layered transition metal oxides because of their structural diversity and stability. However, polyanion cathode materials are facing the problems of poor capacity and rate capability for large-scale grid applications.
More recently, Na2MSiO4 (M = Fe, Mn) has also been identified as potential electroactive cathode material due to its high theoretical capacity (>270 mA h g−1 is possible when extracting two Na+ ions per molecule), low cost, high operating potential and structural robustness. However, as a promising cathode material for sodium ion batteries, Na2MSiO4 also suffers from poor electrical conductivity due to the polyanion structure. To date, only a few reports have been published for electrochemical characterization of Na2MSiO4 in sodium ion batteries. Zhang et al.19 synthesized Na2FeSiO4 from Li2FeSiO4 undergo the electrochemical Li–Na ion exchange process, which could deliver a specific capacity as high as 330 mA h g−1 in the Na cells at the current density of 10 mA g−1 and at room temperature. Chen et al.20 synthesized Pn phase Na2MnSiO4 by a sol–gel method, and demonstrated the composite with discharge capacity of 125 mA h g−1 for the battery operate at 13.9 mA g−1 and 363 K. However, for Na2MnSiO4, there is still no scientific report in literature about the usage of graphene, and no reports of the Na+ ion migration dynamics on Pn phase Na2MnSiO4 as cathode for sodium ion batteries.
In this study, we have synthesized Na2MnSiO4/C/G composite by a sol–gel method and the electrochemical characteristics of the composite were investigated. As a cathode material for sodium ion batteries, the Na2MnSiO4/C/G composite can deliver discharge capacities of above 180 mA h g−1 at the rate of 0.1C (13.9 mA g−1) at room temperature, and it has higher rate performance and better capacity retention compare with other products of Na2MnSiO4/C which were prepared without graphene nanosheets. The much improved electrochemical properties is ascribed to the good conductivity and high special surface area of graphene, which can prominently enhance the electronic conductivity of the cathode material. Moreover, the adding of graphene oxide in the synthesis process could decrease the particles sizes of Na2MnSiO4 and prevent the aggregation of nanoparticles, the homogeneous dispersion and nanoscale size of particles can shorten the migration path of Na+ ion.
2. Experimental
2.1 Materials synthesis
The Na2MnSiO4/C/G composite was prepared though a facile sol–gel method and subsequent annealing. The graphene oxide (GO) nanosheets were obtained by a modified Hummers' method.21 In a typical synthesis, 60 mg GO was firstly dispersing in 30 mL deionized water via ultrasonication, and then 1 g glucose, 4 mmol CH3COONa and 2 mmol Mn(CH3COO)2·4H2O were added, dissolved. Subsequently, the solution of 2 mmol tetraethyl orthosilicate (TEOS, CP) and 20 mL isopropanol was added into the previously mixed solution. Under continuous stirring, the pH was adjusted to a value lower than 4.0 by addition of acetic acid and the temperature of the solution was heated to 70 °C to evaporate the solvent. The resulting dry gel was ground with a mortar and then calcined in a furnace tube at 650 °C (at a rate of 2 °C min−1) for 10 h in flowing argon, Na2MnSiO4/C/G composite was obtained. For comparison, the same synthesis procedure was used to prepared Na2MnSiO4/C composite except that GO was not added and the amount of glucose was increased to 2 g.2.2 Materials characterizations
The crystalline structures of the samples were characterized by the X-ray diffractometer (XRD, Bruker D8 Advance, Cu Kα radiation, λ = 0.15418 nm). The Raman spectra was carried out on a Renishaw 2000 model confocal Raman micro-spectroscope with 636 nm line of a He–Ne laser radiation in the range of 400–2000 cm−1. The morphologies and compositions of the samples were observed with a scanning electron microscopy (SEM, SIRION, FEI, USA) and transmission electron microscopy (TEM, JEM-2001F, JEOL, operating at 200 kV). Elemental analyzer (Elementar Analysen System GmbH, Germany) were conducted to measure the value of the carbon contents in the composites. The carbon contents of Na2MnSiO4/C/G and Na2MnSiO4/C composites are 23.1% and 22.9%, respectively. Thermal gravimetric analysis (TGA) experiment was performed on a Netzsch STA409 (heating rate = 10 °C min−1, 30 to 1000 °C, air flow).2.3 Electrochemical measurements
The electrochemical properties of Na-based electrode materials were carried out using a coin type cell (CR2016) at room temperature. The working electrodes were fabricated by mixing the 75 wt% of active materials, 20 wt% of acetylene black and 5 wt% of polyvinylidene fluoride (PVDF) binder and then spread onto stainless steel meshes that were used as the current collectors and dried at 60 °C for 12 h. Na metal foil was used as the counter electrode. The electrolyte was based on 1 M NaClO4 dissolved in a mixture of propylene carbonate (PC) and fluoro ethylene carbonate (FEC) (1![[thin space (1/6-em)]](https://www.rsc.org/images/entities/char_2009.gif) :1 by volume) solvents. The Celgard 2500 microporous film was used as separator. The cells were assembled in a glove box filled with high purity argon gas. Galvanostatic charge and discharge measurements were tested at different current densities on a battery test system (Neware, Shenzhen, China) in the voltage window of 1.5–4.2 V (vs. Na+/Na) at room temperature. All the charge–discharge specific capacities mentioned in this paper were calculated on the net weight of Na2MnSiO4 by excluding other materials contents. Electrochemical impedance spectroscopy (EIS) were conducted using an electrochemistry workstation (CHI 660C) by applying an alternating-current signal amplitude of 10 mV in the frequency range from 100 kHz to 0.1 Hz.
:1 by volume) solvents. The Celgard 2500 microporous film was used as separator. The cells were assembled in a glove box filled with high purity argon gas. Galvanostatic charge and discharge measurements were tested at different current densities on a battery test system (Neware, Shenzhen, China) in the voltage window of 1.5–4.2 V (vs. Na+/Na) at room temperature. All the charge–discharge specific capacities mentioned in this paper were calculated on the net weight of Na2MnSiO4 by excluding other materials contents. Electrochemical impedance spectroscopy (EIS) were conducted using an electrochemistry workstation (CHI 660C) by applying an alternating-current signal amplitude of 10 mV in the frequency range from 100 kHz to 0.1 Hz.
3. Results and discussion
The crystal structures and phase composition of the as-prepared samples were examined by the XRD pattern, as shown in Fig. 1. As can be seen, the same characteristic peaks in the curves of Na2MnSiO4/C/G and Na2MnSiO4/C composites can be perfectly assigned to the monoclinic Pn structure of Na2MnSiO4 (JCPDS No. 55-0638), which is consistent with that obtained by Duncan et al.22 (S.G. Pn, a = 6.9637 Å, b = 5.6101 Å, c = 5.2988 Å, and β = 89.780°). In addition, a minor impurity phase of manganese oxides can be found in the as-prepared composites. Compared with the XRD pattern of Na2MnSiO4/C, the diffraction peaks of the Na2MnSiO4/C/G composite appeared much weaker and broader, indicating that the Na2MnSiO4 crystals in the Na2MnSiO4/C/G is smaller than the crystals in the Na2MnSiO4/C due to the existence of graphene. Calculations using Scherrer formula (D = kλ/(Bcosθ), where k is 0.89) revealed the average grain sizes are ∼40 and ∼150 nm for the Na2MnSiO4/C/G and Na2MnSiO4/C composites, respectively. In addition, no peaks of graphene are detected in the XRD pattern of Na2MnSiO4/C/G owing to the Na2MnSiO4 at 2θ ≈ 26° will also appear an diffraction peak, which overlap with the diffraction peak of graphene.
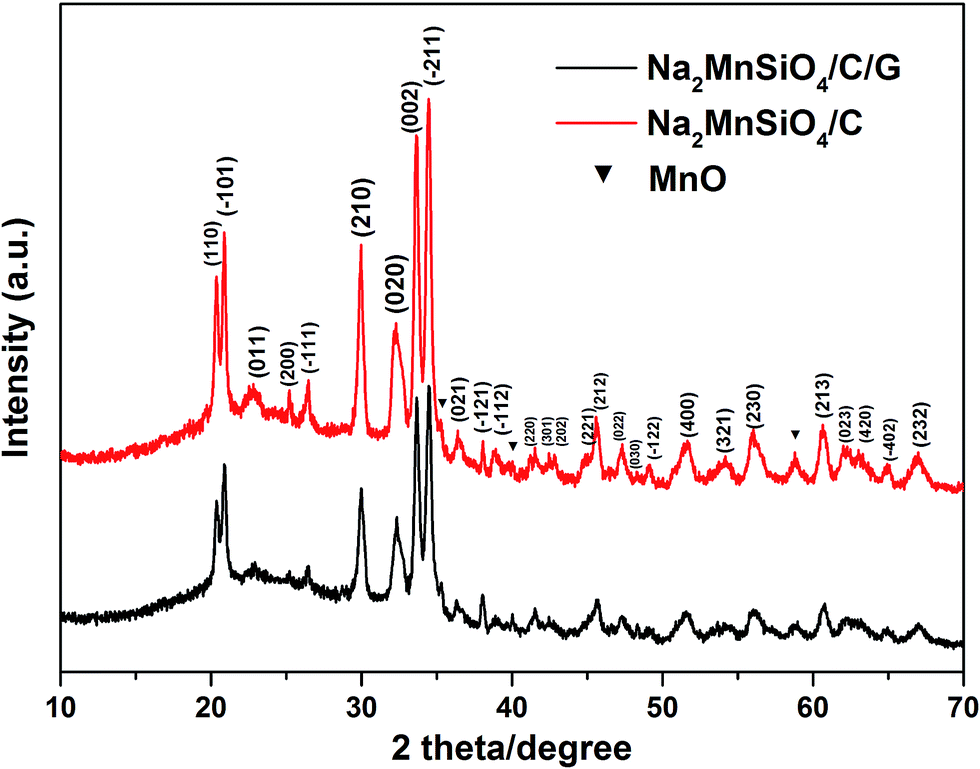 | ||
| Fig. 1 The XRD patterns of the Na2MnSiO4/C/G and Na2MnSiO4/C composites. | ||
Raman spectra was performed to further confirm the degree of crystallinity of the carbon in the composites.23 The Raman spectrum of the Na2MnSiO4/C/G (Fig. 2) gives two bands and can be further deconvoluted into four Gaussian bands at 1604, 1532, 1350, 1261 cm−1, which further evaluate the presence of graphene and carbon layer. The two characteristic peaks are observed at around 1350 and 1604 cm−1 corresponding to the characteristic D and G bands of carbons, respectively. The D band is assigned to defects and disordered portions of sp3 carbon, and the G band is indicated to the ordered sp2 carbon network in the composites. The peak intensity ratio between the D and G bands (ID/IG) can be used to evaluate the degree of ordering in carbon materials, with a lower ratio of ID/IG corresponding to a higher degree of ordering.24 The ID/IG ratio for the Na2MnSiO4/C/G composite is found to be 0.84, demonstrating the existence of carbon coating layer and graphene in the Na2MnSiO4/C/G composite is fairly ordered.
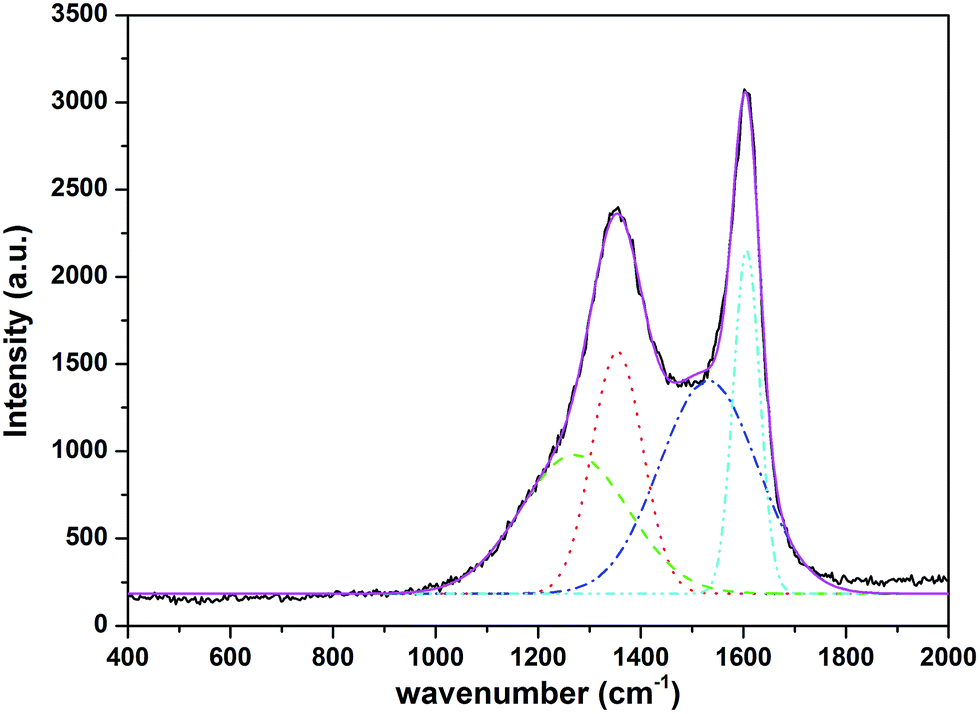 | ||
| Fig. 2 The Raman spectrum of the Na2MnSiO4/C/G composite. | ||
Morphological features of the as-obtained samples were investigated and the SEM and TEM images are provided in Fig. 3. The SEM image (Fig. 3a) of the obtained Na2MnSiO4/C/G composite reveals Na2MnSiO4 nanoparticles are scattered on the surface of the graphene layer. Meanwhile, the TEM analysis (Fig. 3b) indicates that Na2MnSiO4 nanoparticles of about 30–40 nm in size with high density, which are homogeneously anchored on the whole surface of the crumpled micrometer-size graphene sheets. In contrast, as seen in Fig. 3c and d, the Na2MnSiO4/C consists of irregular congregated particles with size of 100–200 nm, which is larger than that of Na2MnSiO4/C/G and is not well distributed. It is demonstrated that the adding of GO nanosheets into the synthesis precursor solution could decrease the particle size and inhibit the aggregation of the Na2MnSiO4 nanoparticles. This may be due to a lot of oxygen functional groups are located on the surfaces of GO nanosheets, providing electrostatic forces to adsorb positively charged ions and hinder the diffusion of small molecules. The oxygen-containing defect sites of graphene nanosheets limit the size and agglomeration of the Na2MnSiO4 crystal particles during the crystallizing process.25 As seen in Fig. S1a,† the particle size of Na2MnSiO4/G (Na2MnSiO4/G prepared with only GO) is about 45 nm, which is closed to the size of Na2MnSiO4/G. When the Na2MnSiO4/C prepared with the same amount of glucose to Na2MnSiO4/C/G, it can be seen from the TEM image in Fig. S1b† that the Na2MnSiO4/C particles with size in the range of 150–300 nm. The above results further confirming that the adding of GO nanosheets into the precursor solution could decrease the particle size.
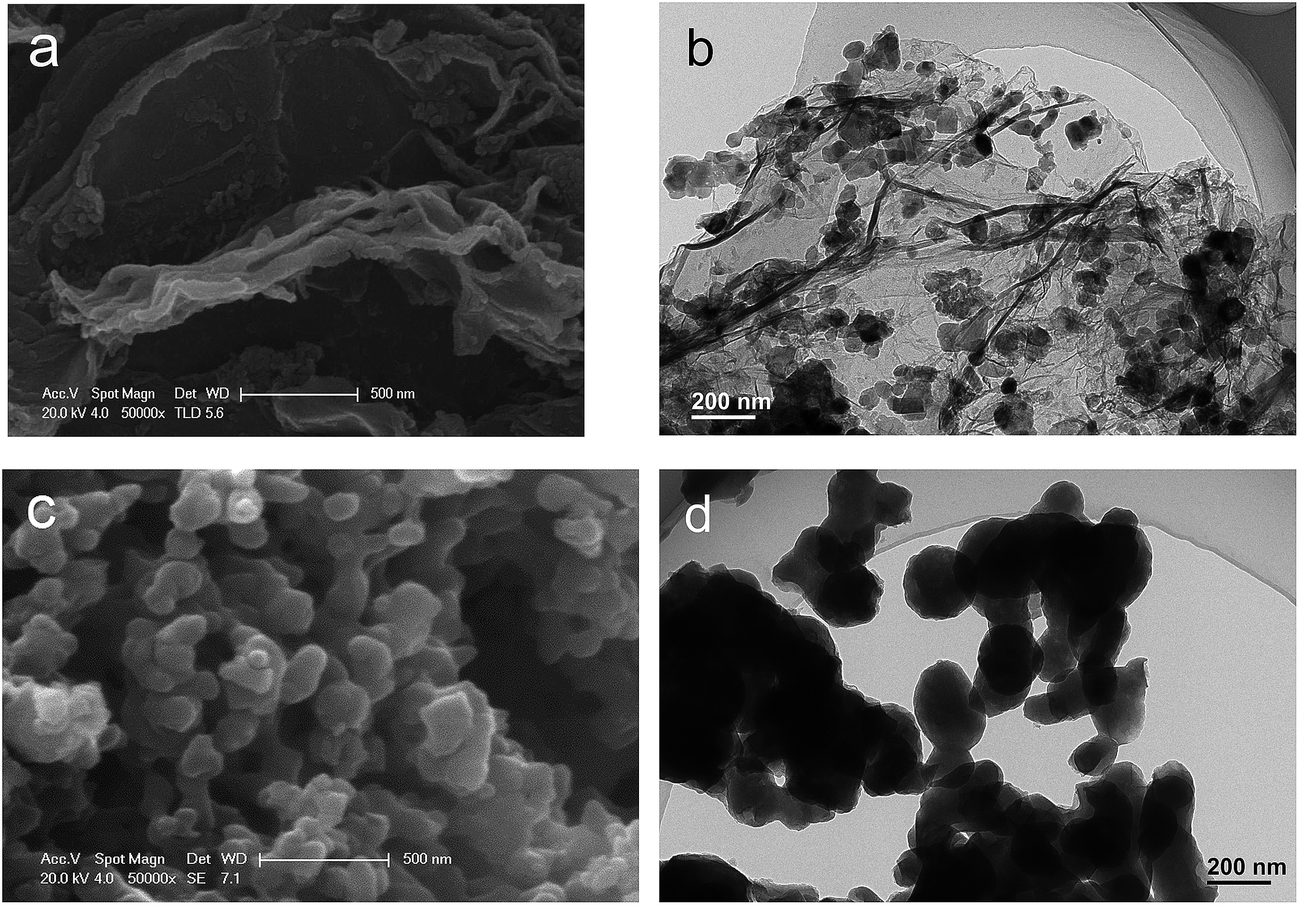 | ||
| Fig. 3 Morphological features of the as-obtained samples: SEM (a) and TEM (b) images for Na2MnSiO4/C/G composite; SEM (c) and TEM (d) images for Na2MnSiO4/C composite. | ||
The Na2MnSiO4/C/G composite is selected for further investigation by TEM and high resolution TEM (HRTEM). TEM image (Fig. 4a) at higher magnification clearly reveal that the Na2MnSiO4 nanoparticles are confined in between the graphene nanosheets to form a sandwich structure. The HRTEM image (Fig. 4b) focused on an individual Na2MnSiO4 nanoparticle anchored on graphene nanosheets. The regular lattice fringes of the nanoparticle can be clearly seen and the lattice spacing is measured to be 0.266 nm (the lower inset in Fig. 4b), corresponding to the interplanar distance of the (002) lattice plane of Pn phase Na2MnSiO4. This can also be validated according to the diffraction spots of Na2MnSiO4 by the corresponding fast Fourier transform (FFT) image (the top inset in Fig. 4b). Meanwhile, both the graphene nanosheets and the thin carbon coating layer around the particle can be clearly observed, the layer-by-layer feature is obviously discernable. In this kind of structure, the double carbon layer may be beneficial to enhance the surface electronic conductivity of the composite. The carbon content in these samples was also determined via thermal gravimetric analysis (TGA), as shown in Fig. S2.† In theory, the thermal decomposition of the pure Na2MnSiO4 will suffered from a weight increase from 100% to 103.3% in air, because of the decomposition of the material to produce Na2O, Mn3O4 and SiO2. According to the TGA results, the weight content of carbon in the Na2MnSiO4/C/G and Na2MnSiO4/C composites are calculated to be 24.9% and 23.4%, respectively.
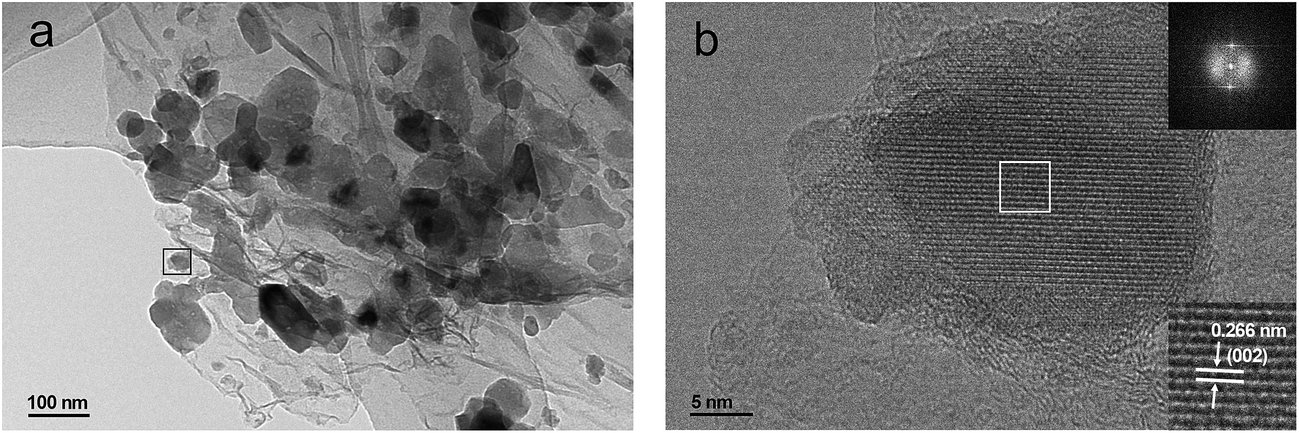 | ||
| Fig. 4 The TEM (a) and high-resolution TEM (b) images of the Na2MnSiO4/C/G composite. | ||
The electrochemical properties of the as-prepared composites were evaluated in the sodium ion batteries configuration in the voltage range of 1.5–4.2 V (vs. Na+/Na) at room temperature. Fig. 5 compares the typical charge–discharge curves of the Na2MnSiO4/C/G and Na2MnSiO4/C electrodes at a rate of 0.1C (1C = 139 mA h g−1) in the initial 5 cycles. As presented in Fig. 5a, the first charge curve of Na2MnSiO4/G/C with a long voltage plateau region around 3.2 V, and it has been slowly rising up to 4.2 V, which can be ascribed to the initial oxidation of Mn2+ to Mn3+ and Mn4+, and the irreversible decomposition of partial electrolyte.26,27 Meanwhile, the first charge and discharge capacities are 260.8 and 182.4 mA h g−1, respectively, with a coulombic efficiency of 70.04%. The irreversible capacity loss can be attributed to the formation of solid electrolyte interphase (SEI) layer, as well as the decomposition of electrolyte under the high voltage. Similar to Li2MnSiO4, the succeeding charge plateau of Na2MnSiO4 was obviously lower than the initial one, which suggested that a structural rearrangement might occur during the initial charge process.28–30 It is mentioning noting that the discharge capacities of Na2MnSiO4/C/G composite in initial 5 cycles are 182.4, 169.2, 167.3, 165.2 and 160.4 mA h g−1, corresponding to 1.31, 1.22, 1.20, 1.18 and 1.15 Na+ insertion per Na2MnSiO4 molecule, respectively. In the case of the Na2MnSiO4/C (Fig. 5b), although the trend of charge–discharge curves of Na2MnSiO4/C is similar to that of Na2MnSiO4/C/G, the discharge capacities of the Na2MnSiO4/C electrode is much lower than the counterparts in the case of the Na2MnSiO4/C/G electrode. For the Na2MnSiO4/C composite, the discharge capacities in initial 5 cycles are 114.9, 101.1, 91.9, 85.3 and 80.5 mA h g−1, respectively, which are 63.0%, 59.7%, 54.9%, 51.7% and 50.1%, respectively, of the discharge capacities in the same cycles for the Na2MnSiO4/C/G composite. The cycling performances of the Na2MnSiO4/C/G and the Na2MnSiO4/C composites at 0.1C are showed in Fig. S3.† As can be seen, after being charge–discharge 100 times, the capacity retention of the Na2MnSiO4/C/G composite can still maintain at 44.7% while it is only 23.6% for the Na2MnSiO4/C composite. Furthermore, for both composites, the discharge capacities decreased with the increasing cycle times. We attribute the capacity decay in our product to the amorphization of Na2MnSiO4 crystals in the composites during the Na+ ion insertion/extraction process.
 | ||
| Fig. 5 The galvanostatic charge–discharge curves at the rate of 0.1C for the initial 5 cycles for the Na2MnSiO4/C/G (a) and Na2MnSiO4/C (b) composites. | ||
To investigate the rate dependent cycling performances of the Na2MnSiO4/C/G and Na2MnSiO4/C composites, galvanostatic charge–discharge measurements were also curried out under various rates. Fig. 6 reveals the charge–discharge profiles of the two composites and the corresponding cycle stabilities at different rates for 30 cycles. Obviously, the Na2MnSiO4/C/G composite show higher discharge capacities and better cycle performance than Na2MnSiO4/C composite at each rate. For example, the initial discharge capacities of Na2MnSiO4/C/G (Fig. 6a and b) are 130.1, 106.9, 80.3 and 60.7 mA h g−1, respectively, at the rates of 0.5C, 1C, 2C and 5C. After 30 charge–discharge cycles, the capacities drop to 84.0, 68.8, 60.5 and 47.8 mA h g−1, respectively, with capacity retention of 64.6%, 64.3%, 75.3% and 78.8%. By comparison, the Na2MnSiO4/C composite (Fig. 6c and d) can only deliver 81.9, 59.2, 39.4 and 24.0 mA h g−1 at the rates of 0.5C, 1C, 2C and 5C, respectively. After 30 charge–discharge cycles, the capacities decrease to 38.9, 32.7, 29.7 and 19.2 mA h g−1, respectively, with capacity retention of 47.5%, 55.3%, 73.3% and 76.6%. Furthermore, similar to Li2MnSiO4 in Li ion cells, both Na2MnSiO4/C/G and Na2MnSiO4/C composites have different degrees of capacity fading with the increase of cycles. We assume that is related to the manganese dissolution and the Jahn–Teller effect of Mn3+ ions during the Na+ insertion–extraction process, which can result in destruction of the active material structure.
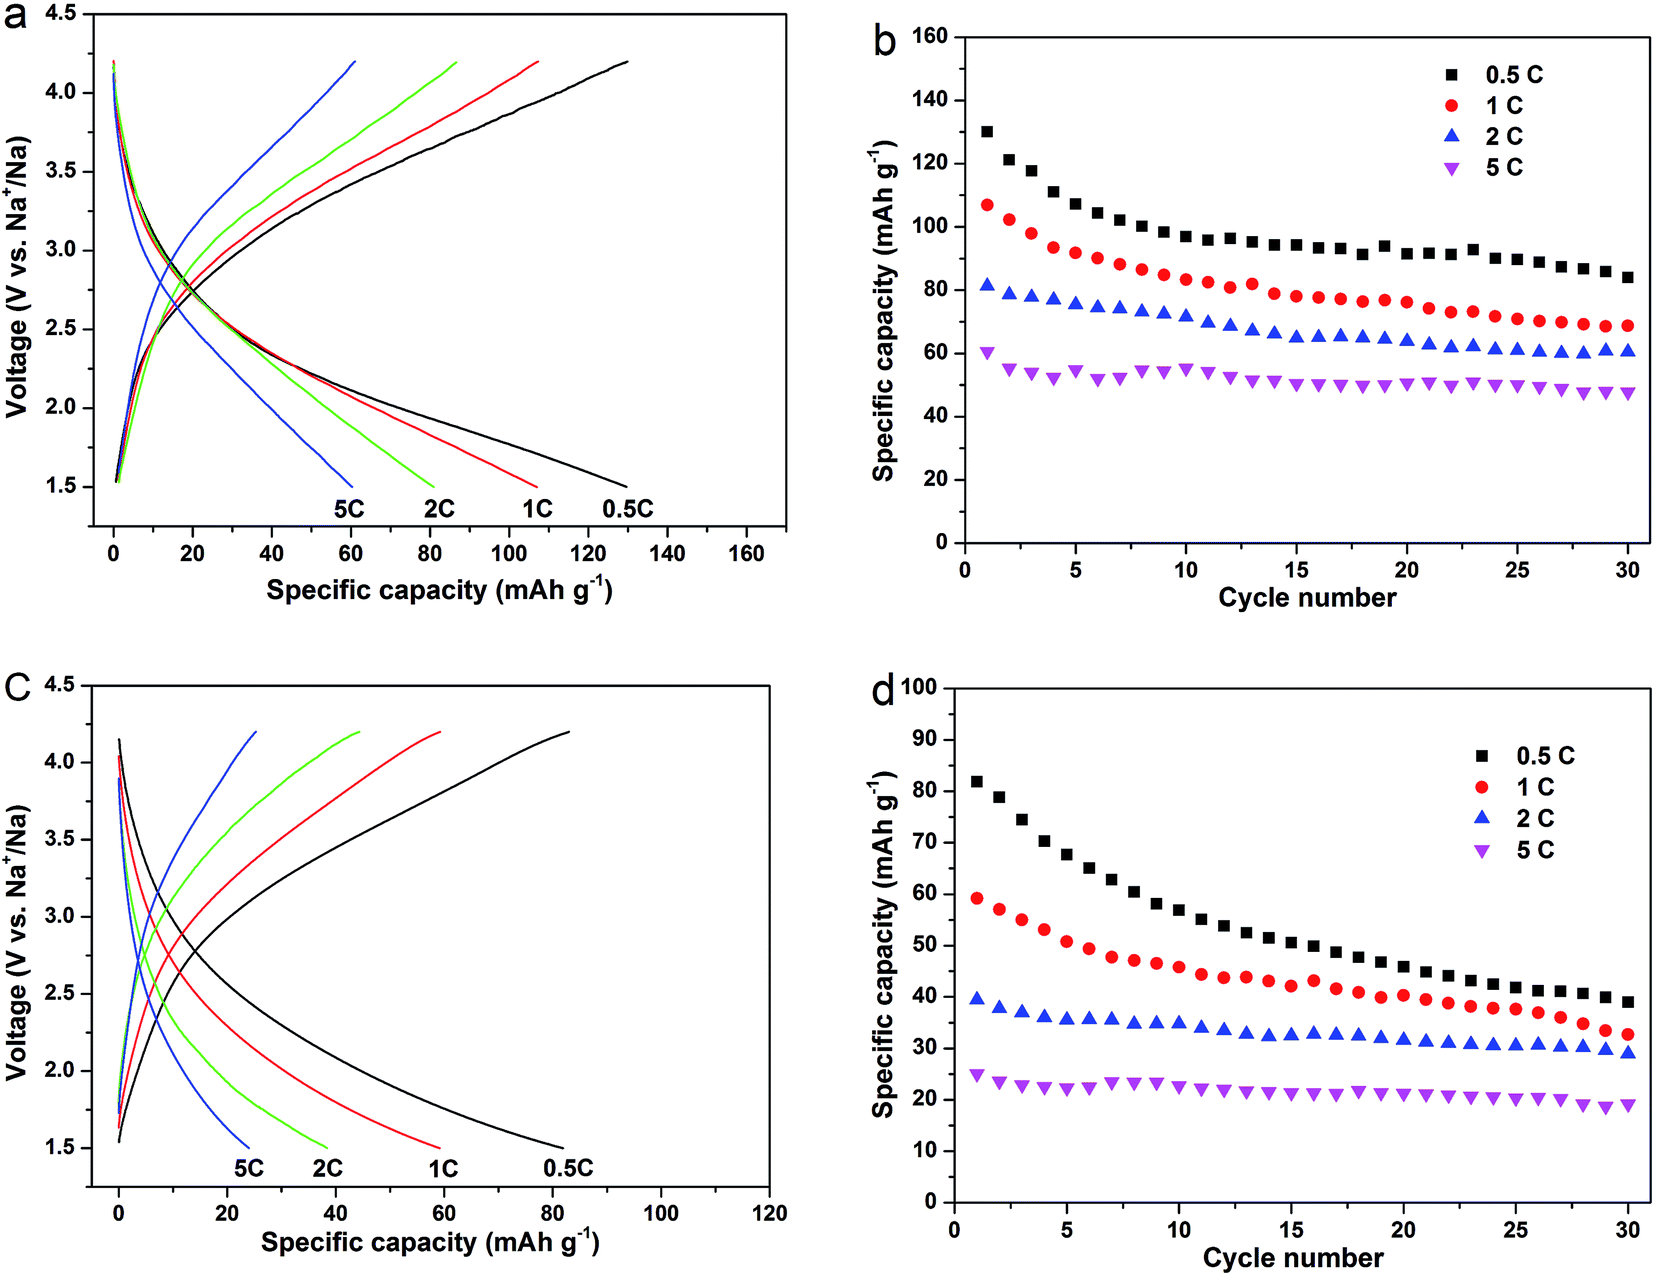 | ||
| Fig. 6 The galvanostatic charge–discharge curves and the corresponding cyclabilities at rates of 0.5C, 1C, 2C and 5C for the composites (Na2MnSiO4/C/G: (a) and (b); Na2MnSiO4/C: (c) and (d)). | ||
In current literature, only few papers have reported the performances of the Na2MnSiO4 as a cathode material for sodium ion batteries. Chen et al.20 synthesized Na2MnSiO4/C by a sol–gel method and tested the electrochemical performances at different temperatures. At the rate of 0.1C, the reversible capacities of 70, 94 and 125 mA h g−1 were obtained for the cell that was tested at 298, 323 and 363 K, respectively. Even at 363 K, the electrode only delivered capacities of 115, 76 and 55 mA h g−1 at 1C, 3C and 5C, respectively, which are still lower than that of the Na2MnSiO4/C/G composite. In our work, the excellent electrochemical performances could be ascribed to the high conductivity and high specific surface area of graphene nanosheets, efficiently facilitating the electron transport and Na+ ion diffusion during the charge–discharge process, hence realizing the enhancements in rate and cycling performance of the active materials.
In order to further understand the kinetic characteristic of the Na2MnSiO4/C/G and Na2MnSiO4/C composites, the Na+ ion migration dynamics of the two composites were investigated from the electrochemical impedance spectroscopy (EIS) measurements. Fig. 7a exhibits the Nyquist curves of the composites after the third cycle at a rate of 0.1C at room temperatures. Both the composites show typical Nyquist plots with a depressed semicircle in the high-medium frequency region and a straight line at the low frequency region. An intercept along the real axis (Zre) at the highest frequency should be due to the internal resistance (Re) of the cell generating from the electrolyte, current collector, separator, etc.31,32 The depressed semicircle in the middle frequency region is related to the charge-transfer resistance (Rct) through the solid-electrolyte interfaces. The linear plots in the low frequency region is attributed to Warburg impedance, which indicates the sodium ion diffusion in the solid phase. Meanwhile, the Nyquist plots are fitted using the equivalent circuit model, as shown in the insets of Fig. 7a. As can be seen, the Rct of the Na2MnSiO4/C/G composite is 629.6 ohm which is much lower than that of the Na2MnSiO4/C composite (780.5 ohm), indicating that the electronic conductivity of the Na2MnSiO4/C/G was dramatically improved after surface modification by graphene. Fig. 7b displays the curve of the relationship between Zre and the reciprocal square root of frequency (ω−1/2) in the low frequency region. The slope of the fitting line is the Warburg coefficient σ, it can be derived from eqn (1):33
| Zre = Re + Rct + σω−1/2 | (1) |
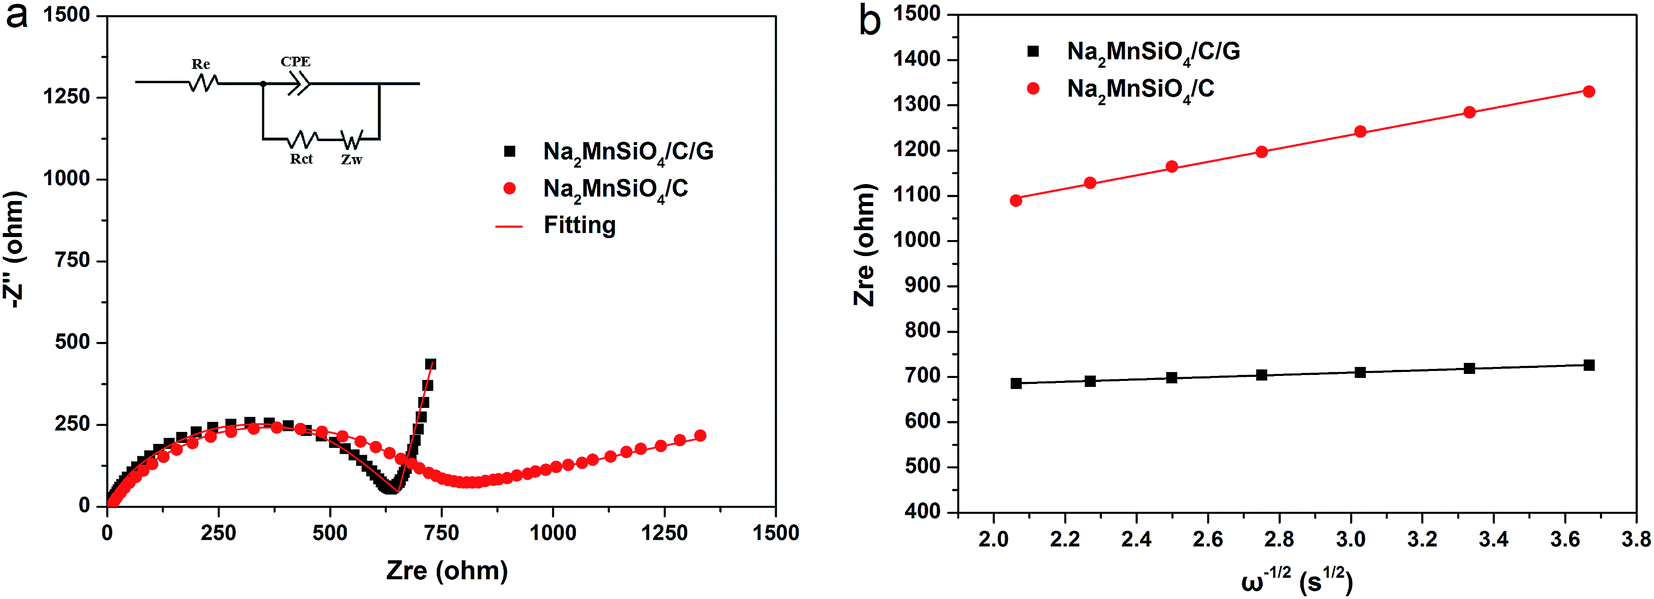 | ||
| Fig. 7 The Nyquist plots and equivalent circuit of composites Na2MnSiO4/C/G and Na2MnSiO4/C at room temperature (a) and the relationship between Zre and ω−1/2 in the low frequency region (b). | ||
Therefore, according to the resulting σ, the sodium ion diffusion coefficient (DNa+) could be obtained by the following eqn (2):33
| D = R2T2/2A2n4F4C2σ2 | (2) |
| Samples | Re (Ω) | Rct (Ω) | σ (Ω cm2 s−1/2) | DNa+ (cm2 s−1) |
|---|---|---|---|---|
| Na2MnSiO4/C/G | 5.2 | 629.6 | 89.3 | 9.17 × 10⁻¹⁵ |
| Na2MnSiO4/C | 8.3 | 780.5 | 286.4 | 8.91 × 10⁻¹⁶ |
Compared with Na2MnSiO4/C, the highly discharge capacity, good capacity retention, and enhanced rate capacity of Na2MnSiO4/C/G can be explained in the following aspects. On the one hand, the good electrical conductivity of graphene sheets serve as continuous conductive channels between the Na2MnSiO4 particles and the electrolyte. On the other hand, the adding of graphene oxide in the synthesis process could decrease the particles sizes of Na2MnSiO4 and prevent the aggregation of nanoparticles, the homogeneous dispersion and nanoscale size of particles can increase the contact area of the active material and the electrolyte, which is benefited to the migration of sodium ions. In addition, the graphene sheets and the coating carbon in the composite can protect Na2MnSiO4 from corrosive reactions with the electrolyte during the Na+ insertion/extraction process.
4. Conclusions
In conclusion, we have successfully synthesized Na2MnSiO4/C/G composite by assisted sol–gel method, in which Na2MnSiO4/C nanoparticles are homogeneously wrapped up in conductive and interconnected graphene nanosheets. Compared with a composite without graphene, Na2MnSiO4/C/G shows excellent electrochemical performances as the cathode material for sodium ion batteries. When evaluated in the sodium ion batteries configuration in the voltage range of 1.5–4.2 V (vs. Na+/Na) at room temperature, the Na2MnSiO4/C/G showed discharge capacities of 182.4, 130.1, 106.9, 80.3 and 60.7 mA h g−1 at the rates of 0.1C, 0.5C, 1C, 2C, 5C, respectively. For the cycling performances, the capacity retentions of the composite can still maintain at 64.3%, 75.3% and 78.8% at the rates of 1C, 2C, and 5C after 30 cycles, respectively. The superior electrochemical performance of Na2MnSiO4/C/G composite might originate from the conductive graphene nanosheets and nanoscale size Na2MnSiO4 particles. It is interesting to note that the sodium ion insertion–extraction process of Na2MnSiO4 is similar to that of Li2MnSiO4 as cathode in Li ion batteries, despite the capacities observed and the corresponding energy densities are lower. In future, though further study, Na2MnSiO4 will become very competitive candidates as the cathodes for Na ion batteries.Acknowledgements
This study was the financially supported by Science and Technology Research Project of Education Department of Hubei Province (Q20162804) and Start up Foundation of Hubei University of Science and Technology (BK1519).Notes and references
- J. M. Tarascon and M. Armand, Nature, 2001, 414, 359–367 CrossRef CAS PubMed.
- H. Pan, Y. S. Hu and L. Q. Chen, Energy Environ. Sci., 2013, 6, 2338–2360 CAS.
- M. Armand and J. M. Tarascon, Nature, 2008, 451, 652–657 CrossRef CAS PubMed.
- J. B. Goodenough and Y. Kim, Chem. Mater., 2010, 22, 587–603 CrossRef CAS.
- V. Palomares, P. Serras, I. Villaluenga, K. B. Hueso, J. Carretero-Gonzalez and T. Rojo, Energy Environ. Sci., 2012, 5, 5884–5901 CAS.
- Y. Cao, L. Xiao, W. Wang, D. Choi, Z. Nie, J. Yu, L. V. Saraf, Z. Yang and J. Liu, Adv. Mater., 2011, 23, 3155–3160 CrossRef CAS PubMed.
- H. Kim, Z. Ding, M. H. Lee, K. Lim, G. Yoon and K. Kang, Adv. Energy Mater., 2016, 6, 1600943–1600981 CrossRef.
- C. Delmas, J. J. Braconnier, C. Fouassier and P. Hagenmuller, Solid State Ionics, 1981, 3–4, 165–169 CrossRef CAS.
- M. D'Arienzo, R. Ruffo, R. Scotti, F. Morazzoni, C. M. Maria and S. Polizzi, Phys. Chem. Chem. Phys., 2012, 14, 5945–5952 RSC.
- A. Caballero, L. Hernan, J. Morales, L. Sanchez, J. S. Pena and M. A. G. Aranda, J. Mater. Chem., 2002, 12, 1142–1147 RSC.
- F. Sauvage, L. Laffont, J. M. Tarascon and E. Baudrin, Inorg. Chem., 2007, 46, 3289–3294 CrossRef CAS PubMed.
- J. Zhao, L. Zhao, N. Dimov, S. Okada and T. Nishida, J. Electrochem. Soc., 2013, 160, A3077–A3081 CrossRef CAS.
- D. Carlier, J. H. Cheng, R. Berthelot, M. Guignard, M. Yoncheva, R. Stoyanova, B. J. Hwang and C. Delmas, Dalton Trans., 2011, 40, 9306–9312 RSC.
- R. Klee, M. J. Aragón, P. Lavela, R. Alcántara and J. L. Tirado, ACS Appl. Mater. Interfaces, 2016, 35, 23151–23159 Search PubMed.
- H. Li, C. Wu, Y. Bai, F. Wu and M. Wang, J. Power Sources, 2016, 326, 14–22 CrossRef CAS.
- W. Tang, X. Song, Y. Du, C. Peng, M. Lin, Y. P. Wu, F. Pan and K. P. Loh, J. Mater. Chem. A, 2016, 4, 4882–4892 CAS.
- P. Barpanda, G. Oyama, S. Nishimura, S. C. Chung and A. Yamada, Nat. Commun., 2014, 5, 4358–4366 CAS.
- A. Caballero, L. Hernan, J. Morales, L. Sanchez, J. S. Pena and M. A. G. Aranda, J. Mater. Chem., 2002, 12, 1142–1147 RSC.
- Y. X. Zhang, H. J. Yu and H. S. Zhou, J. Mater. Chem. A, 2014, 2, 11574–11577 CAS.
- C. Y. Chen, K. Matsumoto, T. Nohira and R. Hagiwara, Electrochem. Commun., 2014, 45, 63–66 CrossRef CAS.
- W. S. Hummers and R. E. Offeman, J. Am. Chem. Soc., 1958, 80, 1339 CrossRef CAS.
- H. Duncan, A. Kondamreddy, P. H. J. Mercier, Y. Le Page, Y. Abu-Lebdeh, M. Couillard, P. S. Whitfield and I. J. Davidson, Chem. Mater., 2011, 23, 5446–5456 CrossRef CAS.
- F. Bonhomme, J. C. Lassegues and L. Servant, J. Electrochem. Soc., 2001, 148, 450–458 CrossRef.
- H. Zhu, H. B. He, X. L. Ma, L. Zan and Y. X. Zhang, Electrochim. Acta, 2015, 115, 116–124 CrossRef.
- H. L. Wang, J. T. Robinson, G. Diankov and H. J. Dai, J. Am. Chem. Soc., 2010, 132, 3270–3271 CrossRef CAS PubMed.
- S. Devaraj, M. Kuezma, C. T. Ng and P. Balaya, Electrochim. Acta, 2013, 102, 290–298 CrossRef CAS.
- H. X. Gong, Y. C. Zhu, L. L. Wang, D. H. Wei, J. W. Liang and Y. T. Qian, J. Power Sources, 2014, 246, 192–197 CrossRef CAS.
- A. Kokalj, R. Dominko, G. Mali, A. Meden, M. Gaberscek and J. Jamnik, Chem. Mater., 2007, 19, 3633–3640 CrossRef CAS.
- R. Dominko, M. Bele, A. Kokalj, M. Gaberscek and J. Jamnik, J. Power Sources, 2007, 174, 457–461 CrossRef CAS.
- R. Dominko, J. Power Sources, 2008, 184, 462–468 CrossRef CAS.
- S. K. Liu, J. Xu, D. Z. Li, Y. Hu, X. Liu and K. Xie, J. Power Sources, 2013, 232, 258–263 CrossRef CAS.
- H. Qiu, K. Zhu, H. Li, T. Li, T. Zhang, H. Yue, Y. Wei, F. Du, C. Wang, G. Chen and D. Zhang, Carbon, 2015, 87, 365–373 CrossRef CAS.
- A. J. Bard and J. R. Faulkner, Electrochemical methods, Wiley, 2nd edn, 2001, p. 231 Search PubMed.
Footnote |
| † Electronic supplementary information (ESI) available: TEM images of Na2MnSiO4/G and Na2MnSiO4/C, TGA curves of Na2MnSiO4/G and Na2MnSiO4/C, and cycling performances of the Na2MnSiO4/C/G and the Na2MnSiO4/C composites at 0.1C. See DOI: 10.1039/c7ra00198c |
| This journal is © The Royal Society of Chemistry 2017 |