
 Open Access Article
 This Open Access Article is licensed under a Creative Commons Attribution-Non Commercial 3.0 Unported Licence
Influence of sample preparation on IGC measurements: the cases of silanised glass wool and packing structure†
Eftychios Hadjittofisa,
Geoff G. Z. Zhang*b and
Jerry Y. Y. Heng *a
*a
aSurfaces and Particle Engineering Laboratory, Department of Chemical Engineering, Imperial College London, South Kensington Campus, London SW7 2AZ, UK. E-mail: jerry.heng@imperial.ac.uk
bDrug Product Development, Research and Development, AbbVie Inc., 1 N Waukegan Road, North Chicago, Illinois 60064, USA. E-mail: Geoff.GZ.Zhang@abbvie.com
First published on 21st February 2017
Abstract
Inverse Gas Chromatography (IGC) is an established technique for the determination of the surface energy heterogeneity of various types of materials, including particulate and fibrous materials. However, variability in sample and column preparation may lead to low reproducibility of data. In this work, the influence of two aspects of chromatographic column preparation; the amount of silanised glass wool and the packing structure of mixtures of particulate materials, on IGC measurements were investigated using a combined experimental and modelling approach. In silico experiments were used to examine these factors for a range of materials with different surface energy. We report here, that the packing structure of particulate materials in the column does not significantly affect the measurements and the results. However, the contribution of the silanised glass wool needs to be corrected, particularly for materials of low surface area or low surface energy. This work demonstrates the importance of column preparation and the need for standardisation of packing protocols for robust experimental determination of surface energy heterogeneity.
1. Introduction
Surface energy, arising from the molecular force imbalance on the surface of a solid material,1 appears to be of high importance for certain applications. In particular, as the ratio of surface area to volume in a particular system increases, the effect of surface energy becomes more prevalent,2 since surface properties (depending on the surface area) overcome the effects of bulk forces (depending on volume). Depending on the nature of the material and their applications, surface energy may influence different properties of interest. Surface energy determines the catalytic properties of materials used in industrial processes.3–5 It also influences the mechanical properties of industrially relevant materials6–8 like carbon nanotubes and it also seems to be important in biological membranes.9 Surface energy influences, also, a wide range of phenomena of particular importance in powder handling industries (pharmaceutical, dairy etc.) including cohesion,10,11 compactability,12 agglomeration and deagglomeration,13,14 and wetting.15,16 Surface energy measurements can also be used to determine the crystallinity of materials of interest.17Thomas Young, in his pioneering work on the cohesion of fluids,18 made the following statement: “It is necessary to premise one observation, which appears to be new, and which is equally consistent with theory and with experiment; that is, that for each combination of a solid and a fluid, there is an appropriate angle of contact between the surfaces of the fluid exposed to the air, and to the solid”. This paragraph outlines the first coherent method for the determination of the surface energy of a solid using a reference liquid. In the principles stemming from Young's work, various experimental techniques were developed.19–25
However, when it comes to surface energy measurements of particulate materials, especially crystalline solids, these wettability-based techniques are fundamentally inadequate to offer accurate measurements. The surface of crystalline particles comprises of planes called facets. Each of these facets carries a different surface energy depending on the functional groups exposed.26,27 Thus, crystalline particles are inherently energetically anisotropic. It is obvious that, at a higher level, a population of energetically anisotropic particles exhibit surface energy heterogeneity. Thus a single value is inadequate in characterising the surface energy of the population, and an energy distribution is necessary to accurately describe crystalline solids.
In this context, Inverse Gas Chromatography (IGC) emerged in the mid-70's28,29 as an attractive technique for the characterisation of the particulate materials. The fundamentals of this technique have been outlined extensively in other works.30 The most important feature of this technique is that, in its finite dilution mode, it produces a surface energy map showing the value of surface energy measured at a variety of surface coverages. These maps can then be used in conjunction with computational models to enable the construction of surface energy distributions describing the surface energy heterogeneity.
Today, IGC is widely used in both academia and industry, contributing to the characterisation of different materials. However, cases exist where different researchers record different data for the same material. Similarly, cases also exist where researchers raise questions regarding the effect of packing on data and corresponding results. In the literature, detailed analyses are provided for the accurate analysis of IGC data, however no systematic work to investigate the importance of sample preparation is reported. This work deals with two important aspects of IGC experiments focusing on the column preparation. The first deals with the silanised glass wool used in the packing of IGC columns. The second examines the effect of column packing pattern. The experimental data presented are rationalised by the findings from modelling approach.
2. Experimental methods
The silanised glass wool used in the experiments was purchased from Sigma. Carbamazepine was purchased from Apollo Scientific, and was recrystallised from methanol. δ-Mannitol was purchased from Sigma, and was recrystallised from a mixture of deionised water and ethanol. α-Lactose monohydrate was purchased from Sigma was also recrystallised in water.The surface areas of the aforementioned materials were measured using two alkane probes, octane and nonane. The surface energy measurements were carried out using three alkane probes, octane, nonane, and decane; at surface coverages ranging from 0.003 to 0.1. The study did not expand to higher values of surface coverage to avoid encountering complexities associated with the effects of lateral interaction which increase with increasing surface coverage. The Schultz approach was used to determine surface energy at individual values of surface coverage, with the R2 agreement being greater than 0.999.31
3. Results and discussion
3.1 Influence of silanised glass wool
Silanised glass wool, a commercially available fibrous, amorphous material, is used to pack materials in IGC columns, and to ensure no powder movement during measurements. Despite the fact that this material carries some surface energy, influencing the measurements, a reliable source addressing a code of practice for its application does not exist. Thus, a simple set of experiments was developed in order to study how the packing material influences IGC measurements.The surface area of the silanised glass wool was determined, as mentioned in the Experimental methods section, to be about 0.27 ± 0.02 m2 g−1 and then its surface energy was measured. The next step was to measure the surface energy of α-lactose monohydrate sample. About 2.5 g of α-lactose monohydrate were packed with about 0.1 g of silanised glass wool and measurements of surface area (found to be about 0.4 m2 g−1) and surface energy were conducted. This measurement constitutes the baseline for α-lactose monohydrate and in the following experiments silanised glass wool was added in addition to this 0.1 g. Inarguably, this minor addition of silanised glass wool can, theoretically, influence the data. Nonetheless, it would become clear from the in silico experiments, presented later on in this section, that such an amount of silanised glass wool, packed with a material like α-lactose monohydrate, does not have a measurable impact in the measurement. The surface energy distributions was determined, using a multi-solvent system site filling model based on Boltzmann statistical distribution, under the assumption that it comprises from the sum of four Gaussian distributions, each one at a different ratio, each one representing an adsorption site of different surface energy (please refer to the ESI† for a detailed description of the approach).30 The measurements of the properties of pure silanised glass wool and almost pure α-lactose monohydrate would be the basis for the development of an approach to determine the importance of silanised glass wool in IGC measurements.
The next step was to pack silanised glass wool (W) and α-lactose monohydrate (L) at a series of surface area ratios (the ratio of the surface area of the silanised glass wool to the surface area of the α-lactose monohydrate baseline), L![[thin space (1/6-em)]](https://www.rsc.org/images/entities/char_2009.gif) :W = 1:2, 1:1, 2:1, 4:1. The mixtures were examined and the curves of dispersive surface energy as a function of surface coverage are shown in Fig. 1 for these samples. It is important to note that the two baseline measurements act as the boundaries, α-lactose monohydrate is the higher boundary while silanised glass wool is the lower boundary. Data for all mixtures lie in-between the two boundaries. Considering that the surface area of the silanised glass wool is about 65% of the α-lactose monohydrate and that the silanised glass wool is fibrous in nature, an experienced IGC operator would immediately realise that the amount of silanised glass wool used in the aforementioned mixtures is much higher than the amount is frequently used. This was done intentionally in order to examine the limits of silanised glass wool influence. The surface energy of the mixtures of silanised glass wool with α-lactose monohydrate was measured. It is important to clarify, that for the calculation of the surface coverage, only the α-lactose monohydrate content was taken in account. The reason for this was to highlight the erroneous result associated from the use of excess amount of silanised glass wool.
:W = 1:2, 1:1, 2:1, 4:1. The mixtures were examined and the curves of dispersive surface energy as a function of surface coverage are shown in Fig. 1 for these samples. It is important to note that the two baseline measurements act as the boundaries, α-lactose monohydrate is the higher boundary while silanised glass wool is the lower boundary. Data for all mixtures lie in-between the two boundaries. Considering that the surface area of the silanised glass wool is about 65% of the α-lactose monohydrate and that the silanised glass wool is fibrous in nature, an experienced IGC operator would immediately realise that the amount of silanised glass wool used in the aforementioned mixtures is much higher than the amount is frequently used. This was done intentionally in order to examine the limits of silanised glass wool influence. The surface energy of the mixtures of silanised glass wool with α-lactose monohydrate was measured. It is important to clarify, that for the calculation of the surface coverage, only the α-lactose monohydrate content was taken in account. The reason for this was to highlight the erroneous result associated from the use of excess amount of silanised glass wool.
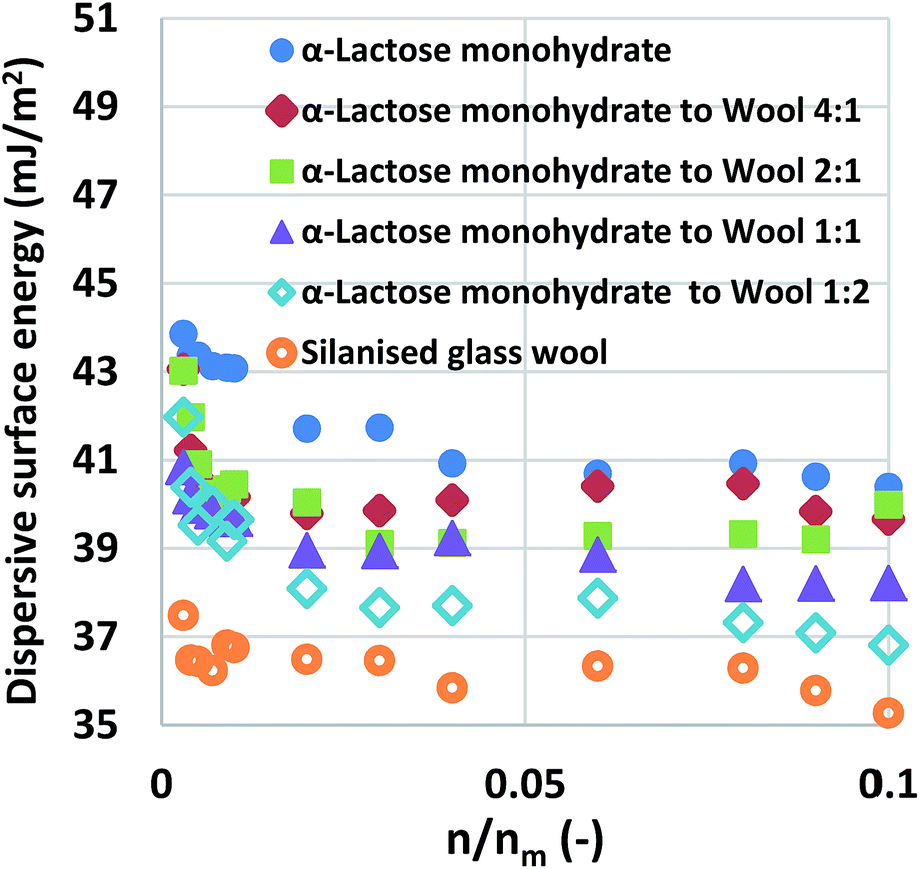 | ||
| Fig. 1 Surface energy maps of α-lactose monohydrate and glass wool at different combination ratios. | ||
Using computational modelling, it was possible to predict the surface energy distributions of samples.32,33 For the purposes of the simulations, the surface area was now adjusted. For example, in the L:W = 1:1 mixture the actual surface area was double the surface area introduced in the chromatograph's software. The theoretical surface energy distributions was determined by appropriate combinations of the surface energy distributions of α-lactose monohydrate and silanised glass wool. For example for the 1:1 situation the predicted distribution was calculated by multiplying the distributions of the two individual components (silanised glass wool and α-lactose monohydrate) by a factor of 0.5 and then adding them together. In Fig. 2, the theoretical surface energy distributions are shown, along with the distributions predicted by the models for two of the mixtures. Direct comparison of the two distributions revealed good agreement between the theoretical and the predicted distributions. This indicates the validity of the adsorption model used. It also signifies that no solid–solid interfaces are associated with the addition of excess amount of silanised glass wool. To account for the statistical significance of silanised glass wool's surface area, the deviation in the measured surface energy at every value of surface coverage was calculated as follow:
| Δγdcoverage x = γdcoverage x of lactose − γdcoverage x of sample x |
:1, the deviation can be up to three times larger than the deviation of the equipment.
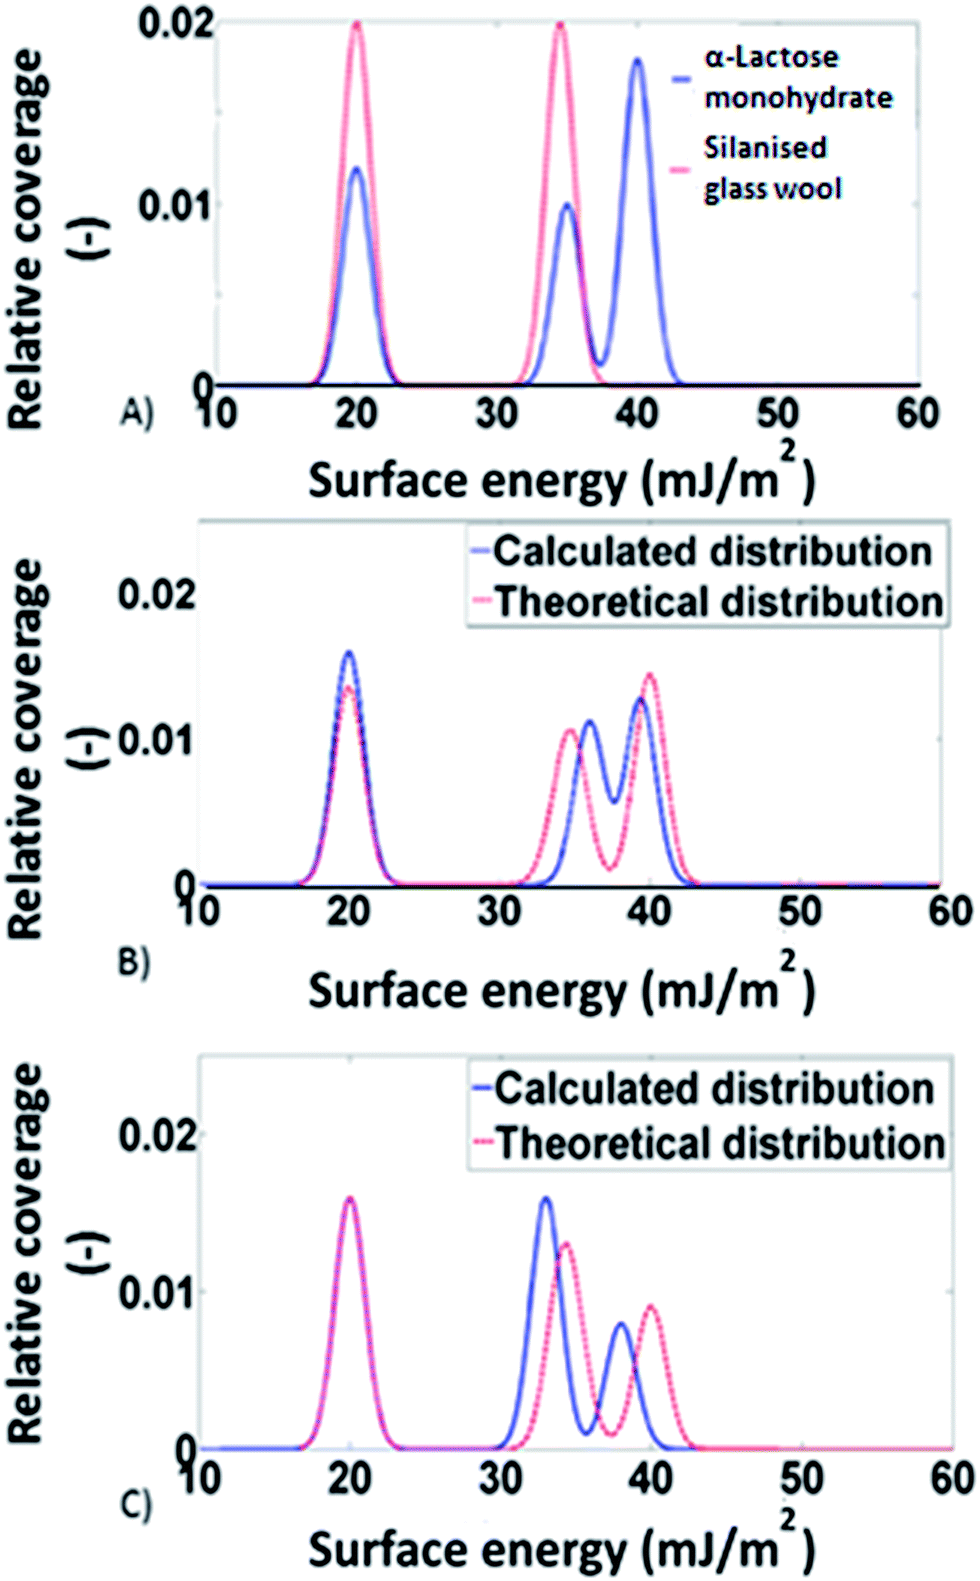 | ||
| Fig. 2 (A) Calculated surface energy distributions of the two model materials: the silanised glass wooland α-lactose monohydrate, (B and C) surface energy distributions calculated from experimental data and theoretical prediction from combinations of the surface energy distributions of the silanised glass wool and α-lactose, for 1:4 and 1:1 silanised glass wool to α-lactose mixtures, respectively. | ||
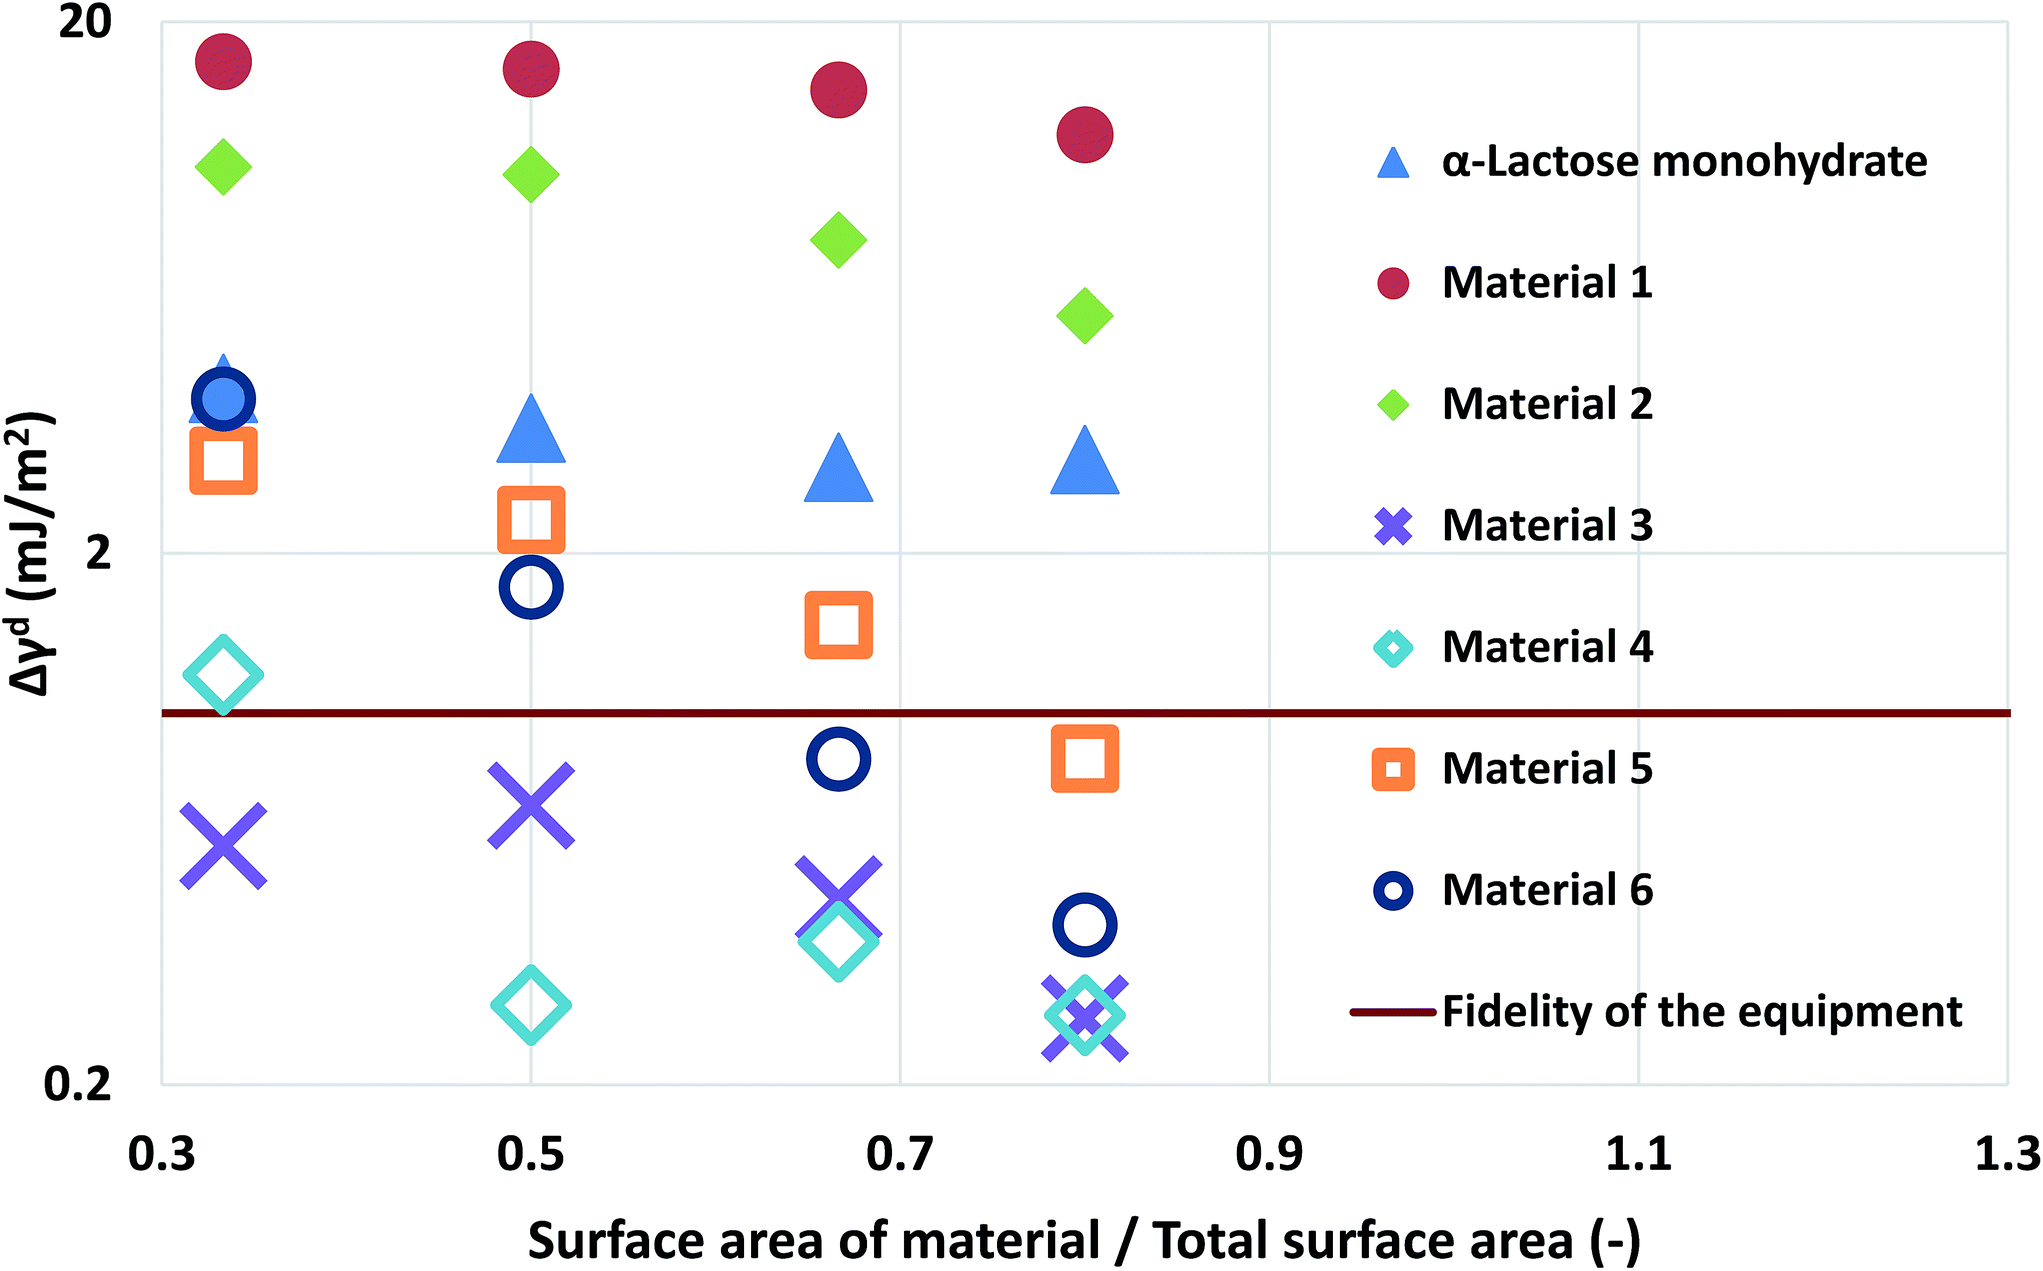 | ||
| Fig. 3 The deviation of the measurements at different loadings of silanised glass wool for the α-lactose monohydrate and the two simulated materials. | ||
Computational modelling is used to extend the applicability of the notions described up to here. Six model materials with a wide range of surface energies were simulated. The surface energy distributions of these materials are shown in Fig. 4. The same procedure for the calculation of the maximum deviation was employed and the results are shown in Fig. 3. The most intrinsic finding of this analysis is that the materials can be categorised in three main categories. The first one includes Materials 1 and 2, which have surface energy quite smaller than silanised glass wool (γd < 30 mJ m−2), like polytetrafluoroethylene. These materials should be in quantities much larger than silanised glass wool because, as it can be seen from Fig. 3, even when material's surface area is four time silanised glass wool's surface area the error in the measurement can be up to five times the standard equipment error (approximately 1 mJ m−2). The second class includes Materials 3 and 4, with surface energy similar to silanised glass wool (30 < γd < 40 mJ m−2). Since the surface energy of these materials is similar to this of the silanised glass wool, the effects of silanised wool are masked and cannot be determined easily. The last category includes Material 5 and 6, which have high surface energy (γd > 50 mJ m−2). The high energy of the majority of adsorption sites eliminates the effects of silanised wool and even if the surface area of silanised glass wool is equal to the surface area of the material the deviations in measurement is close to equipment's standard deviation. Adsorption phenomena are highly non-linear and they are strongly influenced by the material's heterogeneity thus, it is not sensible to attempt to construct a universal contour map predicting variations in measurements from the first principles.
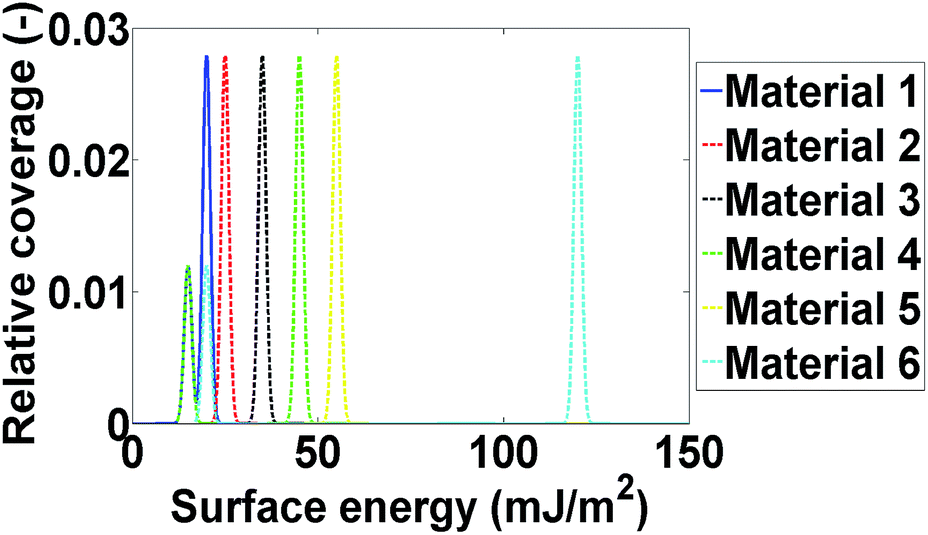 | ||
| Fig. 4 The surface energy distributions of the six modelled materials. | ||
The findings of the silanised wool section are important as they highlight the need for complimentary techniques in surface energy measurements. In order for an IGC operator to select the optimum amount of silanised wool for a specific material, prior knowledge of the order of magnitude of surface energy is required. Furthermore, the importance of this section is that it provides with numerical data for the surface energetics of silanised wool which can be used in the design of experiments. Finally, the computational framework described can be used as a tool for researchers to assess previous measurements in the light of the findings of this paper.
3.2 Effects of packing
Mixtures of carbamazepine and δ-mannitol were used in this study. The materials were prepared as described in the Experimental methods section. Their surface area was found to be quite similar (about 0.35 m2 g−1). Chromatographic columns were packed, using four different ways, with the aforementioned materials, at a 1:1 surface area ratio. The four different ways of packing are outlined in Table 1. The surface energy of each of the columns was measured and the results were plotted in Fig. 5. Similarly with the silanised glass wool analysis, the surface energy distributions of the two materials were calculated.
| Packing name | Description | Schematic |
|---|---|---|
| Physical mixture | Powders are physically mixed together |  |
| Janus | Two layers of powder; a carbamazepine and a δ-mannitol one on each side of the column |  |
| Tapir | Three layers of powder; the upper and the bottom layers are δ-mannitol, and the middle layer is carbamazepine |  |
| Zebra | Six layers of powder, alternating between δ-mannitol and carbamazepine |  |
 | ||
| Fig. 5 The surface energy measurements obtained from pure carbamazepine, δ-mannitol, and 1:1 mixtures of the two packed with different configurations. | ||
As can be seen, there is not a large variation in the measured surface energy of the mixtures, indicating that the packing of the material does not influence the IGC measurements. In addition, the deconvoluted surface energy distribution of the mixture agrees with the theoretically distribution predicted from the combination of the surface energy distributions of its constituent components. From a formulation perspective, this is a quite important finding. It indicates that the influence of the solid–solid interfaces is negligible. Thus, no mechanical interlocking or particle coating is observed.
Monte Carlo simulations based on the works conducted by Smit34 and Roma35 were employed to analyse the experimental findings from a modelling perspective since the deterministic codes developed for the determination of surface distributions are not able to deal with such phenomena. The simulations were done on a 500 × 500 square lattice. Three different types of lattices were used:
(a) Physical mixture lattice: the adsorption sites predicted by the energy distributions are allocated randomly throughout the lattice.
(b) The two side lattice (corresponding to Janus packing): in this case the lattice was divided in two sections each with dimensions 500 × 250, the adsorption sites for carbamazepine were distributed on one side and those for δ-mannitol were distributed on the other side.
(c) The zebra lattice: it is similar with (b), but it has six sections each with dimension 500 × 83 (apart from one which is 500 × 84).
The results obtained, from the Monte Carlo simulations, for the experienced surface energy for octane and decane are shown in Fig. 6. The systems behave similarly in all three lattices meaning that no significant differences are identified for different lattice arrangements (within 5%). This is in agreement with the experimental findings for the influence of packing structure.
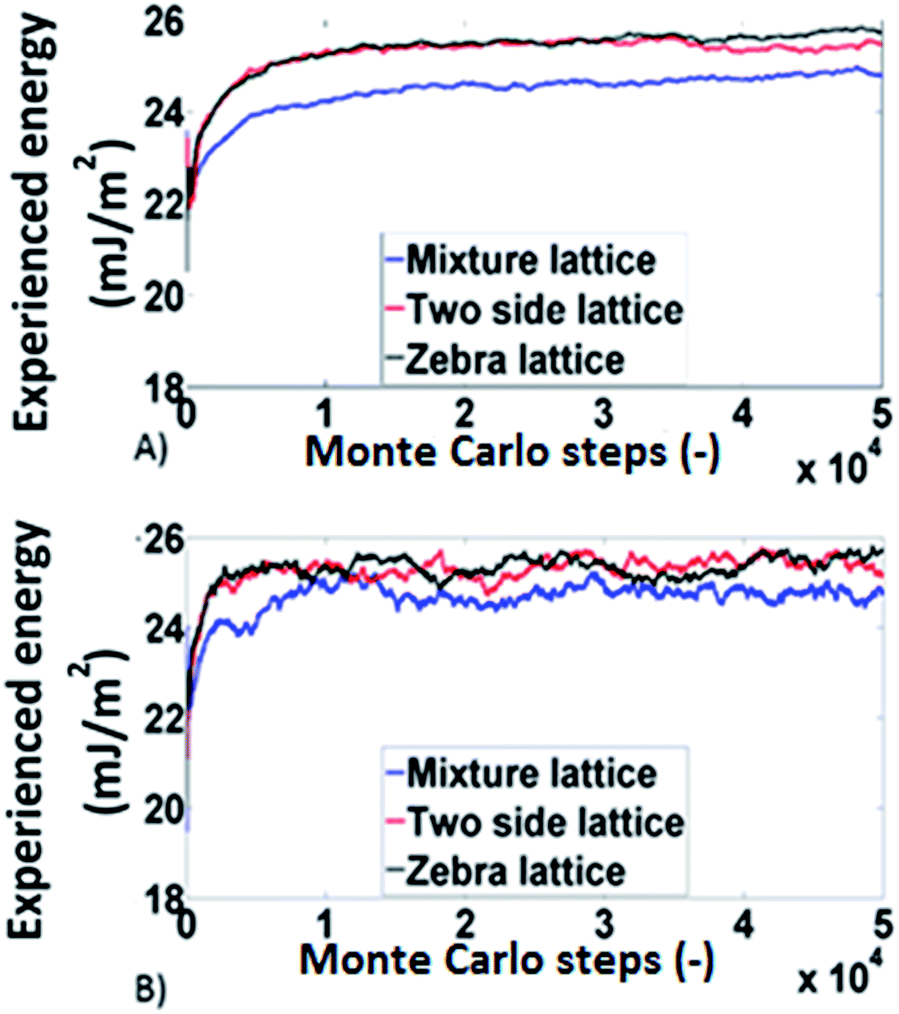 | ||
| Fig. 6 The results of the Monte Carlo simulations for (A) octance and (B) decane. | ||
4. Conclusions
A combination of experimental and computational approaches was applied to investigate the influence of the amount of silanised glass wool and of column packing patterns on IGC measurements. For the case of silanised glass wool the surface energy of the material was examined using IGC measurements and computational models. The recommendation is that care should be taken especially for low surface area and/or low surface energy materials. The presented data could be used for guidance to determine how much material or wool should be packed in the chromatographic column and the computational models provide a versatile toolbox guiding researchers in the selection of the appropriate amount of silanised glass wool. In addition, it was shown that the packing of mixtures of particulate materials does not significantly influence the experimental data and the surface energy results. All the experimental measurements were supported by state-of-the-art computational approaches, highlighting the importance of in-depth computational analysis of IGC data. This study verifies IGC as a powerful characterisation technique able to detect even small variations in surface energy between different samples.Disclosure
Imperial College London and AbbVie jointly participated in study design, research, data collection, analysis and interpretation of data, writing, reviewing, and approving the publication. Eftychios Hadjittofis is a graduate student at Imperial College London; Jerry Y. Y. Heng is a professor at Imperial College London. They all have no additional conflicts of interest to report. Geoff G. Z. Zhang is an employee of AbbVie and may own AbbVie stock.Acknowledgements
The PhD studentship, supported by the Engineering and Physical Science Research Council DTA scheme and AbbVie Inc. for Eftychios Hadjittofis, is gratefully acknowledged.References
- J. N. Israelachvili, Intermolecular and Surface Forces, Academic Press, Oxford, 3rd edn, 2011 Search PubMed.
- S. Cuenot, C. Fretigny, S. Demoustier-Champagne and B. Nysten, Phys. Rev. B: Condens. Matter Mater. Phys., 2004, 69, 165410–165414 CrossRef.
- I. I. Salame and T. J. Bandosz, Langmuir, 2001, 17, 4967–4972 CrossRef CAS.
- N. A. Katsanos, D. Gavril, J. Kapolos and G. Karaiskakis, J. Colloid Interface Sci., 2004, 270, 455–461 CrossRef CAS PubMed.
- Z. Y. Zhou, N. Tian, J. T. Li, I. Broadwell and S. G. Sun, Chem. Soc. Rev., 2011, 40, 4167–4185 RSC.
- R. Menzel, A. Lee, A. Bismarck and M. S. P. Shaffer, Langmuir, 2009, 25, 8340–8348 CrossRef CAS PubMed.
- K. Y. Lee, J. J. Blaker, R. Murakami, J. Y. Y. Heng and A. Bismarck, Langmuir, 2013, 30, 452–460 CrossRef PubMed.
- Z. Yao, L. Ge, W. Yang, M. Xia, M. Jin, J. Tang and J. Dienstmaier, Anal. Chem., 2015, 87, 6724–6729 CrossRef CAS PubMed.
- M. Avgidou, M. Dimopoulou, A. Mackie, N. Rigby, C. Ritzoulis and C. Panayiotou, RSC Adv., 2016, 6, 102634–102646 RSC.
- U. V. Shah, D. Olusanmi, A. S. Narang, M. A. Hussain, J. F. Gamble, M. J. Tobyn and J. Y. Y. Heng, Int. J. Pharm., 2014, 472, 140–147 CrossRef CAS PubMed.
- U. Zafar, C. Hare, A. Hassanpour and M. Ghadiri, Powder Technol., 2014, 264, 236–241 CrossRef CAS.
- N. S. Trasi, S. X. M. Boerrigter, S. R. Byrn and T. M. Carvajal, Int. J. Pharm., 2011, 406, 55–61 CrossRef CAS PubMed.
- S. C. Das, I. Larson, D. A. V. Morton and P. J. Stewart, Langmuir, 2011, 27, 521–523 CrossRef CAS PubMed.
- S. C. Das and P. J. Stewart, J. Pharm. Pharmacol., 2012, 64, 1337–1348 CrossRef CAS PubMed.
- J. Y. Y. Heng, F. Thielmann and D. R. Williams, Pharm. Res., 2006, 23, 1918–1927 CrossRef CAS PubMed.
- P. E. Luner, Y. Zhang, Y. A. Abramov and T. M. Carvajal, Cryst. Growth Des., 2012, 12, 5271–5282 CAS.
- A. Otte and T. M. Carvajal, J. Pharm. Sci., 2010, 100, 1793–1804 CrossRef PubMed.
- T. Young, Philos. Trans. R. Soc. London, 1805, 95, 65–87 CrossRef.
- L. Wilhelmy, Ann. Phys. Chem., 1863, 119, 179–217 Search PubMed.
- J. V. Brakel and P. M. Heertjes, Powder Technol., 1977, 16, 75–81 CrossRef.
- J. V. Brakel and P. M. Heertjes, Powder Technol., 1977, 16, 83–90 CrossRef.
- J. V. Brakel and P. M. Heertjes, Powder Technol., 1977, 16, 91–96 CrossRef.
- R. Crawford, L. K. Koopla and J. Ralston, Colloids Surf., 1987, 27, 57–64 CrossRef CAS.
- Y. Gu, D. Li and P. Cheng, Colloids Surf., A, 1997, 122, 135–149 CrossRef CAS.
- P. M. Heertjes and N. W. F. Kossen, Powder Technol., 1967, 1, 33–42 CrossRef CAS.
- S. Ramanaiah, V. Karde and C. Ghoroi, RSC Adv., 2015, 5, 48712 RSC.
- J. Y. Y. Heng, A. Bismarck, A. F. Lee, K. Wilson and D. R. Williams, Langmuir, 2006, 22, 2760–2769 CrossRef CAS PubMed.
- J. Braun and J. E. Guillet, Polym. Chem., 1975, 13, 1119–1131 CrossRef CAS.
- P. Hudec, Macromol. Chem. Phys., 1977, 78, 1187–1193 CrossRef.
- R. Ho and J. Y. Y. Heng, KONA Powder Part. J., 2013, 30, 164–180 CrossRef CAS.
- P. P. Yla-Maihaniemi, J. Y. Y. Heng, F. Thielmann and D. R. Williams, Langmuir, 2008, 24, 9551–9557 CrossRef CAS PubMed.
- R. R. Smith, D. R. Williams, D. J. Burnett and J. Y. Y. Heng, Langmuir, 2014, 30, 8029–8035 CrossRef CAS PubMed.
- A. E. Jefferson, D. R. Williams and J. Y. Y. Heng, J. Adhes. Sci. Technol., 2011, 25, 339–355 CrossRef CAS.
- B. Smit, Mol. Phys., 1995, 85, 153–172 CrossRef CAS.
- F. Roma, A. J. Ramirez-Pastor and J. L. Riccardo, J. Chem. Phys., 2001, 114, 10932–10937 CrossRef CAS.
Footnote |
| † Electronic supplementary information (ESI) available. See DOI: 10.1039/c7ra00178a |
| This journal is © The Royal Society of Chemistry 2017 |