DOI:
10.1039/C7RA00134G
(Paper)
RSC Adv., 2017,
7, 20084-20092
Ligand-free rutile and anatase TiO2 nanocrystals as electron extraction layers for high performance inverted polymer solar cells†
Received
4th January 2017
, Accepted 16th March 2017
First published on 5th April 2017
Abstract
Ligand-free rutile and anatase TiO2 nanocrystals have been synthesized through a hydrolytic sol–gel reaction. The morphology, crystal structure, elemental composition and band structure of the obtained nanocrystals are characterized by transmission electron microscopy, X-ray diffraction, X-ray photoelectron spectroscopy, ultraviolet photoelectron spectroscopy and UV-visible absorption spectroscopy. These two kinds of nanocrystals could serve as electron extraction layers for improving the performance in inverted polymer solar cells. Compared with the device fabricated by using amorphous TiO2 (6.11%) and rutile TiO2 (6.93%), the device based on anatase TiO2 shows a significant enhancement in power conversion efficiency (7.85%). Meanwhile, the ideal current–voltage model for a single heterojunction solar cell is applied to clarify the junction property of the cell. The model demonstrates that the device based on anatase TiO2 has effective electron extraction and hole-blocking properties.
1. Introduction
Organic solar cells (OSCs) have attracted extensive attention due to their advantages such as low cost, flexibility, light weight and simple fabrication.1–4 Rapid progress has led to high power conversion efficiencies (PCE) of over 10% being achieved in single-junction OSCs.5,6 Meanwhile, the stability, especially in an air atmosphere, becomes a key issue for their application.7 Compared with a conventional structure, inverted organic solar cells (i-OSCs) could improve the stability because of the application of high work-function metals (Ag, Au) as the anode.8–12 Moreover, to achieve the inverted configuration, the indium tin oxide (ITO) cathode is modified by electron extraction materials, including metal oxides (ZnO, TiO2),13 metal salts (CsF, Cs2CO3, C17H35COOCs),14–16 and polyelectrolytes (PFN, PEI, PEIE).17,18 Among these interfacial materials, TiO2 attracts more attention due to its high chemical and thermal stability, hole blocking, and electron selectivity.19
TiO2 can exist in one of three major bulk crystalline forms, rutile, anatase, and brookite; all of which can be described in terms of distorted TiO6 octahedra with different symmetries or arrangements.20 Among its three polymorphs, the brookite structure is not experimentally investigated as much as the others because brookite is a metastable phase with a complicated and low-symmetry structure; furthermore, the formation of brookite TiO2 is almost always accompanied by the presence of secondary phases such as anatase and/or rutile. In comparison, rutile and anatase are the two most dominant polymorphs used in applications. Usually, anatase TiO2 shows a higher photocatalytic activity due to its wider band gap than rutile TiO2.21
The basic synthetic routes of TiO2 nanomaterials and films have been reviewed by Chen and Sang,20,22 including sol–gel, micelle, hydrothermal, solvothermal, sonochemical and microwave methods. Among these methods, the sol–gel method is a versatile route to fabricate amorphous or low crystalline TiO2 nanomaterials or films at low temperature. However, the solar cells based on amorphous or low crystalline TiO2 result in relatively low electron mobility and subsequently poor device performance.23 Therefore, a sol–gel method combined with heat treatment was developed yielding advances for DSSCs. For example, Agarwala reported a series of methods to prepare TiO2 films with high crystallinity and stable mesoporous structure, and improved performance of the DSSCs was achieved.24–27
To obtain the crystalline TiO2 nanomaterials or films with tunable crystal phases, one common method is annealing the spin-coated titanium precursors in different ranges of temperature. For example, anatase TiO2 films can be obtained by annealing titanium isopropoxide at 400–500 °C.28 Upon increasing the annealing temperature to 600 °C, phase transformation occurs and rutile TiO2 films could be obtained.29 These strategies above were well-developed in DSSCs. But in the case of OSCs, the electron extraction layer (EEL) requires a thin (usually below 50 nm) and condensed TiO2 film for high electron mobility and high transmittance. The high-temperature calcination will cause large grain or particle size for the crystalline TiO2. Meanwhile, the metal atoms (Ti, In, Sn) from ITO will diffuse into TiO2 films during the calcination process, resulting in altered optical and electronic properties.30 Therefore, the fabrication of the crystalline TiO2 thin films at low temperature is required. With the development of the synthesis, the controllable size, phase and morphology of TiO2 nanomaterials could be obtained by using surfactants and ligands with long alkyl chains. However, these capped surfactants or ligands on the surface of TiO2 crystals may cause trapping of electrons in the EEL thus decreasing the PCE.31
Herein, we synthesized ligand-free rutile and anatase TiO2 nanocrystals by using a hydrolytic sol–gel reaction, followed by a phase separation from the bulk solvent by gravity. These two kinds of TiO2 nanocrystals with high purity are uniform in shape and can be well-dispersed in water. Due to the clean surface and excellent electron extraction property, the device based on anatase TiO2 shows a significant enhancement in PCE compared with the devices based on rutile and amorphous TiO2.
2. Experimental section
2.1 Materials
TiCl3 (15.0–20.0% basis in 30% HCl) and ethyl alcohol (98%) were purchased from Aladdin. SnCl4 (99.9%), titanium isopropoxide (TTIP, 97%), isopropyl alcohol (IPA, 99%), chlorobenzene (99%), and 1,8-diiodooctane (DIO, 98%) were purchased from Alfa Aesar. PTB7 was purchased from 1-Materials Inc. PC71BM (99%) was purchased from Solenne BV Inc. All chemicals were used as received without further treatment.
2.2 Synthesis of the anatase/rutile TiO2 nanocrystals
Anatase/rutile TiO2 nanocrystals were synthesized by using a developed synthetic method with slight modification.32 (1) Synthesis of rutile nanocrystals: aqueous solutions of TiCl3 (∼20%, 1.6 mL) and SnCl4 (0.5 M, 1.0 mL) were mixed with ethanol (60 mL) in a glass bottle. After being sealed with parafilm, the reaction mixture was heated at 75 °C in a water bath. After 4 hours, the products precipitated at the bottom of the bottle. (2) Synthesis of anatase nanocrystals: aqueous solutions of TiCl3 (∼20%, 1 mL) and HCl (6 M, 1.0 mL) were mixed with ethanol (60 mL) in a bottle. After being sealed with parafilm, the reaction mixture was heated at 75 °C in a water bath. After 6 h, the products deposited at the bottom of the bottle. Rutile and anatase TiO2 nanocrystals were collected by pouring out the supernatant ethanol and then washed with ethanol through centrifugation at 8000 rpm for 3 times to remove the Sn4+ or HCl. The final products were redispersed into the water for device fabrication.
2.3 Material characterization
The X-ray diffraction (XRD) patterns were recorded by a Bruker D8 X-ray diffractometer with Cu Kα radiation (λ = 1.5406 Å, 40 kV, 40 mA). Transmission electron microscopy (TEM) and high-resolution TEM (HRTEM) images were obtained on a FEI Tecnai G2 F30 transmission electron microscope. X-ray photoelectron spectroscopy (XPS) and ultraviolet photoelectron spectroscopy (UPS) images were recorded on a Kratos Axis Ultra DLD photoelectron spectrograph. The UV-vis absorption measurements of TiO2 films deposited onto quartz substrates were measured by a Shimadzu UV-3101 PC spectrophotometer at room temperature. The thickness of the different TiO2 layers on the ITO glasses was measured by a Hitachi (S-4800) field emission scanning electron microscope (SEM).
2.4 Device fabrication
The inverted organic solar cells were fabricated with the structure sequence of ITO/TiO2 (amorphous TiO2 or TiO2 nanocrystals)/PTB7![[thin space (1/6-em)]](https://www.rsc.org/images/entities/char_2009.gif) :PC71BM/MoO3/Ag. The ITO-coated glass substrates were pre-cleaned with deionized water, acetone, and isopropanol in an ultrasonic bath for 15 min each. Subsequently, a thin layer (approximately 25 nm, Fig. S1, ESI†) of rutile or anatase TiO2 (10 wt%) was spin-coated onto ITO glasses and dried on a hot plate at 130 °C for 30 min. The device based on amorphous TiO2 as a reference was prepared using a sol–gel method, in which the TiO2 precursor solution was spin-coated on the ITO-coated glass with a procedure reported previously.33 Subsequently, the active layer PTB7:PC71BM (1:1.5 weight ratio) was spin-coated on the electron extraction layers under N2 atmosphere from a homogeneous solution of 20 mg mL−1. The solution was prepared by dissolving PTB7 and PC71BM in chlorobenzene with a 3% volume ratio of 1,8-diiodooctane (DIO) additive. Finally, MoO3 (10 nm) and Ag (100 nm) were thermally evaporated at a pressure below 2 × 10⁻⁶ Torr.
:PC71BM/MoO3/Ag. The ITO-coated glass substrates were pre-cleaned with deionized water, acetone, and isopropanol in an ultrasonic bath for 15 min each. Subsequently, a thin layer (approximately 25 nm, Fig. S1, ESI†) of rutile or anatase TiO2 (10 wt%) was spin-coated onto ITO glasses and dried on a hot plate at 130 °C for 30 min. The device based on amorphous TiO2 as a reference was prepared using a sol–gel method, in which the TiO2 precursor solution was spin-coated on the ITO-coated glass with a procedure reported previously.33 Subsequently, the active layer PTB7:PC71BM (1:1.5 weight ratio) was spin-coated on the electron extraction layers under N2 atmosphere from a homogeneous solution of 20 mg mL−1. The solution was prepared by dissolving PTB7 and PC71BM in chlorobenzene with a 3% volume ratio of 1,8-diiodooctane (DIO) additive. Finally, MoO3 (10 nm) and Ag (100 nm) were thermally evaporated at a pressure below 2 × 10⁻⁶ Torr.
2.5 Device characterization
The current density–voltage (J–V) characteristics were measured using a Keithley 6430 Source Measure Unit. The performance measurements of the OSCs were carried out using an Air Mass 1.5 Global (AM 1.5 G) solar simulator with an irradiation intensity of 100 mW cm−2 (SAN-EI Electric XEC-301S solar simulator). The incident photon to current efficiency (IPCE) was measured by Zolix Solar Cell Scan 100.
3. Results and discussion
The morphology of the as-obtained nanocrystals was investigated by TEM. As shown in Fig. 1(a) and (b), the monodispersed anatase and rutile TiO2 nanoparticles exhibit an average size of 11.0 nm and 12.4 nm, respectively (insets of Fig. 1(a) and (b)). The HRTEM images demonstrate that these two kinds of TiO2 nanoparticles are well-crystalline (Fig. 1(c) and (d)). The interplanar distances of the lattice fringes are 0.22 nm and 0.19 nm, corresponding to the (111) planes of the anatase TiO2 crystal and (200) planes of the rutile TiO2 crystal.34,35
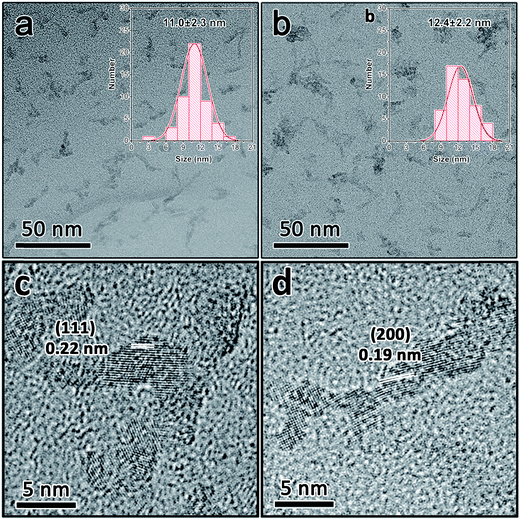 |
| | Fig. 1 TEM images of anatase (a) and rutile (b) TiO2 nanocrystals. HRTEM image of anatase (c) and rutile (d) TiO2 nanocrystals. | |
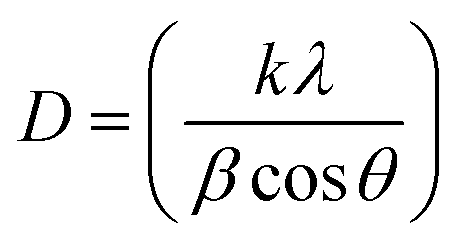
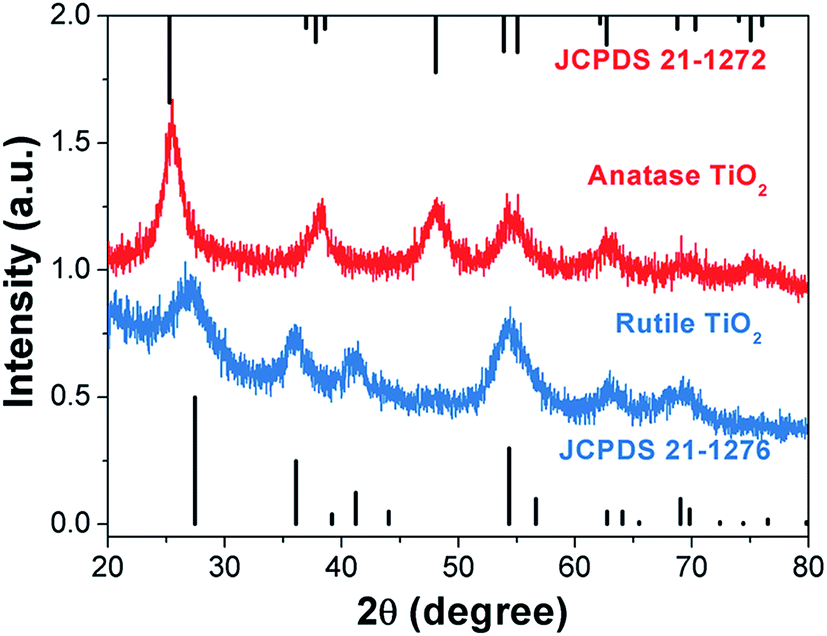
Fig. 2 shows X-ray diffraction patterns of the anatase TiO2 and rutile TiO2 nanocrystals. The diffraction peaks for the pure samples can be completely indexed to the anatase phase TiO2 and rutile phase TiO2 (JCPDS card file no. 21-1272 and no. 21-1276).36,37 Both samples possess high purity. The grain size of these two kinds of TiO2 nanocrystals was determined by the X-ray diffraction using the Scherrer equation:
| |
 | (1) |
where
D is the grain size in nanometers,
λ is the wavelength of the radiation (1.54056 Å for Cu Kα radiation),
k is a constant equal to 0.94,
β is the peak width at half-maximum intensity and
θ is the peak position.
38,39 The average crystalline grain sizes are ∼4.0 and 3.8 nm for the anatase TiO
2 and rutile TiO
2 nanocrystals, respectively. The grain sizes of these two TiO
2 nanocrystals are smaller than the particle size according to the TEM images, indicating both TiO
2 nanocrystals are polycrystalline.
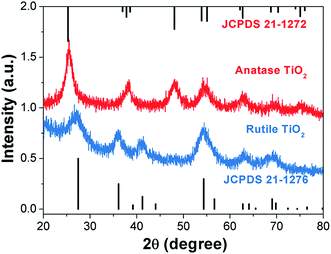 |
| | Fig. 2 XRD patterns of anatase and rutile TiO2 nanocrystals. | |
To determine the composition and identify the chemical states of the anatase and rutile TiO2 nanocrystals, XPS analysis was carried out. Fig. 3 shows Ti 2p and O 1s regions of the high resolution XPS spectra of the anatase and rutile TiO2 nanocrystals. The two strong peaks from the anatase and rutile TiO2 nanocrystals at around 465.2 eV and 459.5 eV with symmetry can be attributed to Ti 2p1/2 and Ti 2p3/2, respectively (Fig. 3(a) and (c)).40 The peak positions and 5.8 eV peak separation of the Ti 2p doublet agree well with the energy reported for TiO2 nanoparticles.41,42 Fig. 3(b) and (d) present the O 1s XPS spectra of the above two samples. The peaks of O 1s are located at about 530.8 eV, whose energy is equal to the O 1s electron binding energy for TiO2.43 Also, there is one more peak in both samples observed at binding energy of 532.0 eV, which was attributed to the H–O from the absorbed H2O on their surface.44 Although the atomic ratio of Ti/Sn was about 4:1 in the initial reactant, the signal of the Sn4+ was not detected in the XPS spectrum of the rutile TiO2, which is consistent with previous literature.32 Fourier-transform infrared spectra (FTIR) of the as-prepared TiO2 nanocrystals were measured (Fig. S2, ESI†). These results demonstrate that there is no ligand or surfactant on their surfaces.
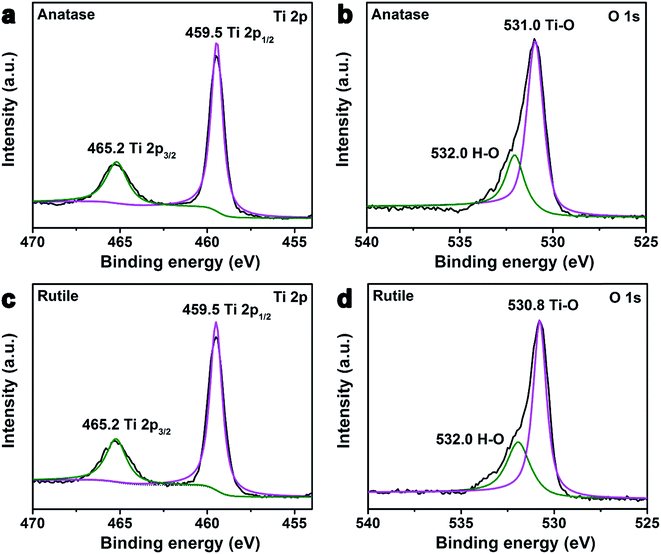 |
| | Fig. 3 XPS spectra of anatase and rutile TiO2 nanocrystals. High resolution Ti 2p spectra for (a) anatase and (c) rutile TiO2 nanocrystals. High resolution O 1s spectra for (b) anatase and (d) rutile TiO2 nanocrystals. | |
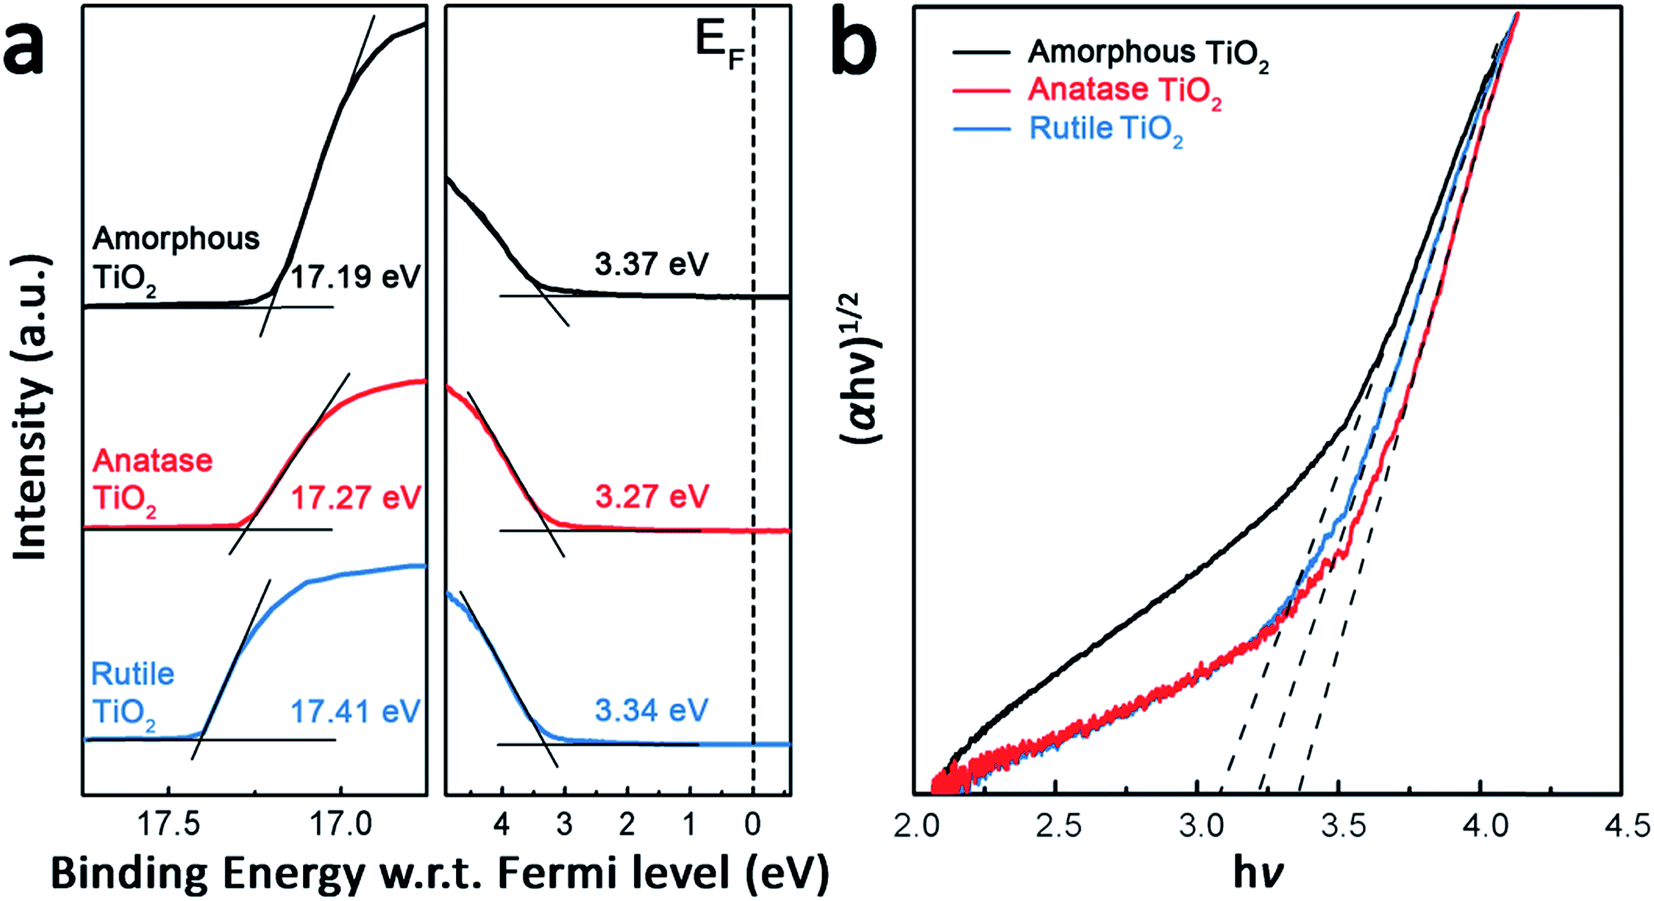
The UPS and UV-visible absorption spectra of the anatase and rutile TiO2 films are shown in Fig. 4 to study their energy levels. For comparison, a film of amorphous TiO2 was prepared as the reference interfacial layer by using a procedure reported previously.33 The valence band maximum (VBM) level values of the TiO2 films can be calculated from Fig. 4(a), meanwhile, according to the classical Tauc’s formula (eqn (2)) for an indirect band gap semiconductor, the optical band gap (Eg) can also be calculated from the Fig. 4(b).33
| | |
(αhv)1/2 = A(hv − Eg)
| (2) |
where
α is the absorption coefficient,
hv is the incident photon energy and
A is a constant.
45 Thus, the conduction band minimum (CBM) level values of the TiO
2 films could be determined by the VBM and
Eg. All of the above energy level results are summarized in
Table 1. The band gap of anatase TiO
2 increased from 3.2 eV (bulk material) to 3.3 eV (nanocrystal), and the band gap of rutile TiO
2 increased from 3.0 eV (bulk material) to 3.2 eV (nanocrystal).
46 These results, which are consistent with previous literature, could be explained by the quantum confinement effect.
47
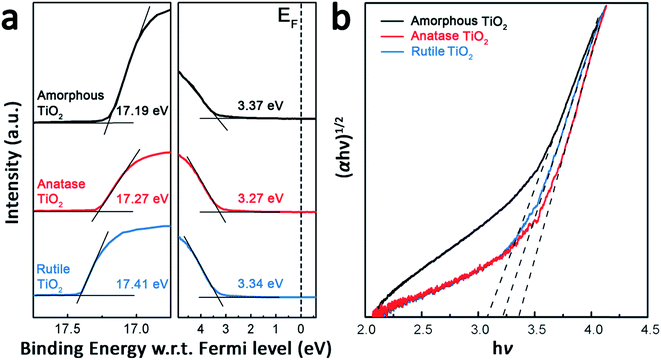 |
| | Fig. 4 (a) UPS spectra of various TiO2 (amorphous, anatase and rutile TiO2) films on ITO. (b) The plots of (αhv)1/2 versus photon energy (hv) for the three types of TiO2 films prepared on the quartz substrates. | |
Table 1 Summary of the energy levels for the three electron extraction layers
| Electron extraction layer |
VBM (eV) |
Eg (eV) |
CBM (eV) |
| Amorphous TiO2 |
7.40 ± 0.02 |
3.07 ± 0.02 |
4.33 ± 0.02 |
| Anatase TiO2 |
7.22 ± 0.02 |
3.35 ± 0.02 |
3.87 ± 0.02 |
| Rutile TiO2 |
7.15 ± 0.02 |
3.23 ± 0.02 |
3.92 ± 0.02 |
The structures of i-OSCs with the amorphous, anatase, and rutile TiO2 films as the electron extraction layers are shown in Fig. 5(a). The device structure is ITO/TiO2/PTB7:PC71BM/MoO3/Ag and the energy level diagrams of each component used in the devices are illustrated in Fig. 5(b). Due to the deep VBM level of these three kinds of TiO2, it is reasonable to realize the hole-blocking and thus reduce the loss of the interfacial charge recombination. On the other hand, because their CBM level values are closer to the lowest unoccupied molecular orbital (LUMO) of PC71BM, these TiO2 layers could easily create a quasi-ohmic contact, providing the effective electron transport pathways and enhancing electron extraction.48
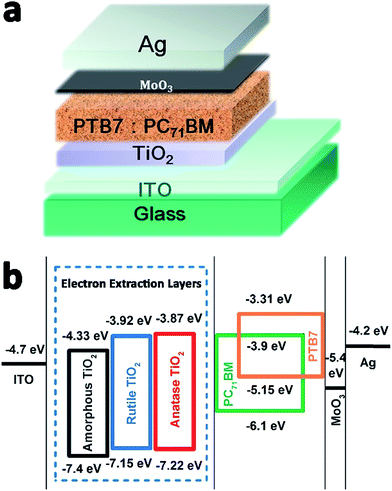 |
| | Fig. 5 (a) The structure of the inverted polymer solar cells. (b) Energy level diagram of the component materials used in device fabrication. | |
The current density versus voltage (J–V) characteristics of i-OSCs with the above three kinds of TiO2 interfacial layers under AM 1.5 G irradiation (100 mW cm−2) are shown in Fig. 6, and the detailed device parameters are summarized in Table 2. Compared with the devices fabricated by amorphous and rutile TiO2 layers, the optimized solar cell with the anatase TiO2 layer shows a significant enhancement in the performances: the short-circuit current density (JSC) increased from 13.92 mA cm−2 to 15.66 mA cm−2, the open-circuit voltage (VOC) from 0.69 V to 0.71 V, the fill factor (FF) from 63.57% to 70.63%, and consequently the PCE from 6.11% to 7.85%.
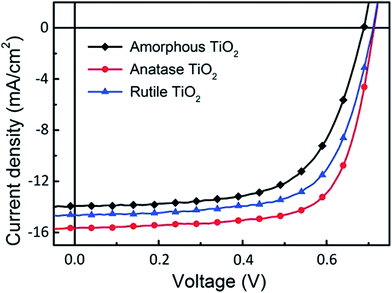 |
| | Fig. 6 The J–V characteristics of the inverted devices using amorphous, anatase and rutile TiO2 as electron extraction layers. | |
Table 2 The current density versus voltage (J–V) characteristics of the inverted devices by using amorphous, anatase and rutile TiO2 as electron extraction layers
| Device |
JSC (mA cm−2) |
VOC (V) |
FF (%) |
PCE (%) |
| Amorphous TiO2 |
13.92 |
0.69 |
63.57 |
6.11 |
| Anatase TiO2 |
15.66 |
0.71 |
70.63 |
7.85 |
| Rutile TiO2 |
14.64 |
0.71 |
66.69 |
6.93 |
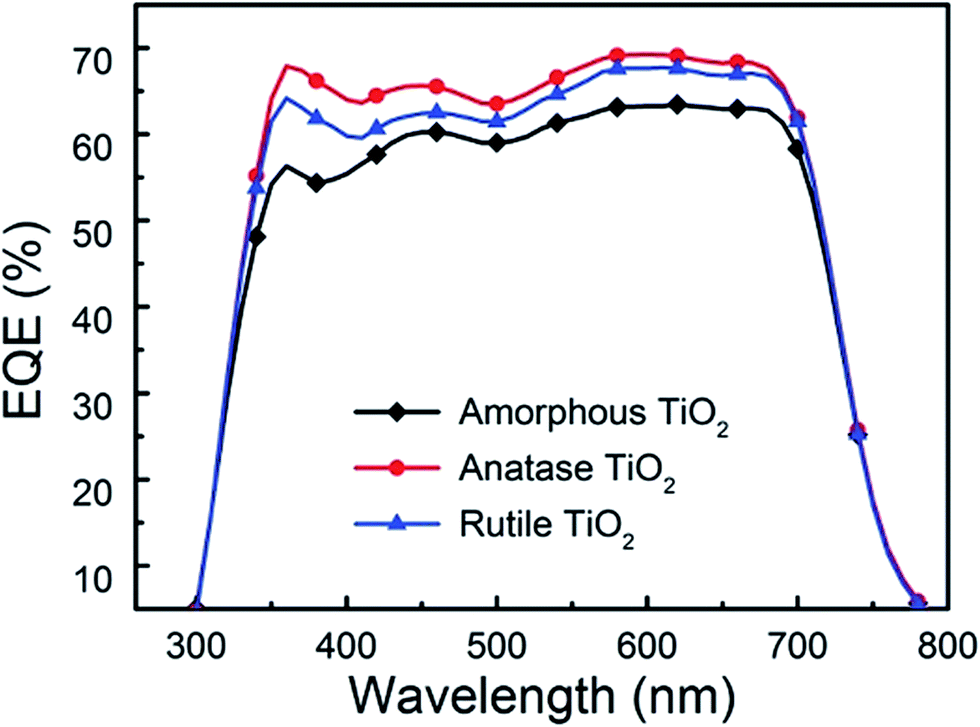
The external quantum efficiency (EQE) spectra of the above three devices are presented in Fig. 7. When the crystalline TiO2 films are used as electron extraction layers, the EQE of the device shows an obvious enhancement over a broad wavelength range, indicating that more electrons can be extracted and transported to ITO. Moreover, compared with the device using the rutile TiO2 films as interfacial layer, the anatase one shows improved EQE, which demonstrates that the anatase TiO2 nanocrystals have more effective electron extraction properties than the rutile TiO2 nanocrystals. Based on the results from the J–V and EQE spectra, we can conclude that the anatase TiO2 nanocrystals as electron extraction layer could significantly improve the PCE for the i-OSCs.
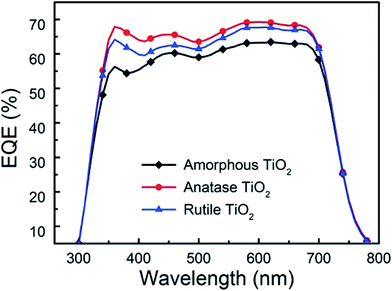 |
| | Fig. 7 The IPCE spectra of inverted devices using amorphous, anatase and rutile TiO2 as electron extraction layers. | |
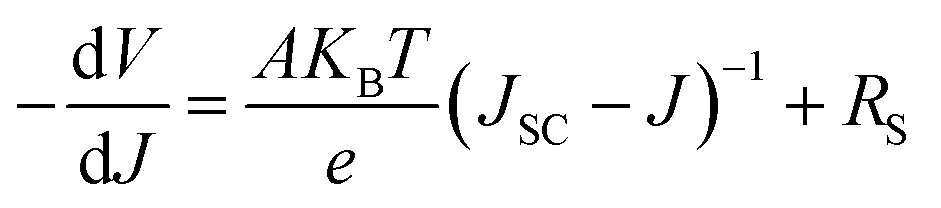
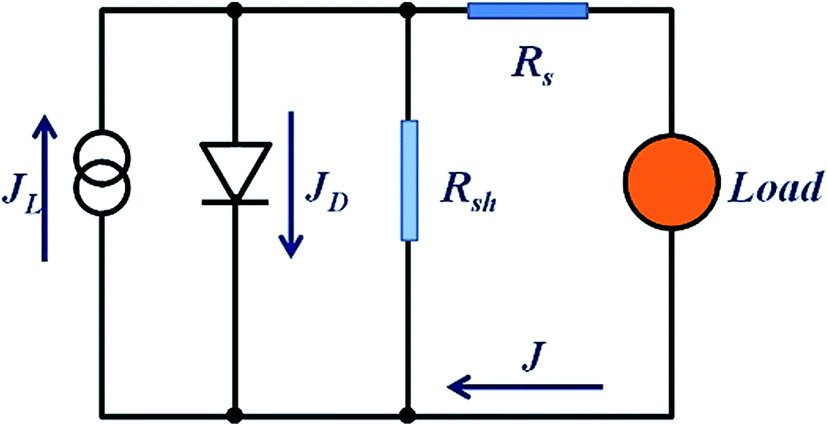
In order to further clarify the photovoltaic characteristics, a model based on the single heterojunction solar cell was set up to analyze the J–V property. According to the equivalent circuit in Fig. 8, the J–V characteristic could be described by the following equation:49
| |
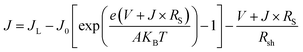 | (3) |
where
J is the current density flowing through the external load,
JL is the light induced constant current density,
J0 is the reverse saturated current density,
KB is the Boltzmann constant,
KB = 1.3806505(24) × 10
−23 J K
−1,
T is the absolute temperature,
T = 298.15 K,
e is the elementary charge,
e = 1.60217662 × 10
−19 C,
RS is the series resistance,
Rsh is the shunt resistance,
A is the ideality factor, and
V is the DC bias voltage that is applied to the cell. Some intrinsic parameters of the cell can be derived from
eqn (3) for an ideal heterojunction solar cell. Where
Rsh is very large, it can be deduced by
eqn (4) and
(5).
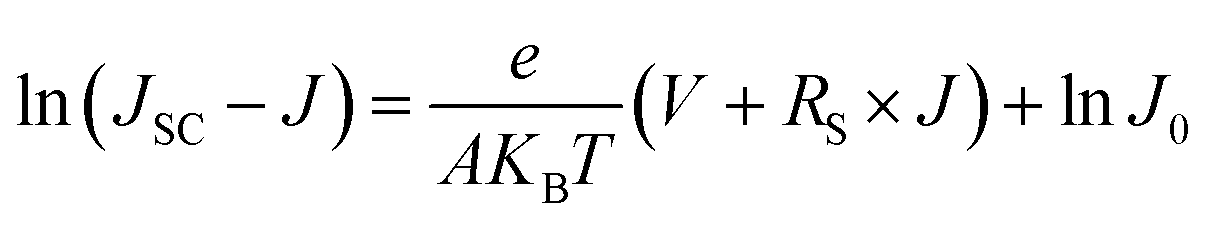
| |
 | (4) |
| |
 | (5) |
 |
| | Fig. 8 Single-diode equivalent circuit mode employed in describing the J–V behavior of the OPVs. | |
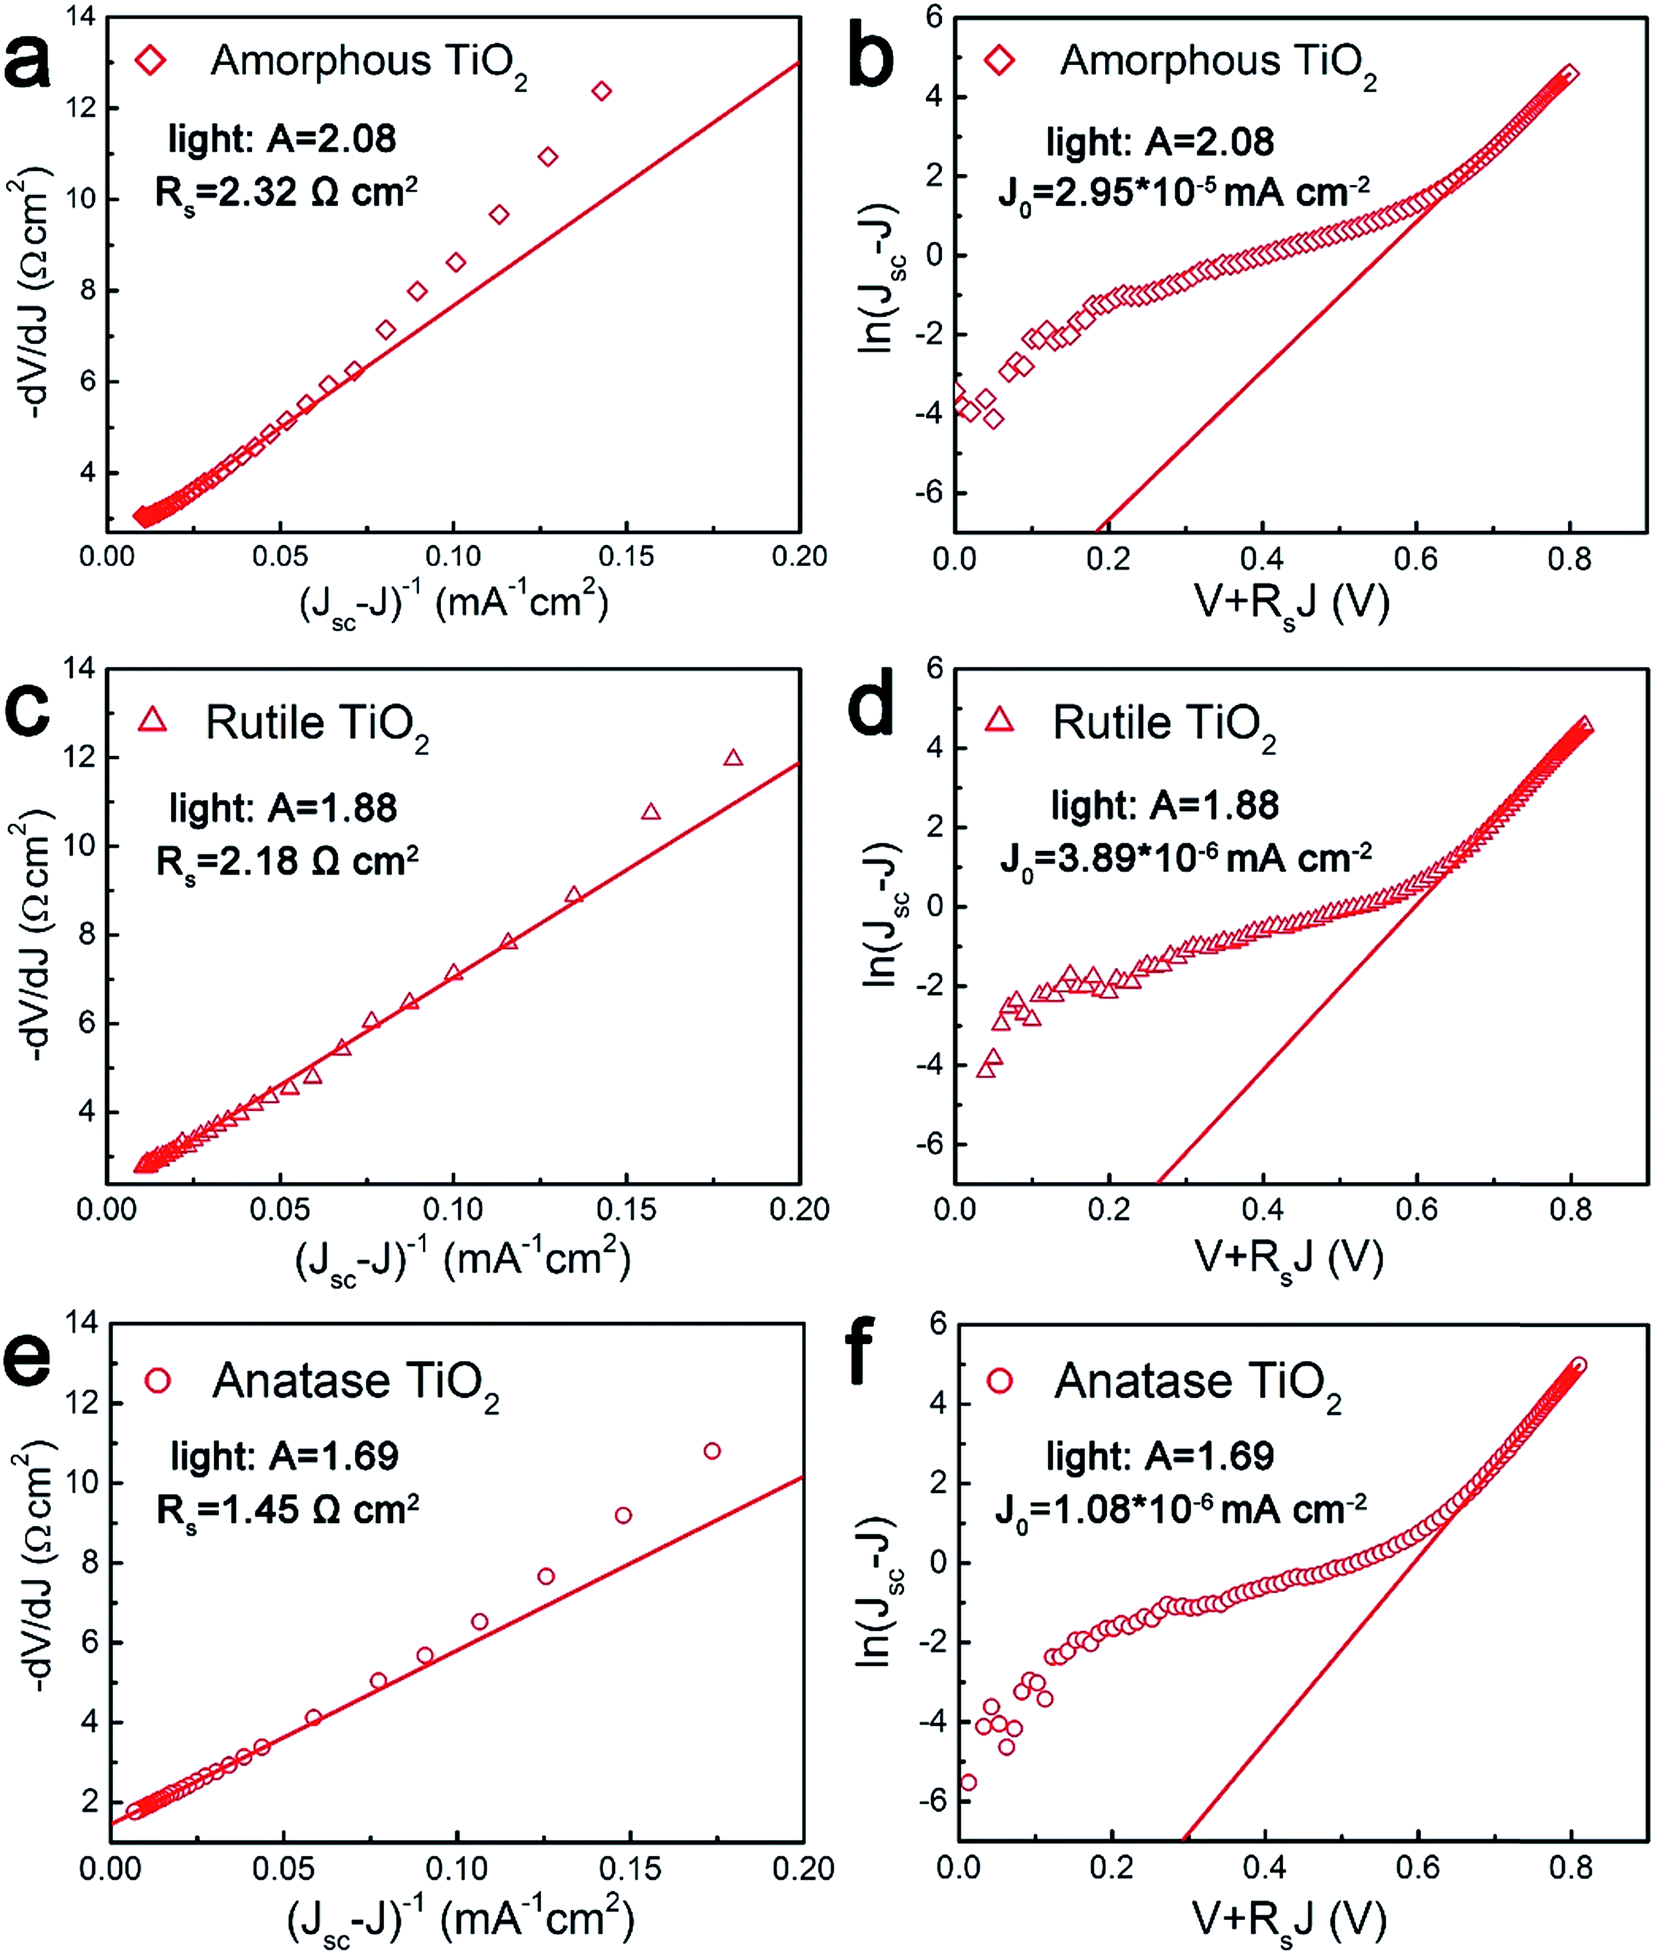
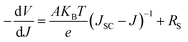
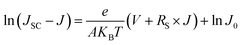
Fig. 9(a), (c) and (e) gives the plots of −dV/dJ versus (JSC − J)−1 and the linear fitting curves could be obtained according to eqn (4). It can be found that there is a good linear relationship between −dV/dJ and (JSC − J)−1. The ideality factor A and series resistance RS of the cell are derived from the slope and intercept of the linear fitting results, as shown in Table 3. Under illumination, the ideality factors are 2.08 for amorphous TiO2, 1.88 for rutile TiO2 and 1.69 for anatase TiO2, respectively. And the series resistances are 2.32 Ω cm2 for amorphous TiO2, 2.18 Ω cm2 for rutile TiO2 and 1.45 Ω cm2 for anatase TiO2.
 |
| | Fig. 9 Plots of −dV/dJ vs. (JSC − J)−1 and the linear fitting curves (a), (c) and (e), plots of ln(JSC − J) against V + RSJ and the linear fitting curves (b), (d) and (f) from the devices fabricated by using amorphous, rutile and anatase TiO2 as electron extraction layers. | |
Table 3 Summary of extracted parameters fitted by the plots of −dV/dJ vs. (JSC − J)−1 and the plots of ln(JSC − J) against V + RSJ from the devices prepared by using amorphous, anatase and rutile TiO2 as electron extraction layers
| Device |
A |
RS (Ω cm2) |
J0 (mA cm−2) |
| Amorphous TiO2 |
2.08 |
2.32 |
2.95 × 10⁻⁵ |
| Anatase TiO2 |
1.69 |
1.45 |
1.08 × 10⁻⁶ |
| Rutile TiO2 |
1.88 |
2.18 |
3.89 × 10⁻⁶ |
As we know, a small series resistance is necessary for a high-performance solar cell with a high fill factor according to eqn (3). Therefore, the device based on anatase TiO2 shows the best performance among these three devices. The value of the ideality factor represents the quality of a junction and the carrier recombination mechanism in a heterojunction solar cell. For a well-behaved heterojunction solar cell, the ideality factor is typically in the range 1.3 < A < 2. When the diode current of a PN junction is dominated by the carrier diffusion in the neutral region of semiconductors, A is approaching 1. On the other hand, when carrier recombination in the depleted space-charge region dominates the diode current, A is approaching 2. For most cases, both carrier diffusion and recombination happened simultaneously, with A having a corresponding value in the range 1 < A < 2. For the cells based on TiO2 nanocrystals, A is between the ideal regions, which indicates that the cells agree well with the heterojunction solar cell model. For the cell based on amorphous TiO2, the ideality factor is larger than 2, which means that there are additional recombination mechanisms besides the recombination in the charge neutral region and space charge region.49 The higher values of A and RS from the device employing rutile TiO2 compared to the device based on anatase TiO2 illuminates that a higher level charge recombination occurs and leads to the poor fill factor and short circuit current.
Fig. 9(b), (d) and (f) gives the plots of ln(JSC − J) versus V + RSJ and there is also a linear relationship between them. The reverse saturated current density of the cells is 2.95 × 10⁻⁵ mA cm−2 for amorphous TiO2, 3.89 × 10⁻⁶ mA cm−2 for rutile TiO2 and 1.08 × 10⁻⁶ mA cm−2 for anatase TiO2. According to eqn (3), when Rsh is large enough, the VOC of a heterojunction solar cell can be deduced as:
| |
 | (6) |
It is obvious that the VOC is determined by the ideality factor, working temperature, light-induced current, and the reverse saturated current of the cell. A low J0 together with a large ideality factor are key factors for a high VOC. For the devices based on the rutile and anatase TiO2, the values of ideality factor and the reverse saturated current are close, which results in the same VOC. For the device based on the amorphous TiO2, the reverse saturated current is of the order of 10−5 magnitude. But as A and J0 have opposite effects on VOC as shown in eqn (6), this result indicate that J0 plays a bigger role in changing VOC. So the larger J0 of the device based on amorphous TiO2 causes the open-circuit voltage to decrease. Similar results have been observed in previous studies.50,51
In order to investigate the recombination kinetics of the devices, the open-circuit photovoltage decay (OCVD) measurements were conducted. OCVD has been widely used to study recombination in DSSCs and perovskite solar cells.52,53 The cells are illuminated at open circuit to establish a photo stationary state. The light is then switched off, and the decay in VOC is monitored as a function of time. Zaban et al. proposed that the rate of photovoltage decay is inversely proportional to the lifetime of the photoelectron in the DSSCs, and that the lifetime of the electron is inversely proportional to the rate of recombination.52 Experimental OCVD decay plots for the above three devices are shown in Fig. 10. The open-circuit voltage of the cell based on amorphous TiO2 decays rapidly, falling below 0.1 V within 100 ms. By contrast, the devices based on the crystalline TiO2 nanocrystals, especially for anatase TiO2, exhibited a remarkably slow decay of VOC, indicating their superior recombination characteristics.
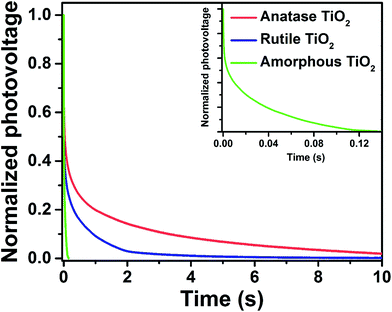 |
| | Fig. 10 Open-circuit voltage decays for the three types of TiO2 based OSCs. | |
4. Conclusion
In summary, we synthesized ligand-free rutile and anatase TiO2 nanocrystals by using a simple hydrolytic sol–gel reaction. The monodispersed anatase and rutile TiO2 nanocrystals with high purity exhibited a branched structure. Moreover, we demonstrated that the use of anatase TiO2 nanocrystals as an electron extraction layer for i-OSCs dramatically improves the devices’ power conversion efficiency. Meanwhile, the ideal model for a single heterojunction solar cell has been applied to clarify the cell characteristics. Analysis from the diode parameters shows that anatase TiO2 nanocrystals could reduce the carrier recombination and improve the performance. It is expected that the ligand-free anatase TiO2 nanocrystals may have other promising applications in energy-related fields.
Acknowledgements
This work was supported by National Natural Science Foundation of China (No. 61377028, 61475014, 61475017, 61674012, 61675018), The Fundamental Research Funds for the Central Universities (2014JBZ009).
References
- H.-L. Yip and A. K. Y. Jen, Energy Environ. Sci., 2012, 5, 5994–6011 CAS.
- C.-C. Chueh, C.-Z. Li and A. K. Y. Jen, Energy Environ. Sci., 2015, 8, 1160–1189 CAS.
- F. C. Krebs, Sol. Energy Mater. Sol. Cells, 2009, 93, 394–412 CrossRef CAS.
- G. Li, R. Zhu and Y. Yang, Nat. Photonics, 2012, 6, 153–161 CrossRef CAS.
- J.-D. Chen, C. Cui, Y.-Q. Li, L. Zhou, Q.-D. Ou, C. Li, Y. Li and J.-X. Tang, Adv. Mater., 2015, 27, 1035–1041 CrossRef CAS PubMed.
- I. Etxebarria, J. Ajuria and R. Pacios, Org. Electron., 2015, 19, 34–60 CrossRef CAS.
- M. Jørgensen, K. Norrman, S. A. Gevorgyan, T. Tromholt, B. Andreasen and F. C. Krebs, Adv. Mater., 2012, 24, 580–612 CrossRef PubMed.
- Q. Lu, Z. Lu, Y. Lu, L. Lv, Y. Ning, H. Yu, Y. Hou and Y. Yin, Nano Lett., 2013, 13, 5698–5702 CrossRef CAS PubMed.
- Z. He, C. Zhong, S. Su, M. Xu, H. Wu and Y. Cao, Nat. Photonics, 2012, 6, 591–595 Search PubMed.
- L. M. Chen, Z. Hong, G. Li and Y. Yang, Adv. Mater., 2009, 21, 1434–1449 CrossRef CAS.
- Y. Sun, C. J. Takacs, S. R. Cowan, J. H. Seo, X. Gong, A. Roy and A. J. Heeger, Adv. Mater., 2011, 23, 2226–2230 CrossRef CAS PubMed.
- J. Meyer, S. Hamwi, M. Kröger, W. Kowalsky, T. Riedl and A. Kahn, Adv. Mater., 2012, 24, 5408–5427 CrossRef CAS PubMed.
- Y. Sun, J. H. Seo, C. J. Takacs, J. Seifter and A. J. Heeger, Adv. Mater., 2011, 23, 1679–1683 CrossRef CAS PubMed.
- M. Reinhard, J. Hanisch, Z. Zhang, E. Ahlswede, A. Colsmann and U. Lemmer, Appl. Phys. Lett., 2011, 98, 053303 CrossRef.
- H.-H. Liao, L.-M. Chen, Z. Xu, G. Li and Y. Yang, Appl. Phys. Lett., 2008, 92, 173303 CrossRef.
- G. Wang, T. Jiu, G. Tang, J. Li, P. Li, X. Song, F. Lu and J. Fang, ACS Sustainable Chem. Eng., 2014, 2, 1331–1337 CrossRef CAS.
- P. Cheng and X. Zhan, Chem. Soc. Rev., 2016, 45, 2544–2582 RSC.
- Y. Zhou, C. Fuentes-Hernandez, J. Shim, J. Meyer, A. J. Giordano, H. Li, P. Winget, T. Papadopoulos, H. Cheun and J. Kim, Science, 2012, 336, 327–332 CrossRef CAS PubMed.
- J. B. Joo, Q. Zhang, I. Lee, M. Dahl, F. Zaera and Y. Yin, Adv. Funct. Mater., 2012, 22, 166–174 CrossRef CAS.
- L. Sang, Y. Zhao and C. Burda, Chem. Rev., 2014, 114, 9283–9318 CrossRef CAS PubMed.
- Y. Luan, L. Jing, Q. Meng, H. Nan, P. Luan, M. Xie and Y. Feng, J. Phys. Chem. C, 2012, 116, 17094–17100 CAS.
- X. Chen and S. S. Mao, Chem. Rev., 2007, 107, 2891–2959 CrossRef CAS PubMed.
- A. Hadipour, D. Cheyns, P. Heremans and B. P. Rand, Adv. Energy Mater., 2011, 1, 930–935 CrossRef CAS.
- S. Agarwala and G. Ho, Mater. Lett., 2009, 63, 1624–1627 CrossRef CAS.
- S. Agarwala, M. Kevin, A. Wong, C. Peh, V. Thavasi and G. Ho, ACS Appl. Mater. Interfaces, 2010, 2, 1844–1850 CAS.
- S. Agarwala, C. Peh and G. Ho, ACS Appl. Mater. Interfaces, 2011, 3, 2383–2391 CAS.
- S. Agarwala, L. Thummalakunta, C. Cook, C. Peh, A. Wong, L. Ke and G. Ho, J. Power Sources, 2011, 196, 1651–1656 CrossRef CAS.
- M. H. Park, J. H. Li, A. Kumar, G. Li and Y. Yang, Adv. Funct. Mater., 2009, 19, 1241–1246 CrossRef CAS.
- J. Ovenstone and K. Yanagisawa, Chem. Mater., 1999, 11, 2770–2774 CrossRef CAS.
- J.-H. Huang, H.-Y. Wei, K.-C. Huang, C.-L. Chen, R.-R. Wang, F.-C. Chen, K.-C. Ho and C.-W. Chu, Energy Environ. Sci., 2010, 3, 654–658 CAS.
- S. Chen, C. E. Small, C. M. Amb, J. Subbiah, T. h. Lai, S. W. Tsang, J. R. Manders, J. R. Reynolds and F. So, Adv. Energy Mater., 2012, 2, 1333–1337 CrossRef CAS.
- G. Xiang, Y.-G. Wang, D. Wu, T. Li, J. He, J. Li and X. Wang, Chem.–Eur. J., 2012, 18, 4759–4765 CrossRef CAS PubMed.
- L. Lv, Q. Lu, Y. Ning, Z. Lu, X. Wang, Z. Lou, A. Tang, Y. Hu, F. Teng and Y. Yin, Chem. Mater., 2015, 27, 44–52 CrossRef CAS.
- J. Zhang, L. Qian, L. Yang, X. Tao, K. Su, H. Wang, J. Xi and Z. Ji, Appl. Surf. Sci., 2014, 311, 521–528 CrossRef CAS.
- S.-C. Zhu, S.-H. Xie and Z.-P. Liu, J. Am. Chem. Soc., 2015, 137, 11532–11539 CrossRef CAS PubMed.
- Y. Dong, X. Fei, Z. Liu, Y. Zhou and L. Cao, Appl. Surf. Sci., 2017, 394, 386–393 CrossRef CAS.
- C. Liang, Z. Wu, P. Li, J. Fan, Y. Zhang and G. Shao, Appl. Surf. Sci., 2017, 391, 337–344 CrossRef CAS.
- H. Liu, J. B. Joo, M. Dahl, L. Fu, Z. Zeng and Y. Yin, Energy Environ. Sci., 2015, 8, 286–296 CAS.
- K. Muthukrishnan, M. Vanaraja, S. Boomadevi, R. K. Karn, V. Singh, P. K. Singh and K. Pandiyan, J. Alloys Compd., 2016, 673, 138–143 CrossRef CAS.
- S. Wang, J. Lian, W. Zheng and Q. Jiang, Appl. Surf. Sci., 2012, 263, 260–265 CrossRef CAS.
- W. Hu, Y. Liu, R. L. Withers, T. J. Frankcombe, L. Norén, A. Snashall, M. Kitchin, P. Smith, B. Gong, H. Chen, J. Schiemer, F. Brink and J. Wong-Leung, Nat. Mater., 2013, 12, 821–826 CrossRef CAS PubMed.
- J. Park, T. Back, W. C. Mitchel, S. S. Kim, S. Elhamri, J. Boeckl, S. B. Fairchild, R. Naik and A. A. Voevodin, Sci. Rep., 2015, 5, 14374 CrossRef CAS PubMed.
- S. S. Mali, C. A. Betty, P. N. Bhosale and P. Patil, ECS J. Solid State Sci. Technol., 2012, 1, M15–M23 CrossRef CAS.
- C. C. Chen, Y. P. Fu and S. H. Hu, J. Am. Ceram. Soc., 2015, 98, 2803–2811 CrossRef CAS.
- T. B. Yang, M. Wang, C. H. Duan, X. W. Hu, L. Huang, J. B. Peng, F. Huang and X. Gong, Energy Environ. Sci., 2012, 5, 8208–8214 CAS.
- D. O. Scanlon, C. W. Dunnill, J. Buckeridge, S. A. Shevlin, A. J. Logsdail, S. M. Woodley, C. R. A. Catlow, M. J. Powell, R. G. Palgrave, I. P. Parkin, G. W. Watson, T. W. Keal, P. Sherwood, A. Walsh and A. A. Sokol, Nat. Mater., 2013, 12, 798–801 CrossRef CAS PubMed.
- N. Satoh, T. Nakashima, K. Kamikura and K. Yamamoto, Nat. Nanotechnol., 2008, 3, 106–111 CrossRef CAS PubMed.
- E. Ghadiri, N. Taghavinia, S. M. Zakeeruddin, M. Grätzel and J.-E. Moser, Nano Lett., 2010, 10, 1632–1638 CrossRef CAS PubMed.
- S. S. Hegedus and W. N. Shafarman, Prog. Photovoltaics, 2004, 12, 155–176 CAS.
- K. Vandewal, K. Tvingstedt, A. Gadisa, O. Inganas and J. V. Manca, Nat. Mater., 2009, 8, 904–909 CrossRef CAS PubMed.
- G. Long, X. Wan, B. Kan, Y. Liu, G. He, Z. Li, Y. Zhang, Y. Zhang, Q. Zhang and M. Zhang, Adv. Energy Mater., 2013, 3, 639–646 CrossRef CAS.
- A. Zaban, M. Greenshtein and J. Bisquert, ChemPhysChem, 2003, 4, 859–864 CrossRef CAS PubMed.
- A. Pockett, G. E. Eperon, T. Peltola, H. J. Snaith, A. Walker, L. M. Peter and P. J. Cameron, J. Phys. Chem. C, 2015, 119, 3456–3465 CAS.
Footnote |
| † Electronic supplementary information (ESI) available. See DOI: 10.1039/c7ra00134g |
|
| This journal is © The Royal Society of Chemistry 2017 |
Click here to see how this site uses Cookies. View our privacy policy here. 
 Open Access Article
 This Open Access Article is licensed under a
  *,
Zhenbo Deng*,
Zhidong Lou,
Yanbing Hou
*,
Zhenbo Deng*,
Zhidong Lou,
Yanbing Hou