DOI:
10.1039/C7RA00115K
(Paper)
RSC Adv., 2017,
7, 10592-10600
Systematic study on preparation of copper nanoparticle embedded porous carbon by carbonization of metal–organic framework for enzymatic glucose sensor†
Received
4th January 2017
, Accepted 26th January 2017
First published on 8th February 2017
Abstract
Recently, metal–organic frameworks (MOFs) have been widely used in the preparation of metal oxide-embedded porous carbon composite materials. However, non-oxidized metal nanoparticle embedded porous carbon composites have rarely been prepared from MOFs to date. Herein, we present a systematic synthetic condition study of a Cu nanoparticle embedded porous carbon composite (Cu@C-500) by simple carbonization of a copper-based MOF (HKUST-1). The conditions for the synthesis of the pure Cu nanoparticles embedded composite were optimized by changing the reaction temperature and time. The prepared composite retained its original octahedron shape, with uniformly distributed copper nanoparticles (∼30 nm) in the carbon bed. The composite Cu@C-500 exhibited hierarchical porosity with a moderate surface area (195 m2 g−1). Due to its hierarchical porosity and unique redox activity, Cu@C-500 was examined for peroxidase-like catalytic activity, particularly for glucose sensing assays. The results indicated that this carbon composite displayed high catalytic activity similar to that of the peroxidase enzyme. Moreover, it presented one of the best detection limits (3.2 × 10⁻⁹ M) in colorimetric glucose sensing. In addition, Cu@C-500 exhibited good selectivity towards other sugars. The high sensitivity and selectivity of Cu@C-500 show great potential in the development of highly efficient glucose sensing devices.
1. Introduction
Metal–organic frameworks (MOFs) comprise metal ions (nodes) and carbon-containing organic ligands (linkers) that are periodically connected by coordination bonds.1–5 Because of the presence of well-defined pores, MOFs show great potential in various applications, including gas storage,5–10 separation,11–13 catalysis,14–18 transport,19–22 and sensing.23,24 However, these materials are usually unstable to moisture, and hence, their application in water-based fields has been limited. There have been several studies (the effects of coating,25 compositing,26 and carbonization on MOFs27–34) to overcome this problem. Notably, carbonization of MOFs is of great interest because the MOFs contains both a metal and a carbon sources for the preparation of composite materials. Therefore, simple pyrolysis of the MOF allows the formation of metal- or metal oxide-embedded carbon composite materials. In addition, pores are usually generated during the carbonization process. Therefore, porous carbon composite materials can be easily prepared by a simple MOF carbonization process. As a result of this concept, the production of many metal oxide-embedded porous carbon composites has been recently reported.31–37 The prepared materials exhibited interesting catalytic activity in organic transformation,31 supercapacitor33/battery34 electrode and sensing35–37 applications. However, pure metal-embedded porous carbon composites have rarely been prepared from MOFs to date. In addition, it is difficult to control the oxidation state of metal oxides in MOF during carbonization reactions. In addition, systematic synthetic condition optimization for the preparation of pure metal nanoparticle embedded system has scarcely reported. Therefore, investigation of oxidation state control, and preparation of pure metal-nanoparticle-embedded porous carbon composites from MOFs are two of the most important issues in the MOF carbonization research field.
For the preparation of pure metal-nanoparticle-embedded carbon composites, the metal in the MOF should be inert and in a neutral form. Thus, we selected copper as the metal source because of its low cost and inertness to air. We selected the best known copper-based MOF, HKUST-1,38 as the candidate. Although a similar study was reported,36,37 none of them reported pure copper nanoparticle embedded system (the reported composite was a mixture of Cu and Cu2O nanoparticles). Furthermore, none of the work has reported systematic study for the preparation of pure metal nanoparticle embedded system. For better application, however, preparation of pure copper nanoparticle embedded materials is important for further application. Herein, we present the first systematic study of pure copper nanoparticle and synthetic condition optimization of the analysis of the resulting composite materials. The systematic synthetic condition study suggests that the copper to copper oxide ratio is depending on the conditions of the carbonization reaction (temperature and time). Thus, the pure Cu nanoparticle embedded porous carbon composite (Cu@C-500) was prepared by carbonization of HKUST-1 at 500 °C for 10 h. The copper nanoparticles (30 nm) were uniformly distributed in the carbon bed of the composite material. Porosity analysis suggested that the material has a hierarchical porosity with a modest surface area. Therefore, we predicted that the composite material should exhibit interesting catalytic activity due to the presence of redox active copper nanoparticles, and hierarchical porosity for molecular diffusion. To the best of our knowledge, this work is the first systematic study in pure metal nanoparticle embedded porous carbon synthesis by pyrolysis of MOFs.
Recently, metal nanoparticle39 or metal nanoparticle embedded composite materials have been widely used for enzyme mimicking catalysis applications.40 Among many biological catalytic reactions, peroxidase-like catalytic activity has drawn much attention due to its wide potential applications (such as decomposition of reactive oxygen species).41 The peroxidase-like catalytic activity of Cu@C-500 has been studied using a 3,3′,5,5′-tetramethylbenzidine (TMB) assay.40 In addition, Cu@C-500 was further employed in a colorimetric glucose sensing assay (Scheme 1). Interestingly, the material exhibits one of the best detection limits (3.2 × 10⁻⁹ M) in colorimetric glucose sensing assays recorded in literature. Hierarchical porosity for enzyme and molecular diffusion and uniform distribution of pure metal nanoparticle may affect to the high sensitivity and selectivity of the sensor material.
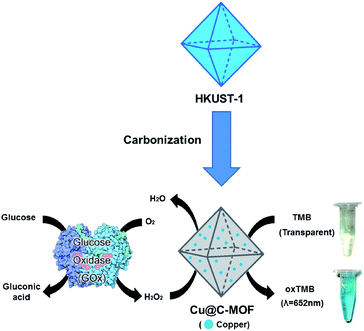 |
| | Scheme 1 Glucose sensing assay using Cu@C-500 composite material. | |
2. Experimental
2.1 Reagents and materials
All the sugars (glucose, mannose, galactose, sucrose, fructose), copper(II) nitrate trihydrate [Cu(NO3)2·3H2O], glucose oxidase (GOx, >100![[thin space (1/6-em)]](https://www.rsc.org/images/entities/char_2009.gif) 000 units per g), sodium acetate buffer solution, and activated carbon were purchased from Sigma-Aldrich. Benzene-1,3,5-tricarboxylic acid and 3,3′,5,5′-tetramethylbenzidine (TMB) were purchased from Alfa Aesar. Most of the solvents, namely, N,N-dimethylformamide (DMF), ethanol, glacial acetic acid, dimethyl sulfoxide (DMSO), hydrogen peroxide (H2O2, 34.5%), and phosphate buffered-saline (PBS) buffer were purchased from a Korean chemical company (Samchun chemical). All the chemicals were used as received without further purification. Deionized Millipore water was used to prepare all the solutions.
000 units per g), sodium acetate buffer solution, and activated carbon were purchased from Sigma-Aldrich. Benzene-1,3,5-tricarboxylic acid and 3,3′,5,5′-tetramethylbenzidine (TMB) were purchased from Alfa Aesar. Most of the solvents, namely, N,N-dimethylformamide (DMF), ethanol, glacial acetic acid, dimethyl sulfoxide (DMSO), hydrogen peroxide (H2O2, 34.5%), and phosphate buffered-saline (PBS) buffer were purchased from a Korean chemical company (Samchun chemical). All the chemicals were used as received without further purification. Deionized Millipore water was used to prepare all the solutions.
2.2 Preparation of HKUST-1
Benzene-1,3,5-tricarboxylic acid (0.25 g, 1.2 mmol) and copper(II) nitrate trihydrate (0.52 g, 2.15 mmol) were stirred for 15 min in 12 mL of a solvent that is a 1:1:1 mixture of DMF, ethanol, and deionized water.38 The resultant solution was divided into two portions (6 mL each) in 20 mL vials. The vials were tightly sealed and placed in an oven at 80 °C for 20 h. Blue octahedral crystals were afforded (85% yield). The crystals were washed with DMF (10 mL × 3 times), and stored under DMF until use. The solid was dried at 100 °C under dynamic vacuum before use to avoid the effect of the solvent during carbonization.
2.3 Synthesis of Cu@C-400, 500, 700
Copper-nanoparticle-embedded porous carbon composites were prepared by the simple pyrolysis of a copper-containing MOF (HKUST-1) at various temperatures under a N2 flow. For the preparation of the Cu@C composites, dried HKUST-1 was placed in an alumina boat at the center of a tube furnace. An inert atmosphere (N2) was achieved by applying five cycles of N2 and vacuum purges. The temperature of the tube furnace was elevated to the target temperature (400, 500, and 700 °C) with a heating rate of 10 °C min−1 under N2 flow (150 cm3 min−1). Various reaction times (6, 8, and 10 h) were used to establish the optimal temperature. The sample was cooled down naturally to room temperature, under N2 flow, and the product was recovered from the alumina boat (35% yield).
2.4 Characterization
The prepared Cu@C composites were analyzed using a Rigaku Ultima III X-ray diffractometer equipped with a Cu sealed tube (λ = 1.54178 Å). The following conditions were used: 40 kV, 30 mA, increment = 0.05°, scan speed = 3 deg min−1. The size and morphology of the Cu@C composites were determined by a scanning electron microscope (SEM) with an accelerating voltage of 30 kV (JEOL-7500F), and a transmission electron microscope (TEM) with an accelerating voltage of 300 kV (Tecnai G2). Detailed structural and compositional studies were carried out using a PHI-Quantera II X-ray photoelectron spectrometer (XPS) with a monochromatic Al Kα line X-ray setting (200 μm, 50 W, 15 kV). The specific surface areas and pore diameters of the products were calculated from a N2 adsorption isotherm measured by Micromeritics ASAP-2020; high-purity nitrogen gas (99.999%) was used for the measurements. Data from C, H, N, S elemental analysis was obtained using a VarioMICRO cube. Electronic absorption spectra were measured on a Shimadzu UV-Vis spectrophotometer (UV-2550) with a wavelength range of 300–800 nm.
2.5 Colorimetric H2O2 sensing activity study
Prior to the study of glucose sensing activity, the H2O2 sensing activity of the composites was examined by TMB assay.40 The TMB stock solution was prepared by dissolving TMB (0.250 g, 1.04 mmol) in H2O (9.800 mL) and DMSO (0.200 mL). The catalyst (HKUST-1, Cu@C, copper foil, or activated carbon) stock solution was prepared by dispersing the catalyst (4 mg) in 10 mL of sodium acetate buffer solution. The TMB-based H2O2 sensing experiment was carried out by mixing the catalyst stock solution (50 μL), TMB stock solution (100 μL), and H2O2 (100 μL) in sodium acetate buffer solution (1000 μL). The resultant solution was incubated in a shaker for 3 min at room temperature. This was followed by filtration of the solid catalyst using a disk filter (PTFE, 0.5 μm). To monitor the H2O2 sensing activity, the absorbance of the filtered solution was measured by UV-Vis spectroscopy.
2.6 GOx-based colorimetric sensing study
For the study of glucose sensing activity using GOx enzymes,40 a GOx solution (1 μg μL−1) was prepared from a PBS buffer solvent. The sugar (glucose, mannose, galactose, sucrose, or fructose) stock solution (500 μM) was prepared by dissolution of the sugar in a PBS buffer solution. This was diluted to the designated concentration before use. The Cu@C solution was prepared by dispersing the catalyst (4 mg) in 10 mL sodium acetate buffer solution (pH 4.5). The TMB solution was prepared by dissolving TMB (0.250 g, 1.04 mmol) in H2O (9.800 mL) and DMSO (0.200 mL). The GOx enzyme-based glucose sensing experiment was carried out by mixing the GOx (10 μL) and sugar (300 μL) solutions. The mixture was incubated in an isothermal shaker at 40 °C for 3 min. The Cu@C (50 μL) and TMB (100 μL) solutions were then added to the enzyme solution. This was followed by incubation in an isothermal shaker at 40 °C for 3 min. The reaction mixture was filtered using a disk filter (PTFE, 0.5 μm), and the absorbance of the resultant solution was measured by UV-Vis spectroscopy.
3. Results and discussion
3.1 Synthesis of the Cu@C composites
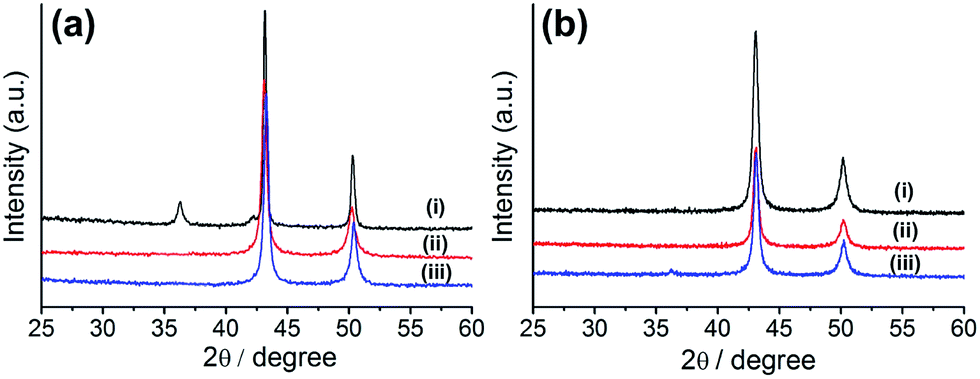
Although a couple of research groups have used HKUST-1 for the preparation of copper oxide-embedded porous carbon composite materials,36,37 the formation of a pure copper-nanoparticle-embedded porous carbon composite is unprecedented. Therefore, we tried to optimize the synthetic conditions for the preparation of this composite by varying the reaction conditions (time and temperature). For the preparation of metal-embedded porous carbon composites, we applied the pyrolysis method using a tube furnace under N2 flow, as reported in literature. Hence, HKUST-1 was carbonized at various temperatures (400, 500, and 700 °C) for 10 h. The composites prepared at various temperatures were characterized by powder X-ray diffraction (PXRD, Fig. 1a). The composite prepared at 700 °C (Cu@C-700) displayed both copper oxide (Cu2O: 36.5° and 42.1°, JCPDS 05-0667) and copper (Cu: 43.6° and 50.8°, JCPDS 04-0836) nanoparticle PXRD peaks, suggesting the formation of a Cu/Cu2O mixture. However, the composites prepared at 400 (Cu@C-400) and 500 °C (Cu@C-500) displayed PXRD peaks at 43.6° and 50.8° corresponding to (111) and (200) planes of pure copper nanoparticles, respectively. The particle size for Cu@C-500 was 28 nm. This was determined by applying the Scherrer equation [D = 0.89λ/βcosθ, where D is the average particle size, λ is the wavelength of the Cu-Kα irradiation, β is the intensity at the full width of half the maximum peak height of the diffraction peak, and θ is the diffraction angle for the (111) peak].
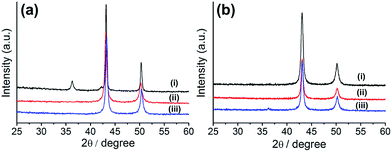 |
| | Fig. 1 (a) PXRD profiles of Cu embedded porous carbon prepared at temperatures of: (i) 700 °C, (ii) 500 °C, and (iii) 400 °C for 10 h; (b) PXRD profiles of Cu embedded carbon prepared at reaction times of (i) 10 h, (ii) 8 h, and (iii) 6 h at 500 °C. | |
The temperature experiments indicated that the carbon bed in the composites can work as a reducing agent during their synthetic process. Simultaneously, high reaction temperatures (>600 °C) allow the formation of a partially oxidized Cu2O species, resulting in the formation of a Cu/Cu2O composite material. For optimization of the pyrolysis time, we fixed the reaction temperature at 500 °C. This value was chosen because we supposed that a temperature of 400 °C would not be high enough for successful carbon bed formation to occur. The MOF was carbonized for various reaction times (6, 8, and 10 h), and the products were characterized by PXRD analysis (Fig. 1b). The results suggest that Cu2O peaks (at 36.5° and 42.1°) begin to appear as decreasing the pyrolysis time. This gives an indication of the minimum time required for the complete reduction of the copper ions. Therefore, we concluded that the pure copper-embedded porous carbon composite was successfully prepared by pyrolysis of HKUST-1 at 500 °C for 10 h, under N2 flow. Hence, we propose that the optimum temperature and reaction time for the preparation of pure Cu nanoparticle embedded porous carbon composites are 500 °C and 10 h, respectively.
3.2 Characterization of the Cu embedded carbon composites
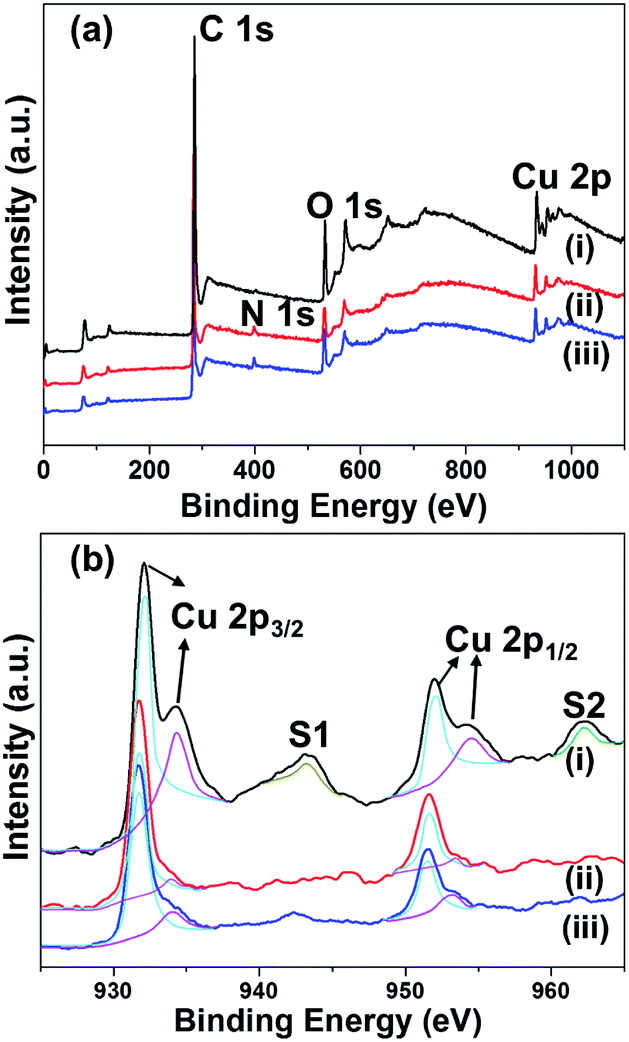
To understand the chemical and physical properties of the materials formed, we characterized the composite materials using various analytical methods. The PXRD results suggest the presence of Cu and/or Cu2O nanoparticles, depending on the reaction temperatures. X-ray photoelectron spectroscopy (XPS) was carried out in order to understand the composition and valence states of C, O, and Cu in the Cu embedded carbon composites. Fig. 2 illustrates the survey scan and Cu 2p core level binding energy spectra of the Cu embedded carbon composites synthesized at various temperatures (400, 500, and 700 °C). The indexed four peaks in the survey spectrum at 284 eV, 399.7 eV, 530 eV, and 932 eV corresponding to C 1s, N 1s, O 1s and Cu 2p, respectively, indicates the presence of C, N, O, and Cu in the composite (Fig. 2). The core level binding energy spectrum of Cu 2p (Fig. 2b) offered a more detailed explanation. For Cu@C-700, the peaks at 932.09 eV (2p3/2) and 952.1 eV (2p1/2) for Cu(0), and those at 934.1 eV (2p1/2) and 954.39 eV (2p1/2) for Cu2+ [Fig. 2b line (i)] indicate the presence of a metallic copper and copper oxide (Cu(40.9%)/CuO (59.1%)). In addition, line (i) displays shake-up peaks (S1 and S2) that correspond to CuO, and are related to the d9 configuration in the ground state of Cu2+.42 On the other hand, Cu@C-400 [Fig. 2b line (iii)] and Cu@C-500 [Fig. 2b line (ii)] exhibit Cu 2p XPS peaks that are in a similar position to those of Cu@C-700, without the presence of shake-up peaks. This suggests the presence of non-oxidized copper. These results clearly prove that Cu@C-700 comprises a mixture of copper and copper oxide nanoparticles, whereas Cu@C-500 and Cu@C-400 are made up of pure copper nanoparticles.
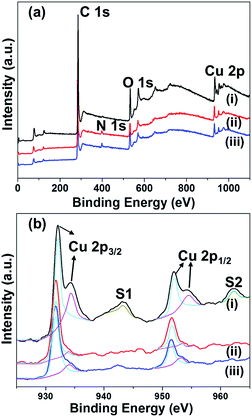 |
| | Fig. 2 (a) Wide scan XPS spectra, and (b) high resolution XPS spectra of Cu 2p for: (i) Cu@C-700, (ii) Cu@C-500, and (iii) Cu@C-400. | |
High resolution XPS spectra for carbon and oxygen were also investigated. The carbon XPS spectra indicate that Cu@C-700 exhibits a peak shift from 289.1 to 290.7 eV. This is attributed to the decomposition of the C![[double bond, length as m-dash]](https://www.rsc.org/images/entities/char_e001.gif) O groups, followed by the formation of intact aromatic carbons (π–π*; Fig. S1a†). Conversely, carbon XPS data of Cu@C-500 and Cu@C-400 have similar XPS peaks at 284.08 eV and 289.1 eV that are ascribed to the sp2 carbon of the CC and O–CO moieties, respectively (Fig. S1b and c†). These results confirm the completion of carbonization at 700 °C. The oxygen XPS spectra for Cu@C-400 and Cu@C-500 [Fig. S1f and e†] display peaks at 530.9 and 533.1 eV attributed to CO and O–CO groups, respectively. On the other hand, the carbonyl peaks disappeared for the Cu@C-700 composite, and a new low binding energy peak [Fig. S1d†] at 529.8 eV, correspond to Cu2+ ion, which indicates presence of CuO at 700 °C and the results are well coincide with the literature.43 Moreover, we observed high binding energy peaks in the region of 531.3–532.8 eV. Such peaks are usually attributed to chemisorbed and dissociated oxygen species (O2−, O22−, or O−).44 The XPS data clearly confirm the formation of CuO at 700 °C.
O groups, followed by the formation of intact aromatic carbons (π–π*; Fig. S1a†). Conversely, carbon XPS data of Cu@C-500 and Cu@C-400 have similar XPS peaks at 284.08 eV and 289.1 eV that are ascribed to the sp2 carbon of the CC and O–CO moieties, respectively (Fig. S1b and c†). These results confirm the completion of carbonization at 700 °C. The oxygen XPS spectra for Cu@C-400 and Cu@C-500 [Fig. S1f and e†] display peaks at 530.9 and 533.1 eV attributed to CO and O–CO groups, respectively. On the other hand, the carbonyl peaks disappeared for the Cu@C-700 composite, and a new low binding energy peak [Fig. S1d†] at 529.8 eV, correspond to Cu2+ ion, which indicates presence of CuO at 700 °C and the results are well coincide with the literature.43 Moreover, we observed high binding energy peaks in the region of 531.3–532.8 eV. Such peaks are usually attributed to chemisorbed and dissociated oxygen species (O2−, O22−, or O−).44 The XPS data clearly confirm the formation of CuO at 700 °C.
In addition to the above mentioned qualitative analysis, the quantitative content of carbon, hydrogen, and nitrogen in the composites was analyzed by elemental analysis (Table 1). Both Cu@C-400 and Cu@C-500 displayed similar carbon contents but the hydrogen and nitrogen content for Cu@C-500 was lower than those of Cu@C-400. This suggests that the degree of carbonization increases at higher temperatures. In addition, Cu@C-700 displayed negligible amounts of hydrogen and nitrogen, and a carbon content of 15%, suggesting a high degree of carbonization. Moreover, large amounts of carbon might be removed in CO2 form at high temperatures (700 °C) resulting in a low carbon content.
Table 1 Elemental analysis data of the composites
| |
N (%) |
C (%) |
H (%) |
| Cu@C-700 |
0.23 |
14.94 |
0.27 |
| Cu@C-500 |
0.93 |
26.70 |
0.90 |
| Cu@C-400 |
1.14 |
26.14 |
1.12 |
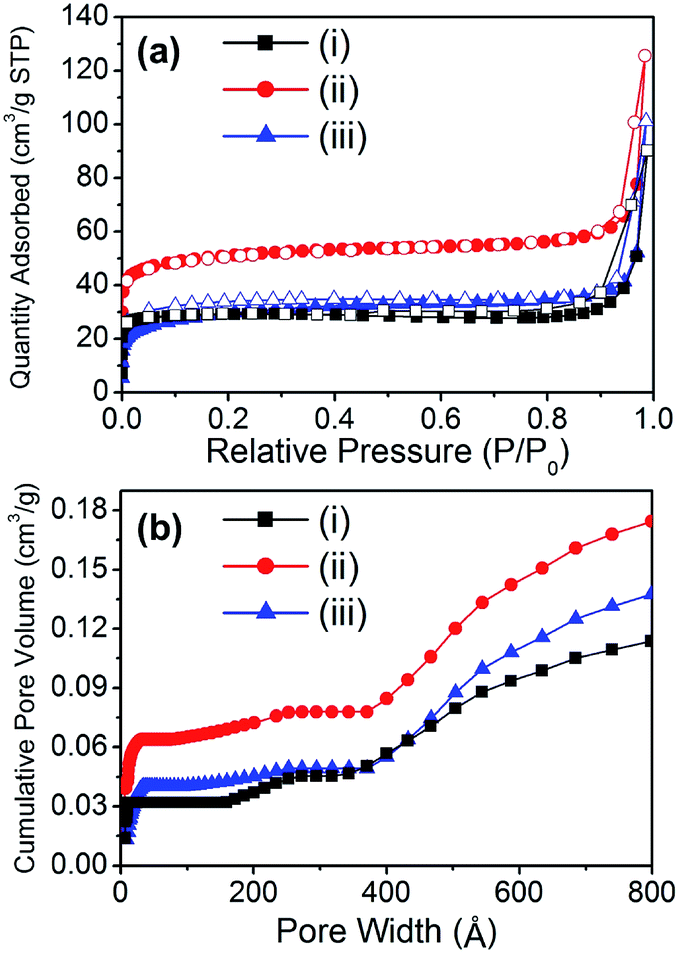
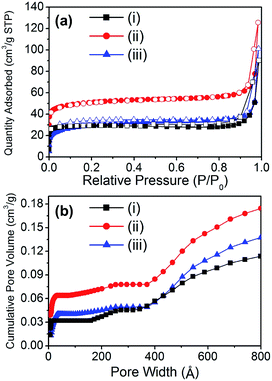
The porosity of the material is also an important factor for applications because of the accessibility of the reactant to the catalytic sites. Because porosity is only found in the carbon bed of the material, the surface area is expected to be proportional to the carbon content of the composite. The porosity of the materials was analyzed by N2 adsorption experiments at 77 K (Fig. 3a). Although the surface area of the composite materials drastically decreased when compared to the starting material (HKUST-1), the composite materials exhibited interesting hierarchical porosity. Thus, Cu@C-700 displayed a small surface area (114 m2 g−1), while a slightly smaller surface area was noted in Cu@C-400. This occurred because the temperature at which the latter material is formed (400 °C) may not be high enough for micropore evolution to occur. In addition, at very high temperatures (≥700 °C) the carbon bed starts to decompose, resulting in a decrease in surface area. On the other hand, the composite prepared at 500 °C had a surface area (195 m2 g−1) that was twice as large as that of the other composites. This may be due to two reasons: a temperature high enough for pore evolution to occur, and a large carbon content.
 |
| | Fig. 3 (a) N2 adsorption–desorption isotherms at 77 K (filled symbol: adsorption, open symbol: desorption), and (b) cumulative pore volume of (i) Cu@C-700, (ii) Cu@C-500, and (iii) Cu@C-400. | |
In composite materials, diffusivity is an important physical property that gives a better understanding of their catalytic activity. Thus, the cumulative pore volume of the composites was calculated by analyzing their N2 adsorption isotherms (Fig. 3b). Despite having a small mesopore (2 nm < pore size < 50 nm) volume portion, all the composites displayed hierarchical porosity comprising micro-, meso-, and macropores (Table 2). The composite Cu@C-500 had the largest surface area, and hence the largest total pore volume (0.174 cm3 g−1). The hierarchical porosity of the composite materials aids the diffusion of enzymes and reactants. This affords better accessibility of the catalytic sites. As a result, a better enzymatic catalytic activity of the composite materials is expected. In addition, porosity analysis of the composites suggested that Cu@C-500 exhibits the best catalytic activity due to its higher porosity.
Table 2 Surface area and pore volume of the composites
| |
BET S. A. (m2 g−1) |
Total pore volume (cm3 g−1) |
| Cu@C-700 |
114 |
0.129 |
| Cu@C-500 |
195 |
0.174 |
| Cu@C-400 |
106 |
0.145 |
The external morphology and inner distributions of the nanoparticles were analyzed by SEM and TEM. Since we had previously established that the optimal temperature for further applications was 500 °C, we opted to use Cu@C-500 (largest surface area and carbon content) for this analysis. The SEM images clearly illustrate that despite the irregular crystal size, the octahedral shape of HKUST-1 was retained even after carbonization (Fig. S4† and 4a).
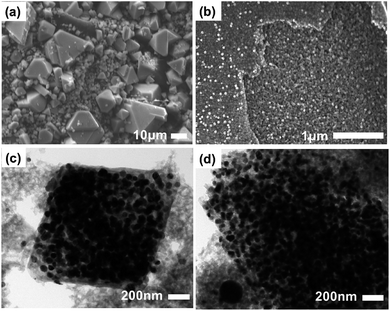 |
| | Fig. 4 (a and b) SEM and (c and d) TEM images of Cu@C-500. | |
The high resolution SEM image indicates that the composite comprises very small nanoparticles (Fig. 4b). Notably, macropores are also visible in this image. Furthermore, TEM images revealed the presence of copper nanoparticles that were 30 nm in size, and uniformly distributed in the composite material. It should be noted that the nanoparticle size calculated from the PXRD data is well matched with that calculated from the TEM images. In addition, the carbon bed surrounding the copper nanoparticles, is visible as a transparent grey surrounding (Fig. 4c and d). The images clearly demonstrate that the copper nanoparticles have a uniform nanoparticle size, and are well distributed in the composite. Therefore, based on these results, we concluded that the pyrolysis of HKUST-1 at 500 °C affords a well dispersed copper-nanoparticle-embedded porous carbon composite material with an average copper nanoparticle size of 30 nm, and hierarchical porosity derived from the carbon bed. The prepared composite can be utilized in various applications including the catalytic conversion of biomolecules.
3.3 TMB-based sensing test
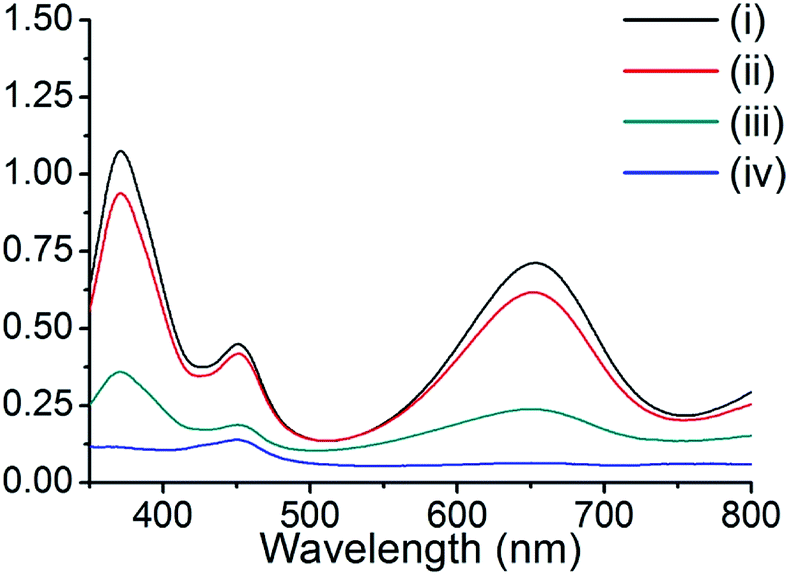
The peroxidase-like activity of these composite materials was tested by the oxidation of TMB in the presence of H2O2. TMB is colorless and displays no absorbance, even in the presence of H2O2. However, upon the addition of copper nanoparticle composite materials, the TMB solution exhibited a color change (colorless to deep blue), and two maximum absorption peaks at 370 and 652 nm. These properties were utilized to examine the peroxidase-like activity of our composite materials, and other representative materials. The composite Cu@C-500 was employed for the peroxidase-like activity assay, while pristine HKUST-1, activated carbon, and grinded copper foil were used as controls. The degree of reaction was monitored by UV-Vis absorption spectroscopy (Fig. 5). The resultant spectra indicated the absence of UV-Vis absorption for the activated carbon sample [Fig. 5, line (iv)], whereas, minor UV-Vis absorptions at 370 and 652 nm were observed for the copper foil sample. Therefore, we concluded that copper metal can act as a catalytic site for the peroxidase-like activity assay. We also predicted that Cu@C-500 would show significant catalytic activity. This was clearly confirmed by the increase in absorption at 370 and 652 nm. In addition, HKUST-1 also exhibited peroxidase-like catalytic activity in the TMB–H2O2 assay. Copper ions in HKUST-1 play an important role in the assay, and therefore, we predicted that HKUST-1 would lose its crystallinity and catalytic activity after the first assay. The PXRD experiment clearly indicated that the crystallinity of HKUST-1 totally disappeared after the first catalytic activity assay (Fig. S2†). Therefore, catalytic activity scarcely appeared after the first sensing assay.
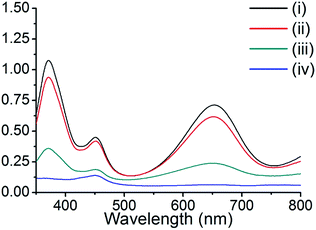 |
| | Fig. 5 UV-Vis absorption of TMB in the peroxidase-like activity study for (i) Cu@C-500, (ii) HKUST-1, (iii) copper foil, and (iv) activated carbon. | |
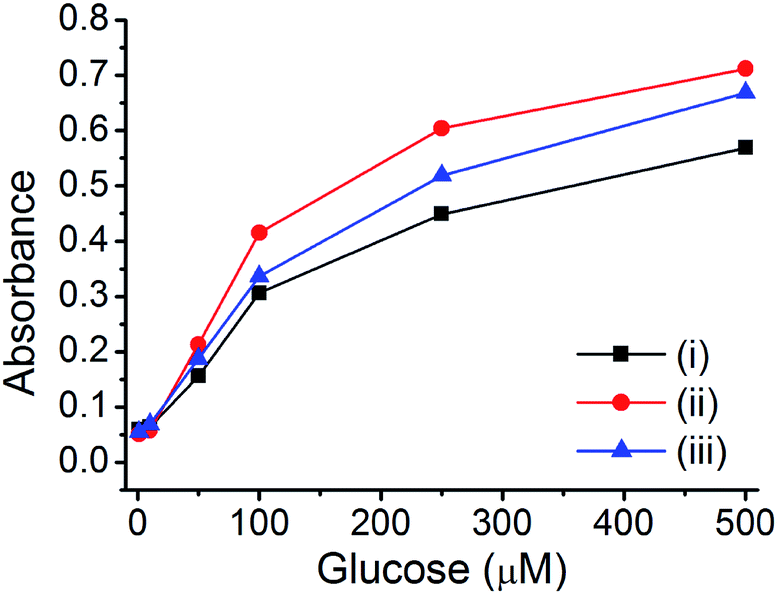
3.4 Glucose sensing assay using Cu@C composites
For the glucose sensing assay by assistance of enzyme (glucose oxidase), there are several requirements; (1) pure metal nanoparticle in porous carbon without any metal oxide (the presence of metal oxide reduce the catalytic activity) and (2) hierarchical porosity for the diffusion of large enzyme and small analytes (glucose). It is expected that the prepared Cu@C-500 is one of the ideal platform for an application as an enzymatic glucose sensor. The GOx enzyme is an oxidoreductase enzyme that catalyzes the transformation of glucose to D-glucose-1,5-lactone and H2O2 in the presence of O2. The H2O2 afforded from the GOx reaction can be used for the quantitative analysis of glucose by a TMB-based peroxidase-like activity assay. Therefore, the prepared materials can be applied to this assay. The GOx–TMB glucose sensing assay can be carried out via two processes: (1) H2O2 generation by the reaction of GOx and glucose and (2) quantitative H2O2 assay by a peroxidase-like activity test using copper nanoparticle composite materials. Three composites (Cu@C-700, Cu@C-500, and Cu@C-400) were used to determine the best material suitable for application to the quantitative glucose sensing assay. Glucose solutions with different glucose concentrations (500, 300, 100, 50, 10, and 1 μM) were used for the assay, and the results are summarized in Fig. 6. As expected, Cu@C-500 [Fig. 6, line (ii)] exhibits the highest absorbance, indicating the best catalytic activity for glucose sensing. A higher catalytic activity would be useful for better sensitivity and a higher detection limit of the sensing assay. Interestingly, Cu@C-700 displayed the weakest absorption signal [Fig. 6, line (i)], indicating the least catalytic activity. This was attributed to the mixed Cu and Cu2O nanoparticles that may decrease the catalytic activity of Cu@C-700 in the glucose sensing assay.
 |
| | Fig. 6 GOx-based glucose sensing assay using (i) Cu@C-700, (ii) Cu@C-500, and (iii) Cu@C-400. | |
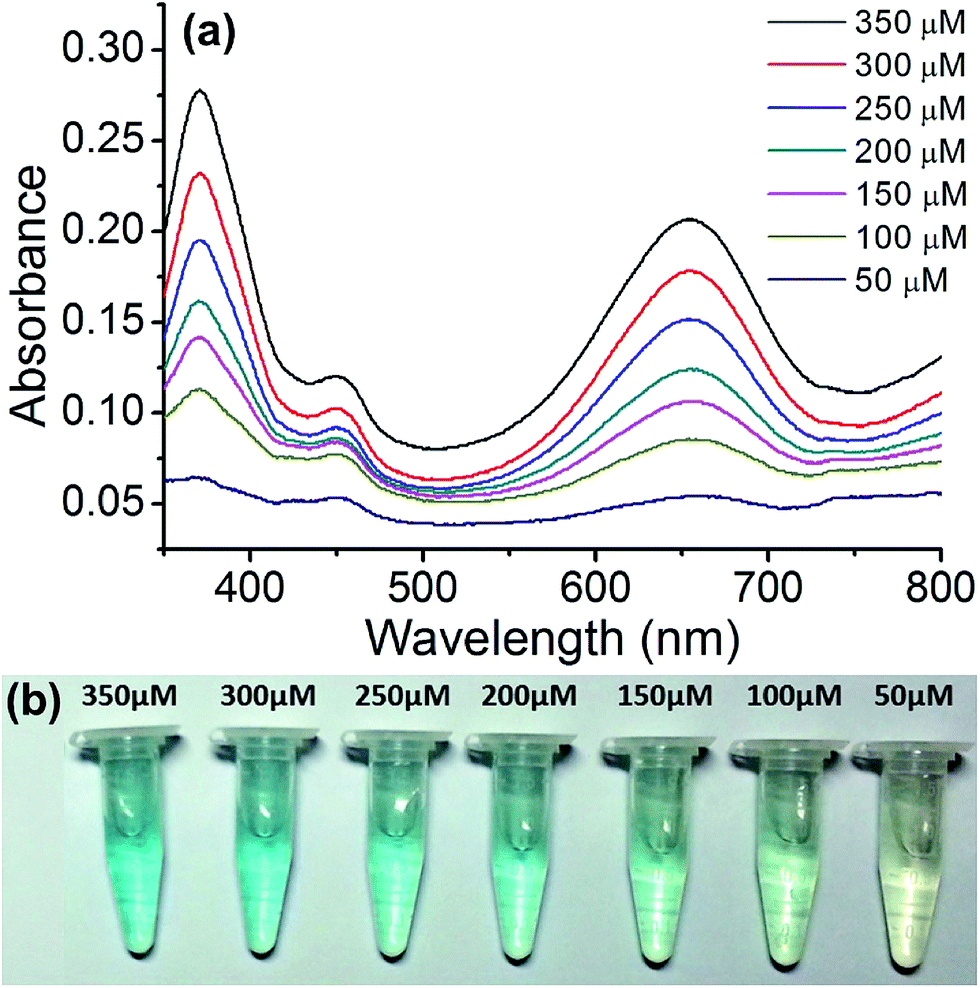
3.5 Quantitative glucose sensing assay using Cu@C-500
The copper nanoparticle composite can also be used for the quantitative assay of glucose. This is useful for biological applications. For this assay, we employed Cu@C-500 since it displayed the best catalytic activity. To plot the calibration curve, we measured the UV-Vis spectra of the glucose sensing assay solution at concentrations ranging between 50–350 μM, at 50 μM intervals (Fig. 7a). The UV-Vis absorbance of the assay solutions decreased with a decrease in glucose concentration. The colors of the assay solutions are illustrated in Fig. 7b. A decrease in color intensity (from light blue to transparent), attributed to a decrease in glucose concentration, was observed as the glucose concentration decreased from 350 μM to <50 μM.
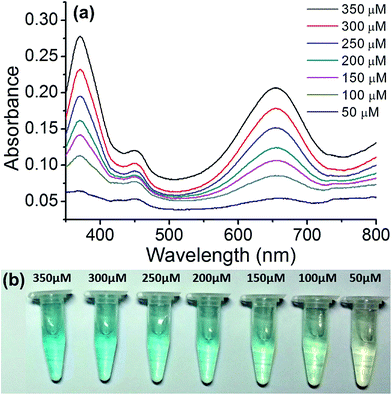 |
| | Fig. 7 Quantitative glucose sensing assay using Cu@C-500. (a) UV-Vis spectra of the assay solution, and (b) images of the sensing solutions in e-tubes. | |
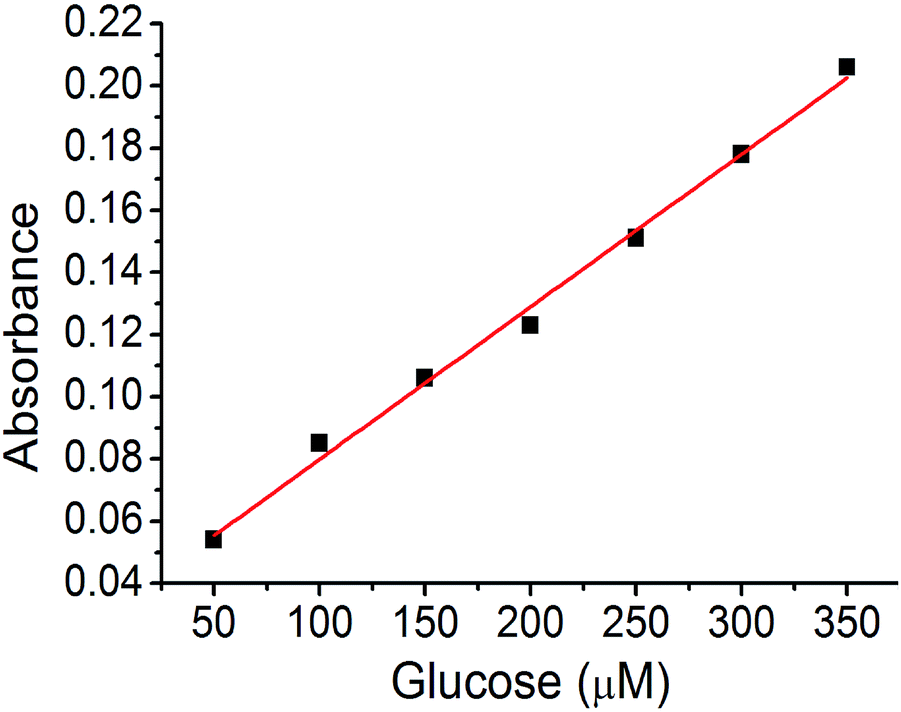
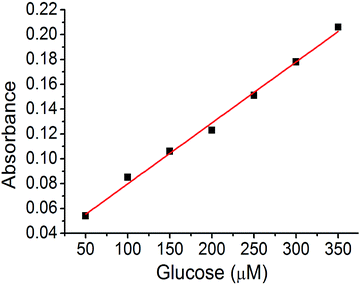
A calibration curve was plotted to confirm these results (Fig. 8). The absorption band at 652 nm was selected, and the absorbance of the assay solution was linearly fitted to the glucose concentration with an R2 value of 0.994. The detection limit calculated from the calibration curve was at a glucose concentration of 320 nM (3.2 × 10⁻⁹ M). This is one of the best values for colorimetric glucose sensing materials, reported in literature.45–47 We concluded that the hierarchical porosity and uniformly distributed Cu nanoparticles in the carbon bed afford the best glucose detection limit in the colorimetric glucose sensing assay.
 |
| | Fig. 8 Linear fit of the glucose sensing assay using Cu@C-500. | |
3.6 Glucose sensing selectivity and recyclability
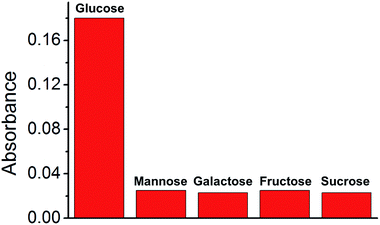
Analytes in real biological samples contain various sugars. Therefore, the selected composite material should demonstrate high selectivity towards other sugars without disturbing the catalytic reaction. Thus, four more sugars (mannose, galactose, fructose, and sucrose) were selected for the study of glucose selectivity (Fig. 9). Sugar solutions (300 μM) were prepared and used for the GOx–TMB assay. Color changes were observed in the glucose solution, with a high absorbance at 652 nm in the UV-Vis spectrum. Conversely, no visible color change was observed in the other sugar solutions, and there was negligible absorbance at 652 nm. This was attributed to the absence of H2O2 generation in the reaction of these sugars with GOx. Therefore, we concluded that these sugars will not disturb the sensing of glucose in a GOx–TMB-based sensing assay. This indicated that the material can be used in the glucose sensing assay of a real biological analyte.
 |
| | Fig. 9 Selectivity test of Cu@C-500 towards various sugars. | |
Due to the stable nature of the composite material, we assumed that the material in the glucose sensing assay could be recycled. To study the recyclability of Cu@C-500, the glucose sensing assay was carried out in large scale. The composite material was recovered after glucose sensing assay by centrifugation (12000 rpm), and reused for a number of cycles. For the recycling experiment, a 300 μM glucose solution was used in the GOx–TMB assay. The recycling efficiency was calculated by comparing the UV-Vis absorbance (652 nm) to that of the first cycle experiment. In the second GOx–TMB assay, the absorbance was decreased to 84%. The absorbance was further decreased as the number of assay cycles increased, so that the material exhibited almost negligible activity in the 5th cycle of the GOx–TMB assay (Table 3). To study the reason for this decrease in catalytic activity, we studied the structural nature of the Cu nanoparticles by PXRD analysis (Fig. S3†). After the composite was recycled, new PXRD peaks corresponding to Cu2O appeared. Therefore, we concluded that the decrease of Cu nanoparticles and the increase in Cu2O nanoparticles, caused by recycling, led to a decrease in the catalytic activity of Cu@C-500. In addition, the lowest catalytic activity of Cu@C-700 can also be explained by the presence of a mixture Cu and Cu2O nanoparticles.
Table 3 Recycling test of Cu@C-500
| Number of recycle |
1 |
2 |
3 |
4 |
5 |
| Efficiency (%) |
100 |
84 |
55 |
25 |
1 |
4. Conclusions
In this work, we present systematic study for the preparation of a pure copper nanoparticle embedded porous carbon material. Simple pyrolysis of HKUST-1 at 500 °C, under N2 flow allowed the formation of Cu@C-500. Copper nanoparticles with an average size of 30 nm were well distributed in the carbon bed of the composite material. This material exhibited hierarchical porosity comprising micro-, meso-, and macropores. The presence of pure metal nanoparticle and hierarchical porosity of the material allows an application for glucose sensing by GOx–TMB assay. Due to the presence of pure copper nanoparticles and hierarchical porosity, Cu@C-500 displays one of the best sensitivities in colorimetric glucose sensing (detection limit: 3.2 × 10⁻⁹ M). In addition, Cu@C-500 exhibits high selectivity in glucose compared to other sugars, including mannose, galactose, fructose, and sucrose. Finally, the recycling experiment suggests that the material can be recycled for up to three times with more than 50% efficiency. However, the catalytic activity continuously decreases after each cycle because of the formation of Cu2O in the composite material. The high sensitivity and selectivity of Cu@C-500 can help to improve cost-efficient glucose sensing devices. Notably, simple microfluidic glucose sensing kits can be prepared by utilizing the presented material. Furthermore, we are now investigating generality of this synthetic procedure. Based on this study, new metal nanoparticle embedded porous carbon composite can be widely used.
Acknowledgements
This research was supported by the Gachon University research fund of 2014 (GCU-2014-0119). This work was also supported by the Radiation Technology R&D program through the NRF of Korea funded by the Ministry of Science, ICT, and Future Planning (Grant NRF-2015M2A2A6021187). X-ray diffraction experiments at PLS-II, 2D-SMC beamline were supported in part by MEST and POSTECH. We thank Mr E. Kim for his help on SEM analysis.
References
- S. L. James, Chem. Soc. Rev., 2003, 32, 276–288 RSC.
- J. R. Long and O. M. Yaghi, Chem. Soc. Rev., 2009, 38, 1213–1214 RSC.
- H.-C. Zhou, J. R. Long and O. M. Yaghi, Chem. Rev., 2012, 112, 673–674 CrossRef CAS PubMed.
- H.-C. Zhou and S. Kitagawa, Chem. Soc. Rev., 2014, 43, 5415–5418 RSC.
- M. Eddaoudi, J. Kim, N. Rosi, D. Vodak, J. Wachter, M. O'Keeffe and O. M. Yaghi, Science, 2002, 295, 469–472 CrossRef CAS PubMed.
- A. R. Millward and O. M. Yaghi, J. Am. Chem. Soc., 2005, 127, 17998–17999 CrossRef CAS PubMed.
- K. Sumida, D. L. Rogow, J. A. Mason, T. M. McDonald, E. D. Bloch, Z. R. Herm, T.-H. Bae and J. R. Long, Chem. Rev., 2012, 112, 724–781 CrossRef CAS PubMed.
- J. L. C. Rowsell and O. M. Yaghi, Angew. Chem., Int. Ed., 2006, 44, 4670–4679 CrossRef PubMed.
- J. A. Mason, M. Veenstra and J. R. Long, Chem. Sci., 2014, 5, 32–51 RSC.
- J. A. Mason, J. Oktawiec, M. K. Taylor, M. R. Hudson, J. Rodriguez, J. E. Bachman, M. I. Gonzalez, A. Cervellino, A. Guagliardi, C. M. Brown, P. L. Llewellyn, N. Masciocchi and J. R. Long, Nature, 2015, 357–361 CrossRef CAS PubMed.
- J.-R. Li, R. J. Kuppler and H.-C. Zhou, Chem. Soc. Rev., 2009, 38, 1477–1504 RSC.
- J. Jiang, H. Furukawa, Y.-B. Zhang and O. M. Yaghi, J. Am. Chem. Soc., 2016, 138, 10244–10251 CrossRef CAS PubMed.
- Z. R. Herm, E. D. Bloch and J. R. Long, Chem. Mater., 2014, 26, 338 CrossRef.
- J. Lee, O. K. Farha, J. Roberts, K. A. Scheidt, S. T. Nguyen and J. T. Hupp, Chem. Soc. Rev., 2009, 38, 1450–1459 RSC.
- M. Yoon, R. Srirambalaji and K. Kim, Chem. Rev., 2012, 112, 1196–1231 CrossRef CAS PubMed.
- T. Zhang and W. Lin, Chem. Soc. Rev., 2014, 43, 5982–5993 RSC.
- J. Liu, L. Chen, H. Cui, J. Zhang, L. Zhang and C.-Y. Su, Chem. Soc. Rev., 2014, 43, 6011–6061 RSC.
- Y. Liu, Y. Zhang, J. Chen and H. Pang, Nanoscale, 2014, 6, 10989–10994 RSC.
- J. An, S. J. Geib and N. L. Rosi, J. Am. Chem. Soc., 2009, 131, 8376–8377 CrossRef CAS PubMed.
- M. Yoon, K. Suh, S. Natarajan and K. Kim, Angew. Chem., Int. Ed., 2013, 52, 2688–2700 CrossRef CAS PubMed.
- S. Horike, D. Umeyama and S. Kitagawa, Acc. Chem. Res., 2013, 46, 2376–2384 CrossRef CAS PubMed.
- P. Ramaswamy, N. E. Wong and G. K. H. Shimizu, Chem. Soc. Rev., 2014, 43, 5913–5932 RSC.
- L. E. Kreno, K. Leong, O. K. Farha, M. Allendorf, R. P. V. Duyne and J. T. Hupp, Chem. Rev., 2012, 112, 1105–1125 CrossRef CAS PubMed.
- Y. Cui, Y. Yue, G. Qian and B. Chen, Chem. Rev., 2012, 112, 1126–1162 CrossRef CAS PubMed.
- W. Zhang, Y. Hu, J. Ge, H.-L. Jiang and S. H. Yu, J. Am. Chem. Soc., 2014, 136, 16978–16981 CrossRef CAS PubMed.
- Y. J. Bae, E. S. Cho, F. Qiu, D. T. Sun, T. E. Williams, J. J. Urban and W. L. Queen, ACS Appl. Mater. Interfaces, 2016, 8, 10098–10103 CAS.
- B. Liu, H. Shioyama, T. Akita and Q. Xu, J. Am. Chem. Soc., 2008, 130, 5390–5391 CrossRef CAS PubMed.
- S. J. Yang, T. Kim, J. H. Im, Y. S. Kim, K. Lee, H. Jung and C. R. Park, Chem. Mater., 2012, 24, 464–470 CrossRef CAS.
- S. Lim, K. Suh, Y. Kim, M. Yoon, H. Park, D. N. Dybtsev and K. Kim, Chem. Commun., 2012, 48, 7447–7449 RSC.
- S. J. Yang, S. Nam, T. Kim, J. H. Im, H. Jung, J. H. Kang, S. Wi, B. Park and C. R. Park, J. Am. Chem. Soc., 2013, 135, 7394–7397 CrossRef CAS PubMed.
- K. J. Lee, S. Choi, S. Park and H. R. Moon, Chem. Mater., 2014, 28, 4403–4408 CrossRef.
- E. Kim and M. Yoon, J. Porous Mater., 2015, 22, 1492–1502 Search PubMed.
- J. Tang, R. R. Salunkhe, J. Liu, N. L. Torad, M. Imura, S. Furukawa and Y. Yamaguchi, J. Am. Chem. Soc., 2015, 137, 1572–1580 CrossRef CAS PubMed.
- Y. Zhang, A. Pan, Y. Wang, W. Wei, Y. Su, J. Hu, G. Cao and S. Liang, ACS Appl. Mater. Interfaces, 2016, 8, 17303–17311 CAS.
- I. A. Khan, A. Badshah, M. A. Nadeem, N. Haider and M. A. Nadeem, Int. J. Hydrogen Energy, 2014, 39, 19609–19620 CrossRef CAS.
- H. Tan, C. Ma, L. Gao, Q. Li, Y. Song, F. Xu, T. Wang and L. Wang, Chem.–Eur. J., 2014, 20, 16377–16383 CrossRef CAS PubMed.
- C. Wei, X. Li, F. Xu, H. Tan, Z. Li, L. Sun and Y. Song, Anal. Methods, 2014, 6, 1550–1557 RSC.
- S. S.-Y. Chui, S. M.-F. Lo, J. P. H. Charmant, A. G. Orpen and I. D. Williams, Science, 1999, 283, 1148–1150 CrossRef CAS PubMed.
- N. Wang, B. Li, F. Qiao, J. Sun, H. Fan and S. Ai, J. Mater. Chem. B, 2015, 3, 7718–7723 RSC.
- Q. Li, G. Tang, X. Xiong, Y. Cao, L. Chen, F. Xu and H. Tan, Sens. Actuators, B, 2015, 215, 86–92 CrossRef CAS.
- D. Feng, Z. Y. Gu, J. R. Li, H. L. Jiang, Z. Wei and H.-C. Zhou, Angew. Chem., Int. Ed., 2012, 51, 10307–10310 CrossRef CAS PubMed.
- C. K. Wu, M. Yin, S. O'Brien and J. T. Koberstein, Chem. Mater., 2006, 18, 6054–6058 CrossRef CAS.
- M. C. Biesinger, L. W. M. Lau, A. R. Gerson and R. St. C. Smart, Appl. Surf. Sci., 2010, 257, 887–898 CrossRef CAS.
- Y. Wang, Y. Lu, W. Zhan, Z. Xie, Q. Kuang and L. Zheng, J. Mater. Chem. A, 2015, 3, 12796–12803 CAS.
- X.-D. Wang, H.-X. Chen, T.-Y. Zhou, Z.-H. Lin, J.-B. Zeng, Z.-X. Xie, X. Chen, K.-Y. Wong, G.-N. Chen and X.-R. Wang, Biosens. Bioelectron., 2009, 24, 3702–3705 CrossRef CAS PubMed.
- Y. Xia, J. Ye, K. Tan, J. Wang and G. Yang, Anal. Chem., 2013, 85, 6241–6247 CrossRef CAS PubMed.
- Q. Liu, H. Li, Q. Zhao, R. Zhu, Y. Yang, Q. Jia, B. Bian and L. Zhu, Mater. Sci. Eng., C, 2014, 41, 142–151 CrossRef CAS PubMed.
Footnote |
| † Electronic supplementary information (ESI) available: XPS data and PXRD data. See DOI: 10.1039/c7ra00115k |
|
| This journal is © The Royal Society of Chemistry 2017 |
Click here to see how this site uses Cookies. View our privacy policy here. 
 Open Access Article
 This Open Access Article is licensed under a Creative Commons Attribution-Non Commercial 3.0 Unported Licence
 a,
Damsol Cho
a,
Damsol Cho