 Open Access Article
Creative Commons Attribution 3.0 Unported Licence
System-wide analysis of manganese starvation-induced metabolism in key elements of Lactobacillus plantarum
Yanjun Tonga,
Qixiao Zhaiad,
Gang Wangad,
Qiuxiang Zhanga,
Xiaoming Liuad,
Fengwei Tianad,
Jianxin Zhaoacd,
Hao Zhangacd and
Wei Chen *abcd
*abcd
aState Key Laboratory of Food Science and Technology, School of Food Science and Technology, Jiangnan University, Wuxi 214122, People's Republic of China. E-mail: tongyanjun@jiangnan.edu.cn; chenwei66@jiangnan.edu.cn
bBeijing Innovation Centre of Food Nutrition and Human Health, Beijing Technology & Business University, Beijing 100048, People's Republic of China
cInternational Joint Research Center for Probiotics & Gut Health, Jiangnan University, Wuxi 214122, P.R. China
dInternational Joint Research Laboratory for Probiotics at Jiangnan University, People's Republic of China
First published on 24th February 2017
Abstract
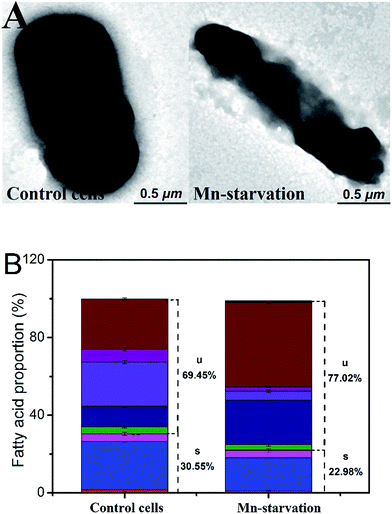
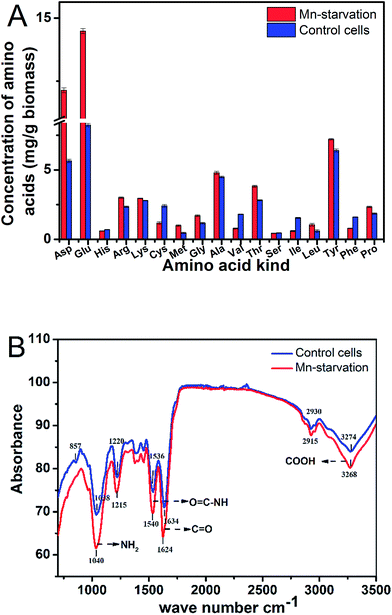
To analyze the response mechanisms of Lactobacillus plantarum against manganese starvation stress, different metabolisms from physiology, proteomics and transporters aspects in L. plantarum CCFM 436 were systematically investigated. The kinetics of cell growth (μmax) decreased from 0.310 to 0.256 h−1, while thinner cell morphology was observed by transmission electron microscopy under Mn-starvation conditions. Gas chromatography-mass spectrometry analysis indicated that membrane mobility and compactness increased, with a higher proportion of unsaturated fatty acids and cyclopropane fatty acids. High-performance liquid chromatography analysis showed that intracellular Asp, Glu, and Arg contents, closely related to energy metabolism, were significantly increased. Fourier transform infrared spectroscopy proved that some functional groups (N–H and O![[double bond, length as m-dash]](https://www.rsc.org/images/entities/char_e001.gif) C–OH) were significantly affected by Mn starvation. Comparative two-dimensional proteomic analysis identified 73 proteins that differed significantly under Mn starvation conditions. These differentially expressed proteins involved in carbohydrate, amino acid and transcription/translation metabolisms and stress response were categorized as crucial components required to resist manganese starvation stress. Moreover, qRT-PCR analysis proved that MntH 1–5, negatively regulated by MntR, acted as potential Mn importers under Mn starvation conditions. The proposed coordinated mechanism model provides a reference for, and insight into, the intracellular metabolism of LAB strains.
C–OH) were significantly affected by Mn starvation. Comparative two-dimensional proteomic analysis identified 73 proteins that differed significantly under Mn starvation conditions. These differentially expressed proteins involved in carbohydrate, amino acid and transcription/translation metabolisms and stress response were categorized as crucial components required to resist manganese starvation stress. Moreover, qRT-PCR analysis proved that MntH 1–5, negatively regulated by MntR, acted as potential Mn importers under Mn starvation conditions. The proposed coordinated mechanism model provides a reference for, and insight into, the intracellular metabolism of LAB strains.
1. Introduction
Manganese is an essential element of life and acts as “cell security” or a “life bodyguard”.1–3 Manganese is a component in a variety of enzymes with important physiological functions, such as manganese-superoxide dismutase, arginase and pyruvate carboxylase.4,5 Manganese also acts as a cofactor in some metalloenzymes, such as aminopeptidase, dipeptidase, manganese catalase, D-xylose isomerase, L-arabinose isomerase and ribozymes.3,4 Manganese must be maintained at an appropriate level in organisms; otherwise, stress can result from manganese starvation or excess.1 It is important to maintain a steady-state balance in the regulation of manganese to ensure normal physiological function.Lactobacillus plantarum (L. plantarum) is a probiotic that can effectively reduce heavy metal ion toxicity.6–10 In particular, L. plantarum requires a relatively high level of manganese ions for optimal growth due to the absence of superoxide dismutase.11,12 Manganese is an essential element in the growth of lactic acid bacteria, not only involved in the composition of some enzymes, such as lactate dehydrogenase, but also promoting the production of certain enzymes to assist cellular metabolism.11 Manganese ions are indispensable to the stability and function of the metal protein, affecting the biological function of these proteins. These metalloproteins and metalloenzymes are involved in the regulation of homeostasis, electron transport, biomolecule synthesis, biological substance transport, oxidative stress, signal transduction, gene regulation and other functions.11,13,14 Therefore, the steady-state regulation of manganese is important in maintaining the normal physiological function of intracellular manganese ions. However, decreasing heavy metal ion toxicity has been the focus of most research in this area.15–18 Although manganese ion studies have focused on individual features, resistance to manganese starvation stress has not been studied systematically. Understanding the molecular mechanisms of the response to manganese starvation will be helpful in elucidating the physiological mechanisms of this kind of probiotic against manganese starvation stress from a different angle.
Our previous has shown the strong potential of L. plantarum CCFM436 to reduce manganese toxicity.19 Herein, L. plantarum CCFM436 was used to study metabolic response mechanisms under manganese starvation stress by investigating cell physiology, proteomics and levels of key transport proteins.
2. Materials and methods
2.1 Microbial growth conditions
L. plantarum CCFM436, which was screened from wine cake samples of Shanlan wine from Hainan, China, was cultured in modified MRS broth at 37 °C for 18 h (Table 1). The manganese ion concentration in the MRS broth was 16 mg L−1, while MRS broth without added MnSO4·H2O was used to induce manganese starvation stress. The biomass at different culture phases was determined as the optical density at 600 nm (OD600).| Species | Strain | Microbial type | Optimal T/pH | Description and source |
|---|---|---|---|---|
| Lactobacillus plantarum | CCFM436 | Lactic acid bacteria; chemoheterotroph | T 37 °C; pH 6.2–6.4 | Wine cake sample of shanlan wine from Hainan, China |
2.2 Analysis of cell physiology under manganese starvation conditions
2.3 Analysis of intracellular amino acid composition and functional groups under manganese starvation conditions
![[thin space (1/6-em)]](https://www.rsc.org/images/entities/char_2009.gif) 000 × g for 10 min, after which the supernatants were used to analyze the intracellular amino acid by HPLC.
000 × g for 10 min, after which the supernatants were used to analyze the intracellular amino acid by HPLC.2.4 Two-dimensional (2D) gel electrophoresis
![[thin space (1/6-em)]](https://www.rsc.org/images/entities/char_2009.gif) 000 × g for 30 min at 4 °C so that the supernatants contained the whole protein from the samples. The Bradford assay was used to determine protein concentrations.
000 × g for 30 min at 4 °C so that the supernatants contained the whole protein from the samples. The Bradford assay was used to determine protein concentrations.The stained gels (three independent analytical replicates for each manganese concentration) were scanned at 300 dpi with an image scanner and analyzed with PDQuest software. Briefly, spot detection was carried out using optimized setting values for spot intensity, spot area and saliency, as determined by applying real-time filters to minimize artifact detection. After spot detection, manual spot editing was carried out to remove artifacts that escaped the filtering process. Spots that showed significant intensity differences (>1.5-fold or <0.67-fold change) between samples with a P value of <0.05 in different manganese concentrations were considered differentially expressed proteins.
![[thin space (1/6-em)]](https://www.rsc.org/images/entities/char_2009.gif) :
:![[thin space (1/6-em)]](https://www.rsc.org/images/entities/char_2009.gif) 0.1 v/v). All respective peptides were spotted on the sample target plate and analyzed by MALDI-TOF/TOF mass spectrometry. Peptides digested with trypsin were analyzed in positive ion mode, and the spectra were adjusted by peptide calibration. The spectra were analyzed using FlexAnalysis and BioTools software. The peptide results were compared and analyzed with the following parameters: NCBI-nr bacteria database, trypsin as the digestion enzyme, acceptance of cysteine carbamidomethylation, methionine oxidation, fragment mass tolerance of 0.99 Da and peptide mass tolerance of 300 ppm.
0.1 v/v). All respective peptides were spotted on the sample target plate and analyzed by MALDI-TOF/TOF mass spectrometry. Peptides digested with trypsin were analyzed in positive ion mode, and the spectra were adjusted by peptide calibration. The spectra were analyzed using FlexAnalysis and BioTools software. The peptide results were compared and analyzed with the following parameters: NCBI-nr bacteria database, trypsin as the digestion enzyme, acceptance of cysteine carbamidomethylation, methionine oxidation, fragment mass tolerance of 0.99 Da and peptide mass tolerance of 300 ppm.2.5 Quantitative RT-PCR
Quantitative RT-PCR analysis was used to quantify protein transcription. Total RNA was extracted from different samples with Trizol reagent according to manufacturer instructions. The RNA concentration was determined, and reverse transcription reactions were carried out with a PrimeScript RT Reagent Kit with gDNA Eraser. Then, 10 μL of a genome DNA removal mixture, containing 1 μg extracted total RNA, 2 μL 5 × DNA eraser buffer, 1 μL gDNA eraser and RNase-free dH2O, was added. The reaction was carried out at 42 °C for 2 min, and the RT-PCR reaction was processed using a 20 μL mixture (1 μL PrimeScript RT enzyme mix, 1 μL RT primer mix, 4 μL 5 × PrimeScript buffer, 4 μL RNase free dH2O, and 10 μL of the reaction mixture for genome DNA removal). qRT-PCR was performed using SYBR Premix Ex Taq II. The 20 μL PCR reaction mixture contained 10 μL SYBR Premix Ex Taq II, 1 μL PCR forward primer (10 μM), 1 μL PCR reverse primer (10 mM), 1 μL sample cDNA and 7 μL dH2O. PCR specificity was verified by melt-curve analysis of the samples. The cycle threshold (Ct) value was measured, and the relative quantification of specific gene expressions was determined using the 2−ΔΔCt method. Primers are listed in Table 2. 16S rRNA of L. plantarum CCFM436 was used as an internal control for PCR amplification.| Primer | Sequence (5′-3′) | Production (bp) |
|---|---|---|
| MntH-1-F | TCACCGTGGCATACAGTGACACAC | 187 |
| MntH-1-R | TGAAATTGTTTTAGCGCACGACCT | |
| MntH-2-F | TACGTGGCATGTCGATGATGG | 203 |
| MntH-2-R | CACGACCGTCGTCGTCATCATATC | |
| MntH-3-F | TACATGGATCCCGGTAACTGGTCAAC | 145 |
| MntH-3-R | GATCCATCTGACTCACGATACCAAG | |
| MntH-4-F | GATAGTAAGAGCTTGGACGAAGTC | 225 |
| MntH-4-R | CCATGGCTTGTAGCAACATGGCAAT | |
| MntH-5-F | GCAGTCGGCTATATGGATCCCGGCAAC | 246 |
| MntH-5-R | CATATCAGTCGCCATCATCGCGAC | |
| MntR-F | TATTTTCGAGCTTGGTGGTACGAA | 218 |
| MntR-R | CTAAGAAATCTTCCCAGATTCGGTG | |
| 16S rRNA-F | AGCAGCCGCGGTAATACGTAGGTG | 227 |
| 16S rRNA-R | GACCAGACAGCCGCCTTCGCCACAC |
3. Results and discussion
3.1 Effects of manganese starvation on growth performance
Manganese is an essential element for cell growth and is involved in a variety of metabolic pathways. The growth of L. plantarum CCFM436 was inhibited by manganese starvation stress, as indicated by the lower OD values. Cell performance is shown in Fig. 1A. The final OD600 was 5.27 in MRS culture and 2.37 under manganese starvation stress. Similarly, μmax changes occurred with cell growth (see Fig. 1B). The μmax of the cells decreased from 0.310 to 0.256 h−1 under manganese starvation conditions. Moreover, the μmax peak time was significantly delayed, and the appearance time for μmax extended from 5.0 to 8.5 h. Growth was clearly limited, as observed in a previous report, in which the growth of L. plantarum NC8 was directly correlated with the amount of manganese ions in the medium.11 The highest OD600 was reached at microtiter scale at the highest manganese ion concentration tested. As manganese can participate as an enzyme cofactor in various biological processes, manganese starvation was harmful to the growth of L. plantarum CCFM436. However, slight cell growth was observed in complex media (e.g., MRS) without manganese addition. This may be caused by the yeast extract, beef extract or trypsin powder used containing trace amounts of manganese that could be used for cell growth.11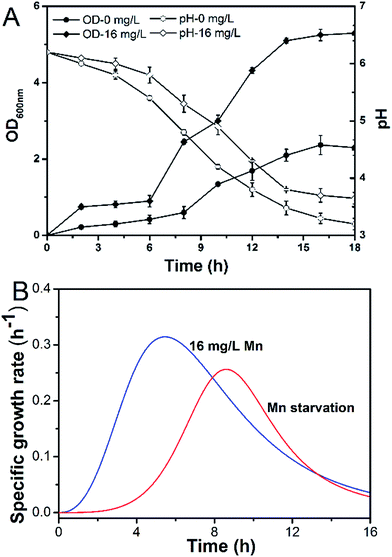 | ||
| Fig. 1 Effect of Mn starvation on growth kinetics of L. plantarum CCFM 436: (A) pH/biomass (OD600) and (B) μ. | ||
3.2 Effects of manganese starvation stress on cell physiology
Meanwhile, the cyclopropane fatty acid content was much higher under manganese starvation stress conditions (increased from 25.82% to 43.54%), whereas that of octadecenoic acid was significantly lower. High cyclopropane fatty acid contents have been reported as beneficial to maintaining better membrane compactness and resistance to harmful environmental factors.20,21
3.3 Intracellular amino acid composition and key functional groups under manganese starvation stress
![[double bond, length as m-dash]](https://www.rsc.org/images/entities/char_e001.gif) O) and 3274 cm−1 (O
O) and 3274 cm−1 (O![[double bond, length as m-dash]](https://www.rsc.org/images/entities/char_e001.gif) C–OH) was due to the change in stretching vibration of the carboxyl group without manganese ion complexation or the ion exchange effect.25,26 Similarly, movement of the peaks at 1038 and 1536 cm−1 indicated N–H fluctuation and the generation of some different compounds when the functional amino group of the protein did not uptake manganese ions.26,27 These results were also consistent with the main chemical bond activations in the Mn bioadsorption process (such as C
C–OH) was due to the change in stretching vibration of the carboxyl group without manganese ion complexation or the ion exchange effect.25,26 Similarly, movement of the peaks at 1038 and 1536 cm−1 indicated N–H fluctuation and the generation of some different compounds when the functional amino group of the protein did not uptake manganese ions.26,27 These results were also consistent with the main chemical bond activations in the Mn bioadsorption process (such as C![[double bond, length as m-dash]](https://www.rsc.org/images/entities/char_e001.gif) O stretching, N–H bending, and O–H stretching).27
O stretching, N–H bending, and O–H stretching).273.4 Proteomic analysis and functional classification of identified proteins
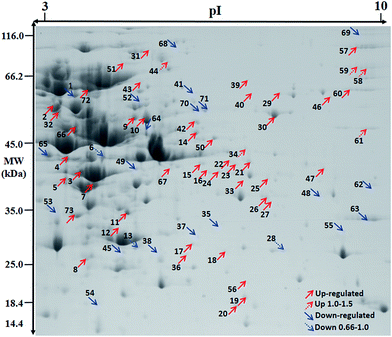 | ||
| Fig. 4 Effect of Mn starvation on overall protein expression of L. plantarum CCFM 436 via proteome analysis. | ||
| Spot | Accession | Protein name | Theoretical MW (Da) | MASCOT score | No. matched | Fold change 0/16 |
|---|---|---|---|---|---|---|
| Carbon metabolism | ||||||
| 2 | gi|489735124 | F0F1 ATP synthase subunit beta | 50![[thin space (1/6-em)]](https://www.rsc.org/images/entities/char_2009.gif) 786 786 |
395 | 7(1) | 1.63 |
| 3 | gi|334880343 | D-Lactate dehydrogenase (D-LDH) | 37![[thin space (1/6-em)]](https://www.rsc.org/images/entities/char_2009.gif) 176 176 |
321 | 8(2) | 3.86 |
| 6 | gi|5823364 | PepQ | 41![[thin space (1/6-em)]](https://www.rsc.org/images/entities/char_2009.gif) 316 316 |
387 | 5(3) | 0.84 |
| 7 | gi|3043367 | L-Lactate dehydrogenase | 34![[thin space (1/6-em)]](https://www.rsc.org/images/entities/char_2009.gif) 256 256 |
90 | 2(0) | 2.48 |
| 8 | gi|334881845 | Ribose-5-phosphate isomerase A | 24![[thin space (1/6-em)]](https://www.rsc.org/images/entities/char_2009.gif) 617 617 |
217 | 4(1) | 2.66 |
| 9 | gi|334880734 | NADH peroxidase | 48![[thin space (1/6-em)]](https://www.rsc.org/images/entities/char_2009.gif) 443 443 |
560 | 9(6) | 2.44 |
| 10 | gi|489733775 | Glyceraldehyde-3-phosphate dehydrogenase | 36![[thin space (1/6-em)]](https://www.rsc.org/images/entities/char_2009.gif) 645 645 |
148 | 2(1) | 1.83 |
| 12 | gi|489733459 | Fructose-bisphosphate aldolase | 31![[thin space (1/6-em)]](https://www.rsc.org/images/entities/char_2009.gif) 060 060 |
851 | 9(7) | 1.76 |
| 16 | gi|334881745 | Phosphoglycerate dehydrogenase | 34![[thin space (1/6-em)]](https://www.rsc.org/images/entities/char_2009.gif) 635 635 |
82 | 1(1) | 4.27 |
| 30 | gi|334881069 | Acetaldehyde dehydrogenase | 49![[thin space (1/6-em)]](https://www.rsc.org/images/entities/char_2009.gif) 062 062 |
280 | 5(2) | 3.20 |
| 34 | gi|13940254 | Acetate kinase | 43![[thin space (1/6-em)]](https://www.rsc.org/images/entities/char_2009.gif) 870 870 |
364 | 6(4) | 1.20 |
| 45 | gi|489735713 | Phosphoglyceromutase | 26![[thin space (1/6-em)]](https://www.rsc.org/images/entities/char_2009.gif) 069 069 |
504 | 7(3) | 0.34 |
| 47 | gi|334882090 | ATP synthase gamma chain | 34![[thin space (1/6-em)]](https://www.rsc.org/images/entities/char_2009.gif) 586 586 |
225 | 3(2) | 5.33 |
| 53 | gi|300494598 | Triose-phosphate isomerase | 25![[thin space (1/6-em)]](https://www.rsc.org/images/entities/char_2009.gif) 858 858 |
268 | 3(2) | 0.13 |
| 59 | gi|489734188 | Phosphoenolpyruvate-protein phosphotransferase | 63![[thin space (1/6-em)]](https://www.rsc.org/images/entities/char_2009.gif) 271 271 |
67 | 1(1) | 1.28 |
| 65 | gi|334880497 | Putative manganese-dependent inorganic pyrophosphatase | 33![[thin space (1/6-em)]](https://www.rsc.org/images/entities/char_2009.gif) 645 645 |
563 | 7(3) | 0.36 |
| 66 | gi|489735164 | Glucose-6-phosphate isomerase | 49![[thin space (1/6-em)]](https://www.rsc.org/images/entities/char_2009.gif) 776 776 |
156 | 2(1) | 2.47 |
| 67 | gi|334880778 | Ferredoxin-NADP reductase (FNR) (Fd-NADP + reductase) | 36![[thin space (1/6-em)]](https://www.rsc.org/images/entities/char_2009.gif) 231 231 |
251 | 5(1) | 2.05 |
| 68 | gi|254046929 | Putative phosphoketolase | 90![[thin space (1/6-em)]](https://www.rsc.org/images/entities/char_2009.gif) 611 611 |
96 | 2(1) | 0.30 |
![[thin space (1/6-em)]](https://www.rsc.org/images/entities/char_2009.gif) |
||||||
| Nitrogen and amino acid metabolism | ||||||
| 28 | gi|334881598 | Putative protein-tyrosine phosphatase | 29![[thin space (1/6-em)]](https://www.rsc.org/images/entities/char_2009.gif) 819 819 |
522 | 7(4) | 0.97 |
| 70 | gi|334881735 | Cysteine desulfurase | 44![[thin space (1/6-em)]](https://www.rsc.org/images/entities/char_2009.gif) 929 929 |
114 | 2(0) | 0.34 |
![[thin space (1/6-em)]](https://www.rsc.org/images/entities/char_2009.gif) |
||||||
| Nucleotide metabolism | ||||||
| 26 | gi|334882300 | Ribose-phosphate pyrophosphokinase | 35![[thin space (1/6-em)]](https://www.rsc.org/images/entities/char_2009.gif) 709 709 |
368 | 6(2) | 2.41 |
| 35 | gi|334881576 | Dihydroorotate dehydrogenase | 31![[thin space (1/6-em)]](https://www.rsc.org/images/entities/char_2009.gif) 458 458 |
154 | 3(1) | 0.49 |
| 44 | gi|489733564 | CTP synthase | 59![[thin space (1/6-em)]](https://www.rsc.org/images/entities/char_2009.gif) 728 728 |
242 | 6(0) | 1.08 |
| 48 | gi|339638332 | GMP reductase | 35![[thin space (1/6-em)]](https://www.rsc.org/images/entities/char_2009.gif) 531 531 |
98 | 2(0) | 0.09 |
| 50 | gi|334881578 | Carbamoyl-phosphate synthase pyrimidine-specific small chain | 40![[thin space (1/6-em)]](https://www.rsc.org/images/entities/char_2009.gif) 289 289 |
366 | 8(1) | 84.63 |
| 56 | gi|544928213 | Nucleoside-triphosphate diphosphatase | 21![[thin space (1/6-em)]](https://www.rsc.org/images/entities/char_2009.gif) 831 831 |
142 | 2(2) | 3.27 |
| 64 | gi|334881512 | Adenylosuccinate synthetase | 47![[thin space (1/6-em)]](https://www.rsc.org/images/entities/char_2009.gif) 453 453 |
395 | 6(3) | 0.53 |
![[thin space (1/6-em)]](https://www.rsc.org/images/entities/char_2009.gif) |
||||||
| Transcription | ||||||
| 4 | gi|328813989 | DNA-directed RNA polymerase alpha chain | 29![[thin space (1/6-em)]](https://www.rsc.org/images/entities/char_2009.gif) 284 284 |
195 | 2(2) | 2.43 |
| 25 | gi|334881701 | Primosomal protein DnaI | 35![[thin space (1/6-em)]](https://www.rsc.org/images/entities/char_2009.gif) 367 367 |
158 | 2(1) | 2.41 |
| 32 | gi|489733165 | DNA polymerase III subunit beta | 41![[thin space (1/6-em)]](https://www.rsc.org/images/entities/char_2009.gif) 439 439 |
345 | 6(2) | 1.69 |
| 41 | gi|334881375 | Chromosomal replication initiator protein dnaA | 51![[thin space (1/6-em)]](https://www.rsc.org/images/entities/char_2009.gif) 385 385 |
185 | 2(1) | 1.60 |
| 46 | gi|334881483 | Uncharacterized RNA methyltransferase lp_3226 | 53![[thin space (1/6-em)]](https://www.rsc.org/images/entities/char_2009.gif) 759 759 |
316 | 4(2) | 1.76 |
| 61 | gi|489733582 | DEAD/DEAH box helicase | 58![[thin space (1/6-em)]](https://www.rsc.org/images/entities/char_2009.gif) 875 875 |
146 | 3(1) | 0.69 |
| 69 | gi|640538996 | DNA-directed RNA polymerase subunit beta' | 135![[thin space (1/6-em)]](https://www.rsc.org/images/entities/char_2009.gif) 760 760 |
283 | 5(2) | 0.26 |
![[thin space (1/6-em)]](https://www.rsc.org/images/entities/char_2009.gif) |
||||||
| Translation | ||||||
| 1 | gi|339638926 | Ribosomal protein S1 | 47![[thin space (1/6-em)]](https://www.rsc.org/images/entities/char_2009.gif) 212 212 |
404 | 5(3) | 0.61 |
| 11 | gi|334881031 | L-2-Hydroxyisocaproate dehydrogenase | 34![[thin space (1/6-em)]](https://www.rsc.org/images/entities/char_2009.gif) 810 810 |
280 | 4(2) | 2.91 |
| 15 | gi|489734520 | Methionyl-tRNA formyltransferase | 34![[thin space (1/6-em)]](https://www.rsc.org/images/entities/char_2009.gif) 473 473 |
37 | 6(3) | 2.29 |
| 29 | gi|334881840 | Glutamyl-tRNA synthetase | 57![[thin space (1/6-em)]](https://www.rsc.org/images/entities/char_2009.gif) 050 050 |
442 | 7(5) | 2.59 |
| 38 | gi|334881788 | Ribosomal protein S30EA | 21![[thin space (1/6-em)]](https://www.rsc.org/images/entities/char_2009.gif) 698 698 |
351 | 3(3) | 0.38 |
| 42 | gi|334882268 | Elongation factor Tu (EF-Tu) | 43![[thin space (1/6-em)]](https://www.rsc.org/images/entities/char_2009.gif) 378 378 |
138 | 2(1) | 3.20 |
| 43 | gi|334882897 | Arginyl-tRNA synthetase | 63![[thin space (1/6-em)]](https://www.rsc.org/images/entities/char_2009.gif) 003 003 |
71 | 1(1) | 2.43 |
| 49 | gi|489734874 | 30S ribosomal protein S2 | 30![[thin space (1/6-em)]](https://www.rsc.org/images/entities/char_2009.gif) 208 208 |
250 | 4(1) | 0.15 |
| 51 | gi|334881700 | Threonyl-tRNA synthetase | 73![[thin space (1/6-em)]](https://www.rsc.org/images/entities/char_2009.gif) 784 784 |
256 | 4(2) | 4.76 |
| 52 | gi|334882583 | Aspartyl/glutamyl-tRNA (Asn/Gln) amidotransferase subunit B (Asp/Glu-ADT subunit B) | 53![[thin space (1/6-em)]](https://www.rsc.org/images/entities/char_2009.gif) 315 315 |
259 | 5(2) | 0.37 |
| 58 | gi|334880391 | Aspartyl-tRNA synthetase | 68![[thin space (1/6-em)]](https://www.rsc.org/images/entities/char_2009.gif) 060 060 |
105 | 2(1) | 1.24 |
| 54 | gi|334881831 | 50S ribosomal protein L10 | 18![[thin space (1/6-em)]](https://www.rsc.org/images/entities/char_2009.gif) 212 212 |
495 | 6(3) | 0.29 |
| 55 | gi|334881832 | 50S ribosomal protein L1 | 24![[thin space (1/6-em)]](https://www.rsc.org/images/entities/char_2009.gif) 742 742 |
117 | 3(0) | 0.18 |
| 57 | gi|489733962 | Elongation factor P | 76![[thin space (1/6-em)]](https://www.rsc.org/images/entities/char_2009.gif) 909 909 |
162 | 3(2) | 2.02 |
| 62 | gi|489734874 | 30S ribosomal protein S2 | 30![[thin space (1/6-em)]](https://www.rsc.org/images/entities/char_2009.gif) 208 208 |
282 | 5(3) | 0.25 |
| 63 | gi|489733967 | 50S ribosomal protein L2 | 30![[thin space (1/6-em)]](https://www.rsc.org/images/entities/char_2009.gif) 145 145 |
342 | 6(3) | 0.13 |
![[thin space (1/6-em)]](https://www.rsc.org/images/entities/char_2009.gif) |
||||||
| Stress response | ||||||
| 19 | gi|489735106 | Universal stress protein UspA | 17![[thin space (1/6-em)]](https://www.rsc.org/images/entities/char_2009.gif) 728 728 |
445 | 4(4) | 4.16 |
| 31 | gi|334882861 | ATP-dependent Clp protease, ATP-binding subunit ClpL | 75![[thin space (1/6-em)]](https://www.rsc.org/images/entities/char_2009.gif) 929 929 |
224 | 3(2) | 1.89 |
| 71 | gi|1552551 | Catabolite control protein A | 30![[thin space (1/6-em)]](https://www.rsc.org/images/entities/char_2009.gif) 742 742 |
376 | 5(3) | 0.64 |
| 72 | gi|33312966 | Heat shock protein | 19![[thin space (1/6-em)]](https://www.rsc.org/images/entities/char_2009.gif) 729 729 |
165 | 2(2) | 27.26 |
| 73 | gi|334881995 | UPF0082 protein lp_2253 | 26![[thin space (1/6-em)]](https://www.rsc.org/images/entities/char_2009.gif) 371 371 |
142 | 2(1) | 1.75 |
![[thin space (1/6-em)]](https://www.rsc.org/images/entities/char_2009.gif) |
||||||
| Transporter | ||||||
| 14 | gi|503121615 | Glycine/betaine ABC transporter ATP-binding protein | 44![[thin space (1/6-em)]](https://www.rsc.org/images/entities/char_2009.gif) 005 005 |
225 | 3(2) | 2.14 |
| 22 | gi|334882144 | Multiple sugar ABC transporter, ATP-binding protein | 41![[thin space (1/6-em)]](https://www.rsc.org/images/entities/char_2009.gif) 441 441 |
643 | 8(5) | 3.13 |
| 24 | gi|334882864 | Oligopeptide ABC transporter, ATP-binding protein | 36![[thin space (1/6-em)]](https://www.rsc.org/images/entities/char_2009.gif) 667 667 |
353 | 7(4) | 1.59 |
| 33 | gi|489733642 | PTS mannose transporter subunit IIAB | 35![[thin space (1/6-em)]](https://www.rsc.org/images/entities/char_2009.gif) 268 268 |
573 | 6(6) | 2.19 |
| 36 | gi|334883019 | Glutamine ABC transporter, ATP-binding protein | 26![[thin space (1/6-em)]](https://www.rsc.org/images/entities/char_2009.gif) 811 811 |
189 | 2(2) | 6.35 |
| 37 | gi|334882691 | Metal-dependent regulator | 23![[thin space (1/6-em)]](https://www.rsc.org/images/entities/char_2009.gif) 873 873 |
152 | 4(0) | 0.50 |
| 60 | gi|334882868 | Oligopeptide ABC transporter, substrate binding protein | 60![[thin space (1/6-em)]](https://www.rsc.org/images/entities/char_2009.gif) 321 321 |
66 | 1(1) | 6.01 |
![[thin space (1/6-em)]](https://www.rsc.org/images/entities/char_2009.gif) |
||||||
| Others | ||||||
| 5 | gi|334880815 | Lipoate-protein ligase | 1201 | 262 | 4(2) | 27.26 |
| 13 | gi|334882009 | 2,3,4,5-Tetrahydropyridine-2,6-dicarboxylate N-acetyltransferase | 24![[thin space (1/6-em)]](https://www.rsc.org/images/entities/char_2009.gif) 552 552 |
282 | 3(2) | 0.93 |
| 17 | gi|334882348 | Metallo-beta-lactamase | 27![[thin space (1/6-em)]](https://www.rsc.org/images/entities/char_2009.gif) 604 604 |
109 | 2(1) | 2.07 |
| 18 | gi|334881906 | Putative uncharacterized protein | 20![[thin space (1/6-em)]](https://www.rsc.org/images/entities/char_2009.gif) 742 742 |
105 | 1(1) | 6.94 |
| 20 | gi|489733483 | Hypothetical protein | 18![[thin space (1/6-em)]](https://www.rsc.org/images/entities/char_2009.gif) 207 207 |
246 | 3(1) | 2.19 |
| 21 | gi|300493552 | Ribose-phosphate diphosphokinase | 35![[thin space (1/6-em)]](https://www.rsc.org/images/entities/char_2009.gif) 551 551 |
2.06 | ||
| 23 | gi|334880640 | Phosphate acyltransferase | 37![[thin space (1/6-em)]](https://www.rsc.org/images/entities/char_2009.gif) 400 400 |
293 | 4(2) | 6.75 |
| 27 | gi|334880612 | 3-Oxoacyl-[acyl-carrier-protein] synthase 3 protein 2 | 35![[thin space (1/6-em)]](https://www.rsc.org/images/entities/char_2009.gif) 285 285 |
206 | 3(2) | 2.23 |
| 40 | gi|334882817 | Poly(glycerol-phosphate) alpha-glucosyltransferase | 57![[thin space (1/6-em)]](https://www.rsc.org/images/entities/char_2009.gif) 597 597 |
198 | 4(2) | 2.39 |
| 39 | gi|334882270 | Putative metallo-beta-lactamase superfamily protein | 63![[thin space (1/6-em)]](https://www.rsc.org/images/entities/char_2009.gif) 946 946 |
195 | 4(0) | 1.77 |
Cellular metabolism and flow direction were essential to the growth of L. plantarum CCFM436. Nineteen proteins were involved in carbon metabolism under manganese starvation conditions, including glyceraldehyde-3-phosphate dehydrogenase (spot 10), fructose-2-phosphate aldolase (spot 12), phosphoglycerate (spot 16), glucose-6-phosphate isomerase (spot 66) and other proteins involved in the glycolysis pathway. As a type of facultative anaerobic bacteria, the glycolysis pathway is the main energy source of L. plantarum without a TCA cycle.28,29 Meanwhile, tyrosine phosphatase and cysteine desulfurase participated in nitrogen metabolism, and CTP synthetase, dihydrolactate dehydrogenase and phosphate ribose pyrophosphate kinase were associated with nucleotide metabolism.
In terms of energy metabolism, the expression of some proteins involved in the glycolytic pathway for ATP synthesis were upregulated. For example, expression of glycosyl-bisphosphate aldolase (spot 12) and glyceraldehyde-3-phosphate dehydrogenase (spot 10) were upregulated 1.83-fold and 1.76-fold, respectively. The glycolytic pathway could be promoted through upregulation of these proteins. The expression of F0F1 ATP synthase beta (spot 2) and ATP synthase γ (spot 47) subunits, which are directly involved in the synthesis of ATP, were also upregulated 1.63-fold and 5.33-fold, respectively. Furthermore, the expression of ribose-5-phosphate isomerase (spot 8), which is involved in the pentose phosphate pathway, was also significantly increased, and its expression was upregulated 2.6-fold, indicating that pentose phosphate pathway activity was elevated under manganese starvation and provided more reduction power (NADPH) for the growth of L. plantarum CCFM436.
During amino acid metabolism, cysteine desulfurase (spot 70) catalyzed the desulfurization of cysteine to form alanine and enzyme-sulfide intermediates. The damage to superoxide ions in the cells could not be removed in time under manganese starvation conditions. Therefore, the expression of cysteine desulfurase was decreased, thereby increasing intracellular free cysteine content and regulating redox balance in the cells.8
3.5 Transcription analysis of manganese transporter genes using qRT-PCR
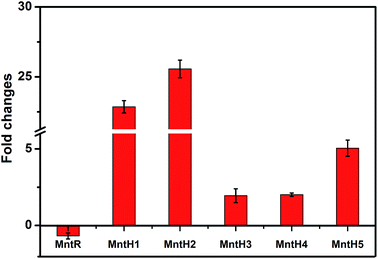
As the key regulator and defender in controlling intracellular steady-state manganese balance, the expression of manganese transporters is closely related to changes in manganese content.31,32 However, identifying manganese transporters located in the membrane by 2D electrophoresis was difficult, so qRT-PCR analysis was performed instead (Fig. 5). Manganese uptake occurred through different types of cation transporters, with an active manganese ion transport system and five manganese transporters (MntH 1–5) identified in our previous study. The expression and regulation of manganese transporters were significantly different under manganese starvation stress. The transcription level of the manganese transporter regulator (MntR) was downregulated 0.69-fold, while those of manganese transporters (MntH 1–5) were upregulated. The transcription level of MntH 2 was upregulated more than 25-fold. The negatively regulation model between MntR and MntH was consistent with transcription levels changes in MntH 1–5 under 960 mg L−1 manganese stress (data not published). MntR is a transcriptional regulator that binds two Mn atoms in manganese-replete cells and then bonds with MntH promoters to form MntR:Mn2. Therefore, the synthesis of manganese transporters can be downregulated. As the primary signal, Mn2+ can regulate the expression of Mn2+ transporters via Mn2+-dependent repressor MntR.31 The results suggest that MntH 1–5 were responsible for intracellular importation of manganese into L. plantarum, which acted as an importer under manganese starvation stress. It was necessary to acquire manganese to maintain normal L. plantarum metabolism. Mn starvation-induced metabolic changes to key elements in L. plantarum CCFM 436 are summarized in Fig. 6.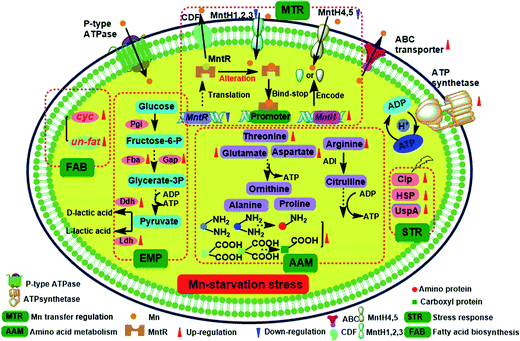 | ||
| Fig. 6 Overview of the Mn starvation-induced metabolic changes in key elements of L. plantarum CCFM 436. | ||
4. Conclusion
By analyzing cell physiology, proteomics and transporters, the response mechanisms of L. plantarum to Mn starvation stress were investigated. The results showed that μmax decreased from 0.310 to 0.256 h−1, TEM analysis indicated thinner cell morphology, and GC-MS analysis showed a higher proportion of unsaturated fatty acids and cyclopropane fatty acids, which improved the membrane fluidity and compactness. HPLC analysis of intracellular free amino acids indicated that intracellular Asp, Glu and Arg contents, which are closely related to energy metabolism, were increased. FTIR analysis showed that amino and carboxyl functional groups were significantly affected by the Mn starvation conditions. With comparative two-dimensional proteomic analysis, 73 proteins differentially expressed proteins involved in carbohydrate, amino acid and transcription/translation metabolisms, and stress response was identified under the Mn starvation conditions. Moreover, the potential Mn importer role of MntH 1–5 (negatively regulated by MntR) under Mn starvation stress was demonstrated using qRT-PCR analysis. The coordinated metabolism regulation model provides new insights into the response mechanism of probiotics under similar metal-starvation stress conditions.Acknowledgements
This work was supported by State Key Program of National Natural Science Foundation of China (No. 31530056), the Science and Nature Foundation of Jiangsu Province (No. BK 20160169), the Jiangsu Province Postdoctoral Science Foundation Funded Project (No. 1601183C), the China Postdoctoral Science Foundation Funded Project (No. 2015M581727), the Program of Introducing Talents of Discipline to Universities (B07029), the Program for Changjiang Scholars and Innovative Research Team in University (IRT1249), and the Program of Collaborative innovation center of food safety and quality control in Jiangsu Province.Notes and references
- S. I. Hsieh, M. Castruita, D. Malasarn, E. Urzica, J. Erde, M. D. Page, H. Yamasaki, D. Casero, M. Pellegrini, S. S. Merchant and J. A. Loo, Mol. Cell. Proteomics, 2013, 12, 65–86 Search PubMed.
- B. A. Eijkelkamp, C. A. McDevitt and T. Kitten, BioMetals, 2015, 28, 491–508 CrossRef CAS PubMed.
- X. Zhang, H. H. Yang and Z. J. Cui, RSC Adv., 2016, 6, 27963–27968 RSC.
- S. B. Schmidt, P. E. Jensen and S. Husted, Trends Plant Sci., 2016, 21, 622–632 CrossRef CAS PubMed.
- M. D. Angelis and M. Gobbetti, Appl. Microbiol. Biotechnol., 1999, 51, 358–363 CrossRef PubMed.
- E. J. Gudiña, E. C. Fernandes, J. A. Teixeira and L. R. Rodrigues, RSC Adv., 2015, 5, 90960–90968 RSC.
- J. N. Bhakta, K. Ohnishi, Y. Munekage, K. Iwasaki and M. Q. Wei, J. Appl. Microbiol., 2012, 112, 1193–1206 CrossRef CAS PubMed.
- H. An, F. P. Douillard, G. Wang, Z. Zhai, J. Yang, S. Song, J. Cui, F. Ren, Y. Luo, B. Zhang and Y. Hao, Mol. Cell. Proteomics, 2014, 13, 2558–2572 CAS.
- S. H. Ye, M. P. Zhang, H. Yang, H. Wang, S. Xiao, Y. Liu and J. H. Wang, Carbohydr. Polym., 2014, 30, 50–56 Search PubMed.
- S. Das, H. R. Dash and J. Chakraborty, Appl. Microbiol. Biotechnol., 2016, 100, 2967–2984 CrossRef CAS PubMed.
- N. Böhmer, S. König and L. Fischer, FEMS Microbiol. Lett., 2013, 342, 37–44 CrossRef PubMed.
- L. C. Lew, M. T. Liong and C. Y. Gan, J. Appl. Microbiol., 2012, 114, 526–535 CrossRef PubMed.
- L. Karaffa, R. Díaz, B. Papp, E. Fekete, E. Sándor and C. P. Kubicek, Appl. Microbiol. Biotechnol., 2015, 99, 7937–7944 CrossRef CAS PubMed.
- S. I. Hsieh, M. Castruita, D. Malasarn, E. Urzica, J. Erde, M. D. Page, H. Yamasaki, D. Casero, M. Pellegrini and S. S. Merchant, Mol. Cell. Proteomics, 2013, 12, 65–86 Search PubMed.
- Q. X. Zhai, F. W. Tian, G. Wang, J. X. Zhao, X. M. Liu, K. Cross, H. Zhang, A. Narbad and W. Chen, RSC Adv., 2016, 6, 5990–9997 RSC.
- J. L. Xing, G. Wang, Z. N. Gu, X. M. Liu, Q. X. Zhang, J. X. Zhao, H. Zhang, Y. Q. Chen and W. Chen, RSC Adv., 2015, 5, 37626–37634 RSC.
- J. N. Bhakta, K. Ohnishi, Y. Munekage, K. Iwasaki and M. Q. Wei, J. Appl. Microbiol., 2012, 112, 1193–1206 CrossRef CAS PubMed.
- E. Dertli, M. J. Mayer and A. Narbad, BMC Microbiol., 2015, 15, 8–16 CrossRef PubMed.
- Y. J. Tong, G. Wang, Q. X. Zhang, F. W. Tian, X. M. Liu, J. X. Zhao, H. Zhang and W. Chen, RSC Adv., 2016, 6, 102804–102813 RSC.
- E. I. Urzica, A. Vieler, A. Hong-Hermesdorf, M. D. Page, D. Casero, S. D. Gallaher, J. Kropat, M. Pellegrini, C. Benning and S. S. Merchant, J. Biol. Chem., 2013, 288, 30246–30258 CrossRef CAS PubMed.
- Y. M. Zhang and C. O. Rock, Nat. Rev. Microbiol., 2008, 6, 222–233 CrossRef CAS PubMed.
- H. J. Hwang, S. P. Choi, S. Y. Lee, J. I. Choi, S. J. Han and P. C. Lee, J. Biotechnol., 2015, 193, 130–133 CrossRef CAS PubMed.
- K. Senouci-Rezkallah, P. Schmitt and M. P. Jobin, Food Microbiol., 2011, 28, 364–372 CrossRef CAS PubMed.
- P. Newsholme, L. Stenson, M. Sulvucci, R. Sumayao and M. Krause, Compr. Biotechnol., 2011, 27, 3–14 Search PubMed.
- K. M. H. Mata, O. M. Amaya, M. T. C. Barragan, F. J. A. Tapia and E. A. Felix, Int. J. Photoenergy, 2013, 578729 Search PubMed.
- A. Hernandez, D. Guzman and H. Garcia, J. Appl. Microbiol., 2009, 107, 395–403 CrossRef PubMed.
- M. Feng, X. Chen, C. Li, R. Nurgul and M. Dong, J. Food Sci., 2012, 77, T111–T117 CrossRef CAS PubMed.
- M. F. Mazzeo, R. Lippolis, A. Sorrentino, S. Liberti, F. Fragnito and R. A. Siciliano, PLoS One, 2015, 10, e0142376–0142389 Search PubMed.
- E. Vera Pingitore, A. Pessione, C. Fontana, R. Mazzoli and E. Pessione, Int. J. Food Microbiol., 2016, 238, 96–102 CrossRef CAS PubMed.
- E. Delhaize, B. D. Gruber, J. K. Pittman, R. G. White, H. Leung, Y. Miao, L. Jiang, P. R. Ryan and A. E. Richardson, Plant J., 2007, 51, 198–210 CrossRef CAS PubMed.
- T. E. Gunter, B. Gerstner, K. K. Gunter, J. Malecki, R. Gelein, W. M. Valentine, M. Aschner and D. I. Yule, Neurotoxicology, 2013, 34, 118–127 CrossRef CAS PubMed.
- Z. Ma, F. E. Jacobsen and D. P. Giedroc, Chem. Rev., 2009, 109, 4644–4681 CrossRef CAS PubMed.
| This journal is © The Royal Society of Chemistry 2017 |

