
 Open Access Article
 This Open Access Article is licensed under a
 Creative Commons Attribution 3.0 Unported Licence
A strategy for integrated pharmacokinetic study of cardiovascular herbal medicines based on chemiluminescence and HPLC-MS/MS assays: a case using Danshen injection†
Hong Yao‡
 *a,
Peiying Shi‡b,
Xiaomei Huanga,
Zhenhuang Shenb,
Ya Sua,
Chunlei Yanga,
Meilan Zhua,
Liying Huanga,
Ailin Liua and
Xinhua Lin*a
*a,
Peiying Shi‡b,
Xiaomei Huanga,
Zhenhuang Shenb,
Ya Sua,
Chunlei Yanga,
Meilan Zhua,
Liying Huanga,
Ailin Liua and
Xinhua Lin*a
aDepartment of Pharmaceutical Analysis, School of Pharmacy, Fujian Medical University, Fuzhou 350122, China. E-mail: yauhung@126.com; xhlin1963@sina.com
bDepartment of Traditional Chinese Medicine Resource and Bee Products, College of Bee Science, Fujian Agriculture and Forestry University, Fuzhou 350002, China
First published on 28th February 2017
Abstract
Currently, it is important to explore any feasible tool to represent the integrated in vivo process of a traditional Chinese medicine (TCM) to understand its clinical dosage regimen from ancient empirical therapy. Herein, we put forward a strategy to characterize the integrated pharmacokinetic properties of multiple-component cardiovascular herbal medicines with a flow injection chemiluminescence (FI-CL) technique and an HPLC-MS/MS assay. Taking Danshen injection as a carrier, the main ingredients of this preparation were determined by HPLC as danshensu sodium (DSSN, 554.13 mg g−1), protocatechuic aldehyde (PCAL, 40.55 mg g−1), rosmarinic acid (RA, 21.66 mg g−1), salvianolic acid B (SAB, 1.67 mg g−1) and salvianolic acid A (SAA, 68.60 mg g−1). This was followed by confirmation that these phenolics could inhibit the CL signal of the KIO4–luminol system and that the inhibition was closely correlative with both their concentrations and antioxidative capability. Further, the protective effects of the main components (40 mg kg−1 per day, i.v. for 7 days) on isoprenaline-induced myocardial injury in mice were evaluated, confirming that these phenolics were the main effective substances and that antioxidation was the most important of their therapeutic effects. Subsequently, the PK profiles of the main phenolic acids in rat plasma (21 mg kg−1, single i.v.) were studied by HPLC-MS/MS with a multiple reaction monitoring mode. The phenolic acid mixture solutions could be prepared in distilled water according to their plasma drug concentrations to simulate the plasma sample solutions at each studied PK time point. All these provided the basis to evaluate their integrated PK properties through determining the total phenolic acid content in the simulation solutions by the inhibited CL signal with salvianolic acid A (SAA), the most powerful ingredient in Danshen injection, as a reference. Finally, the integrated PK properties can be characterized into the SAA “equivalent” parameters, including t1/2β, k, and AUC(0–∞), by the inhibited CL signal. Also, the results were compared with those from the “plasma drug concentration sum method” and the “AUC weighting integrated method” from previous reports. In summary, the present study provides a feasible strategy for PK analysis of cardiovascular herbal medicines with antioxidants as the main effective substances.
Introduction
The essential purpose of a pharmacokinetics (PK) study is to elucidate the in vivo process of a drug.1 With pharmacokinetic knowledge, a reasonable dosage regimen design can be proposed for a drug. However, because the components of traditional Chinese medicines (TCMs) are numerous and complex and the contribution “weight” of constituents to the therapeutic effect is less known, it is not reasonable to use one or several PK markers to represent the whole PK properties of TCMs without scientific supporting evidence. Also, it is not reasonable to sum the plasma drug concentrations of all components at each PK time point to evaluate the whole PK properties of TCMs. (For convenience, hereafter this will be called the “plasma drug concentration sum method”.) Therefore, currently, the dosage regimen design for almost all TCM preparations is not based upon in vivo process profiles, but on ancient empirical therapy, which no doubt lacks the evidential support from modern medical theory and scientific experiments. The safety, efficiency and rationality of TCM dosage in clinical practice find it hard to be approved in the western medical system. How can we characterize the contribution weight of active ingredients to the whole treatment effect of TCMs? How can we reasonably represent the whole PK properties of multiple active components by giving consideration to the effect contribution weight? All these problems are tremendous challenges in current TCM pharmacokinetic investigations.A few ideas have been proposed in the struggle to solve the above-mentioned problems. Hao et al.1 proposed a strategy to grope for an available way for integrated PK investigation of multi-component herbal medicines (for convenience, hereafter this will be called the “AUC weighting integrated method”), including: (1) firstly, appraising the PK properties and therapeutic effects of each ingredient in a TCM so as to select powerful ingredients with suitable PK characteristics as the PK markers; (2) determining the blood drug concentration of the PK markers selected and plotting the blood drug concentration–time curves of the multiple components of a TCM; (3) finally, a modeling method was investigated to integrate the blood drug concentration–time profiles of each PK marker to represent the whole in vivo process of the TCM so far as possible according to the possible contribution weight of the PK markers to the therapeutic effects. Based on this strategy, the integrated PK study of Xuesaitong injection, a herbal medicine preparation from Radix notoginseng was carried out.2 Briefly, the main chemical constituents of the injection were elucidated first, followed by an evaluation of the PK profiles and therapeutic effect of the main components. As a result, five major active constituents, notoginsenoside R1, and ginsenosides Rg1, Re, Rb1 and Rd, were considered as the PK markers. The blood drug concentration–time profiles of these markers were subsequently investigated. The ratio of AUC(0–∞) of each ingredient to the sum of the five markers' AUC(0–∞) was then calculated and considered as the PK weight coefficient of each ingredient. Finally, the integrated blood drug concentration of the five markers at each sampling time point was obtained by summing the value of the blood drug concentration × AUC(0–∞) weight coefficient of each marker, so as to draw the integrated drug concentration–time curve and calculate the integrated PK parameters to indicate the whole PK properties of the preparation.2 To search for suitable PK markers to evaluate rat exposure to a Panax notoginseng extract, Liu et al.3 investigated the absorption and disposition of ginsenosides after oral administration of Panax notoginseng extract to rats. The results showed that: (1) the ginsenosides Ra3, Rb1, Rd, Re, Rg1, and notoginsenoside R1 were the major saponins present in the herbal extract; (2) rat systemic exposure to ginsenosides Ra3, Rb1 and Rd after oral administration of the extract was significantly greater than that to the other compounds in the herbal extract; and (3) slow biliary excretion, inefficient metabolism and slow renal excretion resulted in long-circulating and thus relatively high exposure levels for these three ginsenosides. Considering these reasons, they identified plasma ginsenosides Ra3, Rb1 and Rd as PK markers for indicating rat systemic exposure to the extract. A cardiotonic pill (Compound Danshen Dropping Pill), consisting of Radix salvia miltiorrhiza, Radix notoginseng and Broneolum syntheticum, is a cardiovascular TCM. To identify suitable PK markers for indicating systemic exposure to this cardiotonic pill, Lu et al.4 performed in vitro and in silico assessments of permeability and solubility and examined in vivo PK properties of putatively active phenolic acids (including tanshinol (TSL), protocatechuic aldehyde (PCAL), salvianolic acid A (SAA), salvianolic acid B (SAB), salvianolic acid D, rosmarinic acid (RA) and lithospermic acid) from the component herb Danshen (Salvia miltiorrhiza Bunge). Plasma TSL exhibited the appropriate PK properties in dogs, and meanwhile, in vivo, in vitro and in silico studies on the other phenolic acids showed poor gut permeability and nearly undetectable levels in plasma and urine. For these reasons, TSL was proposed as a PK marker for the cardiotonic pill. In addition, similar efforts have also been reported for an integrated PK study of a herbal medicine Saussurea laniceps5 and two prescriptions were studied by Jiao-Tai-Wan6 and Huang-Lian-Jie-Du-Tang.7
All in all, the above-mentioned efforts provide valuable clues and references for multi-component PK investigation of TCMs. However, there were still many arguments about the PK markers selected by taking account of their PK properties (e.g. systematic exposure and elimination half-time) and therapeutic effects, because there was insufficient evidence that one or several PK markers could indicate comprehensively the whole PK properties and therapeutic effects of multi-component TCMs.1–3 In addition, the integrated PK parameters (resulting from the AUC weighting integrated method) at most indicated the in vivo process characteristics of a multi-component TCM, and the relevance of the parameters to the therapeutic effects of TCM was hard to ascertain and represent. Considering the limitations, Pan et al.8 determined the integrated PK profiles of two index components, gardenia acid and geniposide, and levels of superoxide dismutase (SOD) after oral Huanglian–Zhizi couplet medicine or Huang-Lian-Jie-Du-Tang in rats with middle cerebral artery occlusion (MCAO). The dose-antioxidant effect relationship was evaluated further to provide supporting evidence that the integrated PK parameters from the two index components could partly reflect the whole PK characteristic of the prescription Huang-Lian-Jie-Du-Tang.
Ideally, if a test facility, for which the response signal is not only able to indicate the integrated blood drug concentration information but is also able to reflect the integrated therapeutic effect of multi-component TCMs, can be developed, the integrated PK and PD evaluation will be able to be fulfilled simultaneously and conveniently. Furthermore, with this above-mentioned ideal tool, the resulting PK parameters will indeed be able to serve the dosage regimen design for TCM in clinics.
In this study, we develop a tool like the one mentioned above for simultaneously and conveniently indicating integrated PK and PD properties for cardiovascular herbal medicines with antioxidants as the main effective substances based on KIO4–luminol chemiluminescence (CL) and HPLC-MS/MS assays. Furthermore, taking a cardiovascular herbal medicine, Danshen injection, as the carrier, the procedure and effectiveness of this method were demonstrated in detail.
Experimental
Chemicals and reagents
Sodium danshensu (DSSN), PCA, PCAL, RA, SAA, SAB and vanillic acid (VA) were purchased from Shanghai Ronghe Medicine Technology Development Co. Ltd. (Shanghai, China). The purities of all the compounds were determined to be above 98% by HPLC analysis. Danshen freeze-dried powder injection (batch no. 1501720) was obtained from the hospital in Fuzhou, China. Isoprenaline chloride and luminol were purchased from Shanghai Yuanye Bio-technology Co., Ltd (Shanghai, China). Potassium periodate (KIO4) and sodium hydroxide (NaOH) were obtained from Guangzhou Chemical Reagent Factory (Guangzhou, China). Pentobarbital sodium was obtained from Beijing Sai Bo Run Te Science Technology Development Center (Beijing, China). Acetonitrile and methanol were of chromatographic grade (Merk KGaA, Darmstadt, Germany). Double distilled water for CL analysis was prepared in our lab. Glacial acetic acid was purchased from Sinopharm Chemical Reagent Co., Ltd. (Shanghai, China).For all CL assays, a 0.01 M luminol stock solution was prepared by dissolving luminol in 0.02 M NaOH. The luminol working solution was prepared by directly diluting the stock solution to 1.0 × 10⁻⁴ M with 0.2 M NaOH. A 0.01 M KIO4 stock solution was prepared by dissolving 0.57 g of KIO4 in water and diluting with water to 250 mL. The KIO4 working solution was prepared by diluting the stock solution to 1.0 × 10⁻⁴ M with water.
For in vitro evaluation of antioxidative capacity, standard stock solutions of DSSN (1.0 mg mL−1), PCAL (1.0 mg mL−1), RA (1.0 mg mL−1), SAB (1.0 mg mL−1) and SAA (1.0 mg mL−1) were prepared with methanol as solvent, and diluted with water to obtain a series of concentrations (1, 5, 10, 50, 100 and 500 ng mL−1). All solutions were stored in a refrigerator (4 °C) until test.
For in vivo anti-MI study, Danshen freeze-dried powder, DSSN, PCAL, RA and SAA were freshly prepared into 10 mg mL−1 with normal saline before test.
FI-CL apparatus
A flow-injection chemiluminescence (FI-CL) system scheme used in this work is shown in Fig. 1. One peristaltic pump was used to deliver luminol solution at a rate of 20 rpm. Another peristaltic pump was used to pump KIO4 and sample solution at a rate of 30 rpm. PTFE tubing (0.8 mm i.d.) was used to connect all the components in the flow system. A six-way injection valve with an 80 μL injector loop was used to inject the solution. The streams of luminol in alkaline medium, KIO4 and sample solutions were combined in a flow cell. The CL signal produced in the flow cell was detected with a photomultiplier tube and recorded by a computer using flow-injection CL analysis system software (IFFM-E, Xi'an Ruimai Electronic Equipment Corporation, Xi'an, China).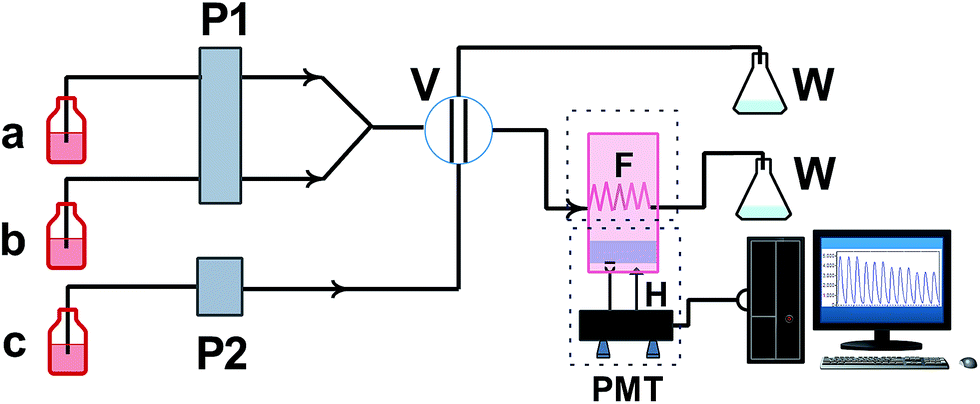 | ||
| Fig. 1 FI-CL system experimental setup for antioxidation evaluation and integrated PK study. (a) KIO4, (b) sample solution, (c) luminol solution, (P1) peristaltic pump 1, (P2) peristaltic pump 2, (V) six-way injection valve, (F) flow cell, (PMT) photomultiplier tube, (H) high voltage (operated at −700 V) and (W) waste solution. | ||
Experimental animals
The investigation conforms to the Guide for the Care and Use of Laboratory Animals published by the US National Institutes of Health (NIH Publication no. 85-23, revised 1996). The Animal Ethic Review Committee of Fujian Medical University (Fuzhou, China) approved all procedures. Male Sprague-Dawley rats (200 ± 20 g) and Kunming mice (about 8 weeks old and 20 to 30 g body weight) were obtained from Laboratory Animal Center of Fujian Medical University, Fuzhou, China and were housed in rat cages (48 × 29 × 18 cm3) and mouse cages (29 × 17.8 × 16 cm3), respectively, in a unidirectional airflow room under controlled temperature (22 ± 2 °C), relative humidity (40–70%), and a 12 h light/dark cycle. Filtered tap water was available ad libitum. The mice were given commercial mouse food ad libitum. The rats were given commercial rat food ad libitum except for the overnight period before dosing. All animals were acclimated to the facilities and environment for 7 days before the experiments.In vitro antioxidation evaluation based on FI-CL assay
As shown in Fig. 1, a sample solution was pumped and merged with KIO4 in the manifold before reaching the six-way injection valve. Next, an amount of luminol solution was injected into the merged stream through the six-way injection valve with the injector loop. Then the streams of luminol in alkaline medium, KIO4 and sample solutions were combined to produce CL in the flow cell. The CL signal produced was detected with a photomultiplier tube. The graphs were prepared by plotting the CL intensity (I) against the concentration of the phenolic acids (DSSN, PCAL, RA, SAB and SAA). The inhibition percentage of KIO4–luminol CL by the sample solution was calculated according to the formula (1):| Inhibition (%) = [(Icontrol − Isample)/Icontrol] × 100% | (1) |
In vivo anti-MI study in mice
Mice were randomly allocated into seven groups (n = 10). The first two groups received physiological saline (0.1 mL, i.p.) for 7 days and served as normal and model groups, respectively. The remaining five groups received Danshen injection, DSSN, PCAL, RA, and SAA, respectively (administration solutions were prepared into 10 mg mL−1 with physiological saline; 40 mg kg−1 dose; i.p.) for 7 days. All groups, except for the normal one, received 6 mg kg−1 of isoprenaline chloride once daily for two successive days (in the 4th and 5th days of treatment).Twenty-four h after the last treatment, animals were anesthetized with pentobarbital sodium (70 mg kg−1; i.p.) for ECG monitoring with a standard artifact free lead II (right forelimb to left hind limb). Needle electrodes were inserted subcutaneously into the limbs of each mouse and connected to an MD3000 bioinformation collector (Huaibei Zhenghua Bioinstrument Co., Ltd., Anhui, China). The ECG was measured to determine the PR and QT intervals as well as the heart rate. Thereafter, blood samples were collected from the abdominal aorta for serum separation and estimation of creatine kinase (CK), CK-MB and α-hydroxybutyrate dehydrogenase (α-HBDH) activity. Mice were then sacrificed by decapitation. Immediately after the sacrifice of the mice, the hearts were treated according to the method reported for sectioning and hematoxylin and eosin (H&E) staining.9 Sections from the left ventricle were examined by light microscopy (Leica DMR, Germany) at 200× magnification.
Administration and sample pretreatment for PK study
Three rats received a single i.v. administration of Danshen injection at a dose of 21 mg kg−1 (the dosing solutions were prepared unifiedly into 1 mL with physiological saline) via the tail vein. In particular, for i.v. administration, the injection site was selected at about the 1/2 station of the rat tail.10 After administration, the rat tail was carefully cleaned with alcohol soaked cotton balls around the injection site to remove as much of the residual drug as possible. Approximately 200 μL of blood was collected from the cut-tail before dosing and at the following time points: 5, 10, 15, 30, 45, 60 min, and 2, 4, 6, 8, and 10 h after dosing. Plasma was isolated from the blood samples by centrifugation and then stored at −20 °C until analysis.For LC-MS analysis, stored samples were allowed to thaw at ambient temperature, followed by shaking for 30 s via a vortex apparatus. Plasma (50 μL) was removed and transferred to an appropriately labeled polypropylene tube (1.5 mL) containing 2 μL of hydrochloride solution (1 M), 10 of μL internal standard solution (10 μg mL−1 VA) and methanol (150 μL), followed by shaking for 2 min using a vortex apparatus. The samples were centrifuged (13![[thin space (1/6-em)]](https://www.rsc.org/images/entities/char_2009.gif) 000 rpm for 15 min) and 2 μL of clear supernatant was injected into HPLC-MS system for bioanalysis by a validated HPLC-MS/MS method.
000 rpm for 15 min) and 2 μL of clear supernatant was injected into HPLC-MS system for bioanalysis by a validated HPLC-MS/MS method.
Triple quadrupole LC/MS bioassays
A multiple reaction monitoring LC-MS method was developed and used to determine phenolic acids in rat plasma.The apparatus used was a Shimadzu LC 20A system consisting of a binary pump, a degasser, an auto-sampler and a thermostat. Separation was carried out by elution on an Ultimate XB-C18 column (50 mm × 4.6 mm, 3.5 μm). The mobile phase consisted of deionized water–acetic acid (A; 100:0.5, v/v) and acetonitrile (B). The gradient elution was employed as follows: 15–20% B at 0–1 min; 20–22% B at 1–2.5 min; 22–28% B at 2.5–4.5 min; 28–38% B at 4.5–7.5 min; 95% B at 7.6–8.5 min. The re-equilibrium took 9.5 min, giving a total run time of 18 min. The flow rate was 0.6 mL min−1. The column temperature kept at 30 °C and the volume of sample injected was 2 μL.
Mass spectrometric detection was carried out with a triple quadrupole mass spectrometer (LCMS 8040; Shimadzu Corporation, Japan), operating in the negative electrospray ionization mode (ESI). Electrospray ionization and collision energy were optimized to maximize generation of the [M − H]− and to produce the characteristic product ions, respectively. The precursor-to-product ion pairs used for multiple reaction monitoring (MRM) of DSS, PCAL, RA, SAB, SAA and VA were m/z 197.10 → 179.15, 137.25 → 107.95, 359.10 → 161.00, 717.00 → 518.85, 493.10 → 294.90 and 167.05 → 151.95, respectively.
The HPLC-MS/MS method was validated by linearity, lower limit of quantification (LLOQ), lower limit of detection (LLOD), precision, accuracy, extraction recovery, matrix effect and stability for the five main antioxidants, DSS, PCAL, RA, SAB and SAA in plasma. Calibration curves were plotted for the phenolic acids (DSS, 1.0–2000 ng mL−1; PCAL, 1.2–2400 ng mL−1; RA, 1.1–2200 ng mL−1; SAB, 1.0–2000 ng mL−1; SAA, 1.0–2000 ng mL−1) using weighted linear regression of the ratio of analyte and internal standard (VA, 500 ng mL−1) peak areas against the corresponding nominal concentration of the analyte. LLOQ was defined as the lowest concentration at which both precision and accuracy were below 20% with the ratio of signal to noise more than 10 (S/N > 10). LLOD was defined as the detectable concentration at which the ratio of signal to noise was more than 3 (S/N > 3). Intra- and inter-day accuracy and precision were assessed by detecting QC samples using six replicates of rat samples at three concentration levels for phenolic acids DSS (1.2, 200 and 1600 ng mL−1), PCAL (1.5, 250 and 2000 ng mL−1), RA (1.5, 250 and 2000 ng mL−1), SAB (1.2, 200 and 1600 ng mL−1) and SAA (1.2, 200 and 1600 ng mL−1) on one or three validation days. Accuracy and precision were expressed by relative error (RE%) and coefficient of variance (CV%), respectively. The extraction recovery, matrix effect and stability of the phenolic acids DSS, PCAL, RA, SAB and SAA were determined by the above-mentioned QC samples according to previous reports.11,12
FI-CL assay for integrated PK study
Firstly, 400 mg of Danshen freeze-dried powder injection was dissolved and diluted into 200 ng mL−1 in water according to the labeled content, 400 mg total phenolic acids/bottle and quantified with SAA as the standard reference (1, 5, 10, 50, 100, 500 and 1000 ng mL−1). The result was expressed as SAA equivalent content with the developed FI-CL method.For the PK study, the FI-CL assay procedure was the same as that of in vitro antioxidation evaluation. The phenolic acid mixture solutions could be prepared in double-distilled water according to their plasma drug concentrations at each studied PK time point by the HPLC-MS/MS analysis. The CL integrated PK properties were evaluated by determining the total phenolic acid content in the simulation mixture solutions by the inhibited CL signal with SAA, a most powerful ingredient in Danshen injection, as the reference. The CL integrated drug concentration–time curve was prepared by plotting the PK time point against the relative CL integrated concentration (SAA equivalent concentration). Finally, the integrated PK properties were characterized into the SAA “equivalent” parameters, including t1/2β, k, and AUC(0–∞), by the inhibited CL signal.
For further comparison by the plasma drug concentration sum method, the plasma drug concentrations of the main phenolic acids at each PK time point were summed directly to obtain the approximate total phenolic acid concentration in plasma. The resulting total concentration–time curve was prepared by plotting the PK time point against the relative sum concentration.
In addition, AUC weighting integrated analysis was performed according to previous reports.1,2,8
Data processing
Noncompartmental pharmacokinetic parameters were calculated by DAS 2.0 software (Chinese Pharmacologic Society, Beijing, China). For plasma PK, the area under the plasma concentration–time curve from time zero to the last measurable concentration (AUC(0→t)) was calculated using the trapezoidal rule; the AUC(0→∞) was obtained by extrapolating AUC(0→t) to infinity; the apparent elimination half-life (t1/2β) was calculated from the terminal log-linear portion of the plasma; and the total body clearance (Cltot), apparent volume of distribution (Vd), mean residence time (MRT) and elimination rate constant (k) were also calculated by the noncompartmental pharmacokinetic mode.All the results are expressed as mean ± S.D. A single-tailed Student's t test was performed in the work.
Results and discussion
The strategy and principles for integrated PK study
Oxidative stress plays a critical role in the development of cardiovascular diseases (CVDs) (Griendling and Garret, 2003). Cardiac protection by suppressing lipid peroxidation and cardiac apoptosis are crucial as a remedial strategy for CVDs.13,14 Currently, a number of cardiovascular herbal medicines have been used against CVDs, such as Honghua injection, Danhong injection, Sanqi injection, Shengmai injection, Kudeizi injection, Danshen injection, Xiangdan guanxin injection, Guanxinning injection, Xindakang capsules, Compound Danshen injection and Compound Danshen Dripping Pill.15 Most of them contain mainly polyphenols and phenolic acids, and antioxidation is one main contribution to their cardiovascular effects. For example, Honghua injection, made from Flos carthami extract, contains mainly hydroxysafflor yellow A, quercetin and kaempferol.16,17 Kudiezi injection made from Ixeris sonchifolia extract, contains mainly luteolin-7-O-β-D-glucoside, luteolin-7-O-gentiobioside and luteolin-7-O-β-D-glucuronide.18,19 Xindakang capsule, from the extract of Fructus hippophae, contains mainly quercetin and isorhamnetin.20 Danshen injection, Xiangdan guanxin injection and Guanxinning injection (made from the hydrophilic extract of Radix Salviae miltiorrhizae), contain mainly phenolic acids involving danshensu (DSS), PCAL, caffeic acid, RA, SAA, SAB, etc.21 These polyphenols or phenolic acids are powerful antioxidants, which are definite contributors to the cardiovascular effects.22–25 This evidence implies that after administration of one of the above-mentioned cardiovascular herbal medicines, the total antioxidant level in vivo should be an objective index reflecting the total antioxidative effect and/or the whole therapeutic effect for the multi-component herbal medicine.In previous work, polyphenols or phenolic acids were observed to be able to inhibit the DPPH˙–luminol or H2O2–luminol CL reaction and based on these observations, a CL platform for antioxidation evaluation of total flavonoids or flavonoid glycosides from herbal medicines was developed.26 It actually provides an ideal tool, by which the total amount of antioxidant (total powerful constituents of the drug) of a cardiovascular herbal medicine could be quantified and the total antioxidative effect of the powerful constituents could also be indicated conventionally in vitro by the inhibited CL signal with a suitable luminol CL system. This also means that, if the main antioxidants (main powerful constituents) in vivo can be determined by a reliable method, such as HPLC-MS/MS and a simulated plasma drug mixture solution could also be prepared according to the plasma drug concentration information at each PK time point, the whole in vivo process of the herbal medicine could be profiled easily by determining the total antioxidant concentration in the simulated plasma drug mixture solution by a suitable CL system. Meanwhile, because the inhibited CL signal could indicate the antioxidative effect of the main antioxidants (main powerful constituents) from the herbal medicine, the integrated therapeutic effect of the cardiovascular herbal medicine could also be reflected simultaneously by the CL signal. In other words, with a suitable CL reaction system, the response signal would not only indicate the integrated blood drug concentration (antioxidant concentration in vivo) but also reflect the integrated therapeutic effect (antioxidative effect) of the multi-component herbal medicines, and the integrated PK analysis could be carried out conveniently. Accordingly, the resulting PK parameters would be naturally able to reflect the PD properties of the multi-component herbal medicine in vivo by the in vitro method. For this goal, DPPH˙–luminol, H2O2–luminol, K3Fe(CN)6–luminol and KIO4–luminol were tested in our experiments. The final definite CL system is KIO4–luminol, because the oxidizer, KIO4 is most stable and the stability of the CL signal is best. Ultimately, if the plan does work, the integrated PK properties of the multiple-component herbal medicine will be conveniently characterized by the inhibited CL signal. However, before the resulting integrated PK profiles can serve for dosage regimen design, the antioxidative capacity of each constituent must be confirmed to be correlative with its therapeutic effect on cardiovascular diseases. To solve this problem, literature mining or further in vivo experiments with cardiovascular animal models should be performed to obtain the supporting evidence.
Based on the discussion above, an integrated PK study strategy was put forward for cardiovascular herbal medicines with antioxidative constituents as the main effective substances. As shown in Fig. 2, five main steps are referred to: (1), the chemical basis of a herbal medicine to be studied must be firstly elucidated by HPLC, HPLC-MS, or other tools; (2) and (3), in vitro antioxidative capability ordering by KIO4–luminol CL reaction and in vivo cardiovascular effect ordering by disease animal model evaluation are performed and compared to confirm the correlation between in vitro antioxidation and in vivo therapeutic effect; (4), PK profiles of the main antioxidants are studied by a reliable method, such as HPLC-MS/MS, to ascertain their plasma drug concentrations at studied PK time points; (5), the simulated plasma drug mixture solutions are prepared according to the plasma drug concentration information at each PK time point and the CL integrated PK studies are performed by using the KIO4–luminol-simulated plasma drug mixture solutions CL reaction, with the strongest active ingredient as the reference. Finally, the integrated PK and PD profiles of multi-component herbal medicines can be characterized into the strongest active ingredient “equivalent” properties.
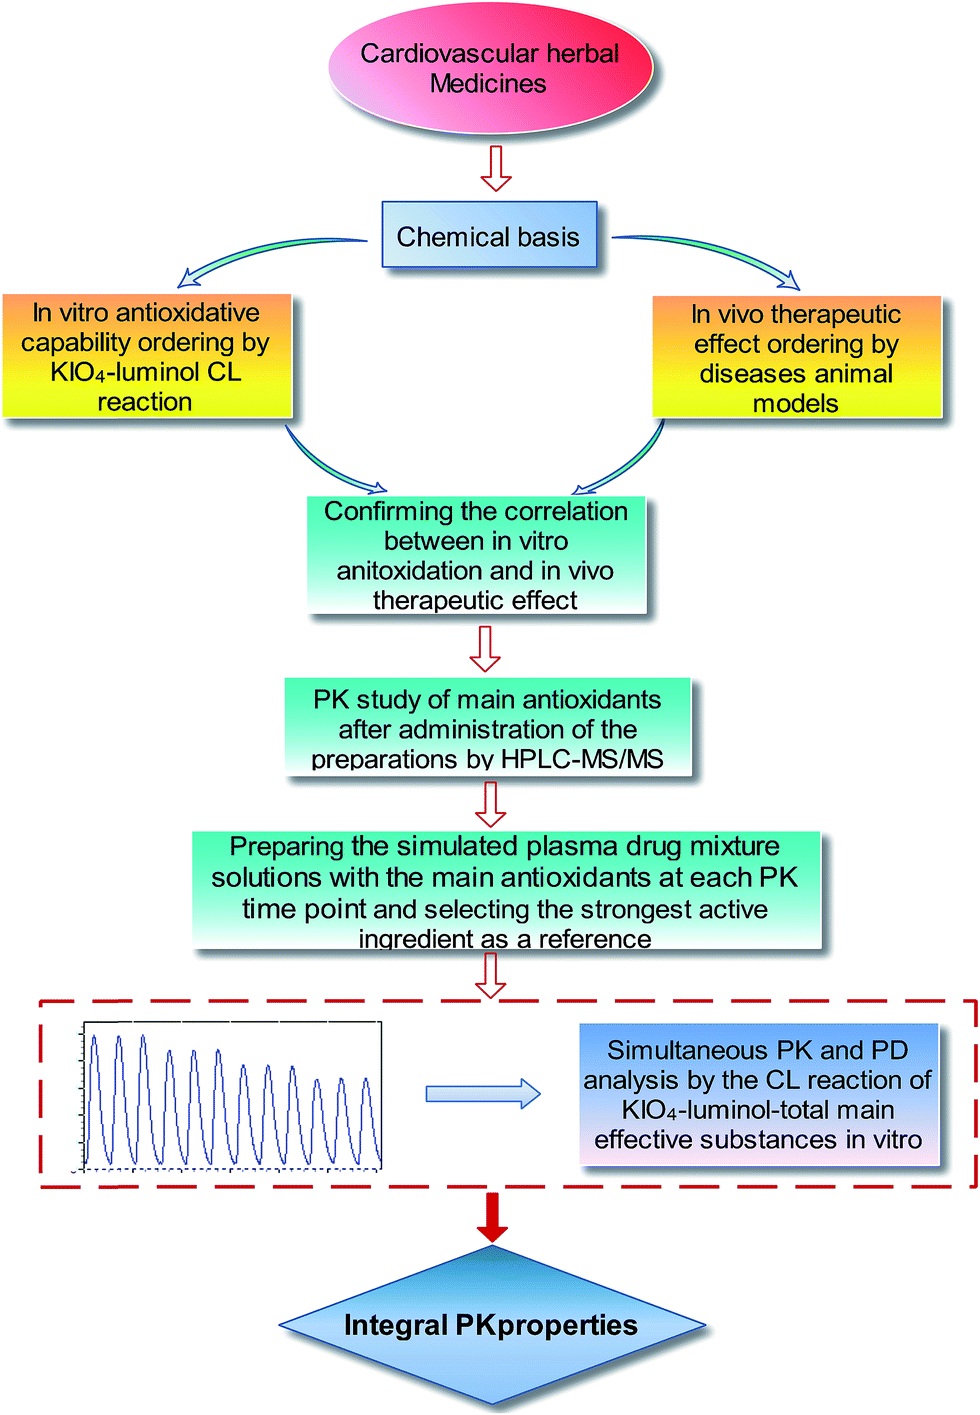 | ||
| Fig. 2 The proposed strategy for integrated PK study based on the KIO4–luminol CL reaction for cardiovascular herbal medicines with antioxidative constituents as the main effective substances. | ||
Confirming the correlation between in vitro antioxidation and in vivo therapeutic effect for Danshen injection
To practice the strategy, a widely used cardiovascular herbal medicine, Danshen injection (lyophilized powder), was adopted as a methodological carrier. Firstly, the chemical constituents of the preparation were identified and quantified by the HPLC-DAD method (data are shown in ESI†). Five main phenolic compounds up to about 70% in total solids, DSSN (554.13 mg g−1, 55.41% in total solid), PCAL (40.55 mg g−1, 4.05% in total solid), RA (21.66 mg g−1, 2.17% in total solid), SAA (68.60 mg g−1, 6.86% in total solid) and SAB (1.67 mg g−1, 0.17% in total solid), were determined in the injection. The FI-CL running conditions, including KIO4 concentration, luminol concentration and pump rate, were optimized with water as the test sample. The inhibitions of five phenolic compounds to the KIO4–luminol CL reaction were then examined to evaluate their in vitro antioxidative capabilities. As shown in Fig. 3, four compounds, PCAL, RA, SAB and SAA, show dose-dependent inhibition to the CL signal within the concentration range of 1–500 ng mL−1. The inhibition is also significant for DSS at 1–100 ng mL−1, but decays at 500 ng mL−1. The calculated IC50 values and areas under the inhibition rate–concentration curve (AUCr–c) are shown in Table 1. There was no significant difference for the IC50 values between PCAL and SAB (P > 0.05) and for the AUCr–c values between DSS and SAB (P > 0.05). From IC50 values, the evaluated antioxidative capability ordering is DSS > SAA > RA > PCAL ≈ SAB, which is consistent with a previous report in vitro.27 However, all these components in vivo should experience a dynamic process after administration of a Danshen injection. Their antioxidative effect should also alter dynamically with their changing circulation levels. Therefore, the ordering of antioxidative effect resulting from their IC50 values at most only reflects their antioxidative properties at the respective corresponding IC50 concentration. The AUCr–c is the area under the inhibition rate–concentration curve, which could comprehensively represent the contribution of an antioxidant at different concentration levels to its antioxidative effect. Accordingly, the ordering of antioxidative capability based on the AUCr–c values should more believably reflect their antioxidation effect in vivo for these phenolic acids. Based on the AUCr–c values, the ordering of evaluated antioxidative effect is SAA > RA > PCAL ≈ DSS ≈ SAB. In summary, the main components of this preparation, phenolic acids, could inhibit the CL signal of the KIO4–luminol reaction and the inhibition effect was closely correlative with both their concentrations and antioxidative capability. This provided the basis to evaluate their integrated PK properties through determining their total concentration using the inhibited CL signal with SAA, the most powerful ingredient in Danshen injection, as a reference, and meanwhile the determined value could also be considered to be a reasonable index of the total antioxidative effect of ingredients in vivo.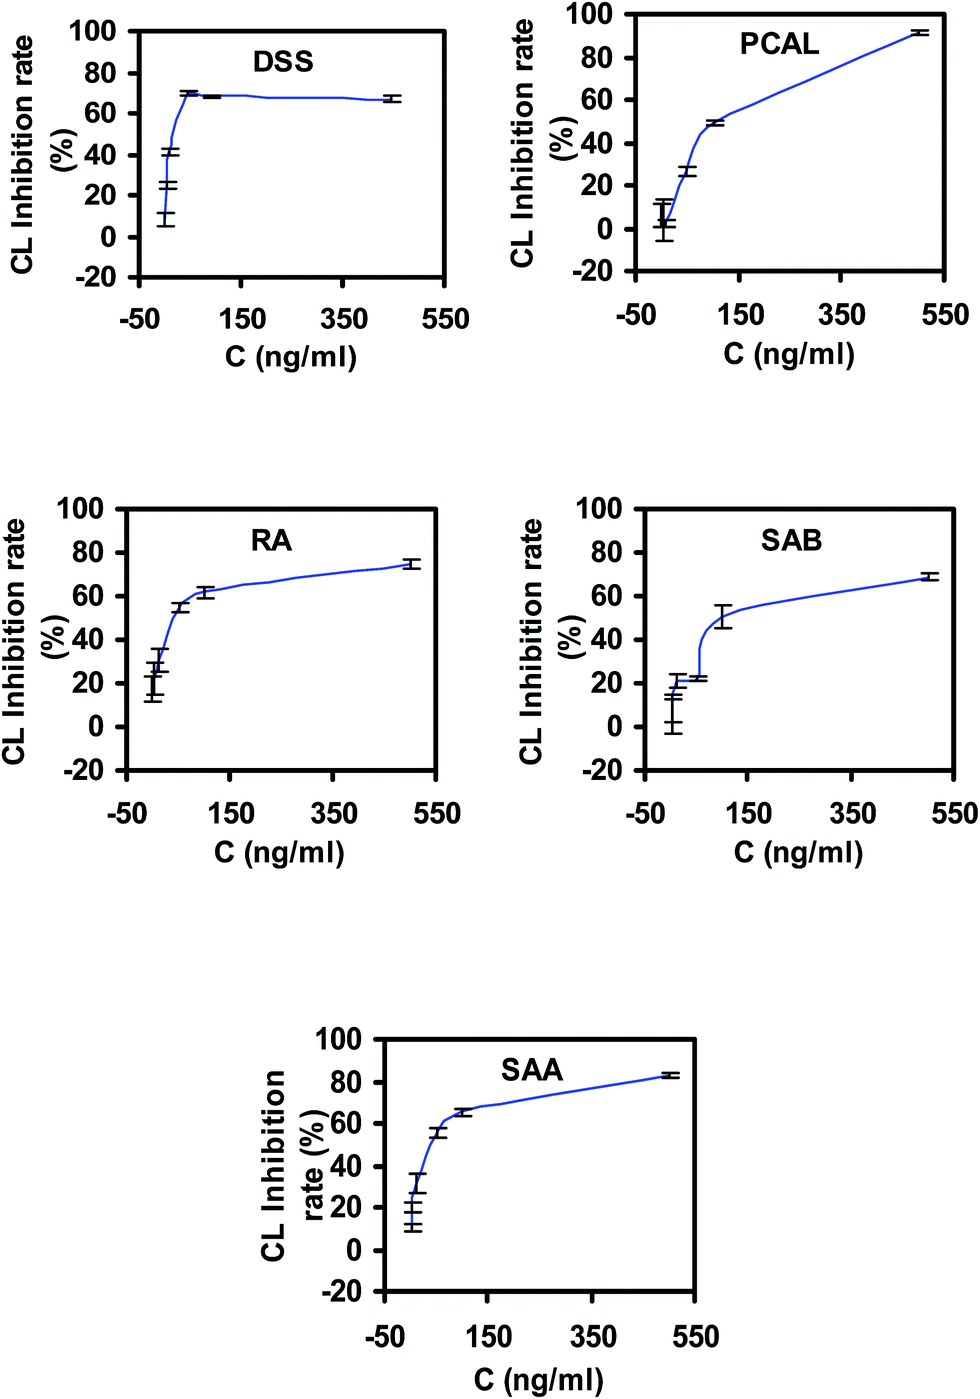 | ||
| Fig. 3 The inhibition of the five phenolic acids to the KIO4–luminol CL reaction (mean ± SD, n = 3). | ||
| Analytes | IC50 (ng mL−1) | AUCr–c (% ng mL−1) |
|---|---|---|
| a *P > 0.05, vs. PCAL. Δ **P > 0.05, vs. DSS. | ||
| DSS | 13.15 ± 0.07 | 28459.03 ± 1757.27 |
| PCAL | 100.40 ± 0.23 | 30591.33 ± 47.96Δ |
| RA | 38.97 ± 0.73 | 32121.33 ± 118.64 |
| SAA | 36.02 ± 0.14 | 34524.67 ± 66.21 |
| SAB | 100.12 ± 1.42* | 26528.33 ± 149.81** |
The antioxidative capability of some phenolic acids is correlative with their cardiovascular effect in vivo according to a few previous reports. SAA and RA can significantly inhibit the decrease in cell viability induced with hydrogen peroxide, at concentrations of 25–100 μg mL−1; they can also significantly inhibit LDH leakage induced by anoxia–reoxia injury at concentrations of 12.5–100 and 50–100 mg L−1, respectively. The direct protective effect on cardiomyocytes of the compounds were considered to be one of the therapeutic mechanisms of Salviae miltiorrhizae radix on myocardium ischemia.28,29 SAB has a significant protective effect on myocardial ischemia–reperfusion injury and the mechanisms refer to alleviating oxidative stress, reducing calcium overload, etc.30 In acute myocardial infarction rat models induced by coronary artery ligation, the plasma concentration of GSH declined significantly and the GSH level could be elevated after treatment with Danshen injection added water-soluble components. The effects of water-soluble components in Danshen injection on the GSH were ordered as: SAA > PCAL ≈ SAB > DSS,31 which are similar to the results of the present antioxidation ordering. In addition, a few studies demonstrated that the cardiovascular effects of SAA were significantly superior to those of SAB by using acute myocardial ischemia rat models.31,32 2.5, 5 and 10 mg kg−1 dosages of SAA and 10 mg kg−1 dosages of SAB via i.v. administration could lower the ST-segment elevation and reduce infarct size and serum CPK and LDH. The effect of SAA at 5 and 10 mg kg−1 dosage was significantly higher than that of SAB, and the improving effect of 2.5 mg kg−1 dosages of SAA to acute myocardial ischemia rat models was equivalent to that of SAB at 10 mg kg−1 dosage.33 8 mg kg−1 dosage RA could significantly improve postischemic regional systolic wall thickening in myocardial ischemia/reperfusion injury rat models.34 10 mg kg−1 dosage of PACL via i.v. administration could reduce myocardial infarct size and the activities of creatine kinase-MB and cardiac troponin I (cTn-I) in myocardial ischemia/reperfusion injury rat models.35 30 mg kg−1 dosage DSSN shows an obvious cardioprotective effect on myocardial ischemia–reperfusion injury in rats via tail vein administration, but 15 mg kg−1 dosage DSSN did not produce the same effect.36 In addition, 50 mg kg−1 dosage SAB could show a protective effect on coronary ligation induced rat cardio-ischemia models via p.o. administration.37 According to this evidence from literature mining, SAA could be the most powerful constituent accounting for the in vivo cardioprotective effect of Danshen injection and the therapeutic effect ordering for the five phenolics could be inferred as SAA > RA > PCAL ≈ SAB ≥ DSS, which is similar to the ordering based on AUCr–c values.
Further, four components with a high content and strong antioxidative capacity in the injection, DSS, SAA, RA and PCAL, were examined (40 mg kg−1 dosage for each; i.p.) in the anti-MI study in mice. Histopathology of mouse heart from the normal control showed a normal architecture structure with striations, branched appearance and continuity with adjacent myofibrils (Fig. 4). Heart tissue from the MI mouse models showed marked infiltrating inflammatory cells, edema and inferior continuity with adjacent myofibrils. Tissue sections from both of the DSI-treated and SAA-treated groups showed less severe histological damage: namely, normal myocardial arrangement, clear transverse striations and few invasive inflammatory cells. The DSS-treated group showed mild edema, inflammatory infiltration and loss of striations in heart tissue. The PCAL-treated group showed mild edema and inflammatory infiltration. The RA-treated group showed inflammatory infiltration, slight edema and clear striations in heart tissue. The histopathological results suggested that DSI, DSS, SAA, RA and PCAL indeed possessed a favorable anti-MI effect and the therapeutic effect ordering is DSI = SAA > RA > PCAL > DSS.
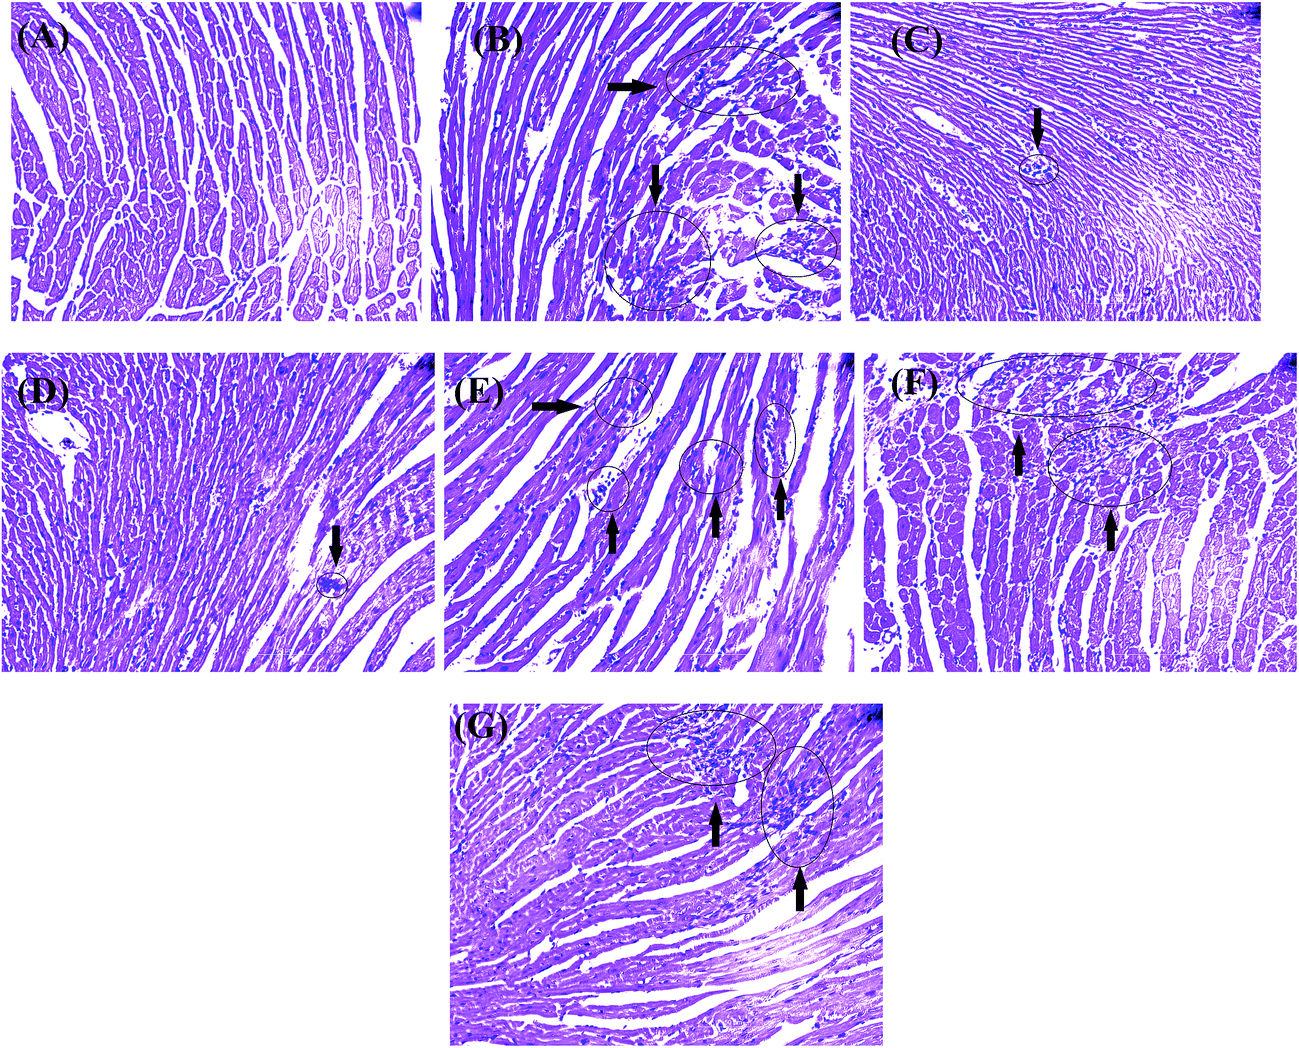 | ||
| Fig. 4 Histological observations of hearts from each group. (A) Normal mouse showing normal architecture of the heart tissue with striations, branched appearance and continuity with adjacent myofibrils; (B) isoprenaline-induced myocardial injury mouse showing multiple focal areas of myocardial cell degeneration with server edema, inflammatory infiltration and inferior continuity with adjacent myofibrils; (C) DSI-treated and (D) SAA-treated mice showing almost normal cardiac fibers; (E) DSS-treated mice showing multiple focal areas of myocardial cell degeneration with mild edema and inflammatory infiltration; (F) PCAL-treated mouse showing multiple focal areas of myocardial cell degeneration with mild edema, inflammatory infiltration; (G) RA-treated mouse showing multiple focal areas of myocardial cell degeneration with inflammatory infiltration. i.p. dose was 40 mg kg−1 b.w. for all groups. | ||
As shown in Fig. 5, the ECG of the normal mouse shows a regular pattern with defined P, QRS, and T waves. The isoprenaline-induced MI mouse model shows an elevated ST segment and increased QT interval as well as stepping down heart rates (P < 0.05 vs. normal group) (Fig. 6), suggesting that the MI mouse models were prepared successfully. The ST segment elevation seldom occurred in DSI-, SAA- and PCAL-treated groups, and was also attenuated in DSSN- and RA-treated groups. Treatment with SAA, RA, PCAL and DSSN resulted in a change to the increased QT interval compared to the MI model group (P < 0.05) (Fig. 6). For all the administration groups, the heart rates were back to the level in the normal group (P > 0.05 vs. normal group; P < 0.05 vs. MI group). As shown in Fig. 7, biochemical changes could be observed in the MI groups. Isoprenaline increased serum CK, CK-MB and α-HBDH activity, suggesting that myocardial injury occurred in the MI group.9,38 Meanwhile, both DSI and SAA (40 mg kg−1 dosage; i.p.) significantly decreased the serum CK, CK-MB and α-HBDH activity (P > 0.05 vs. normal group; P < 0.05 vs. MI group), suggesting that DSI and SAA had a strong protective effect against isoprenaline-induced myocardial injury in mice and that SAA could be the most powerful ingredient in Danshen injection. All the orderings of means of the serum CK, CK-MB and α-HBDH activity for the four treatment groups were SAA > RA > PCAL > DSS. According to the results, the ordering therapeutic effect in vivo could be confirmed as SAA > RA ≥ PCAL ≥ DSS.
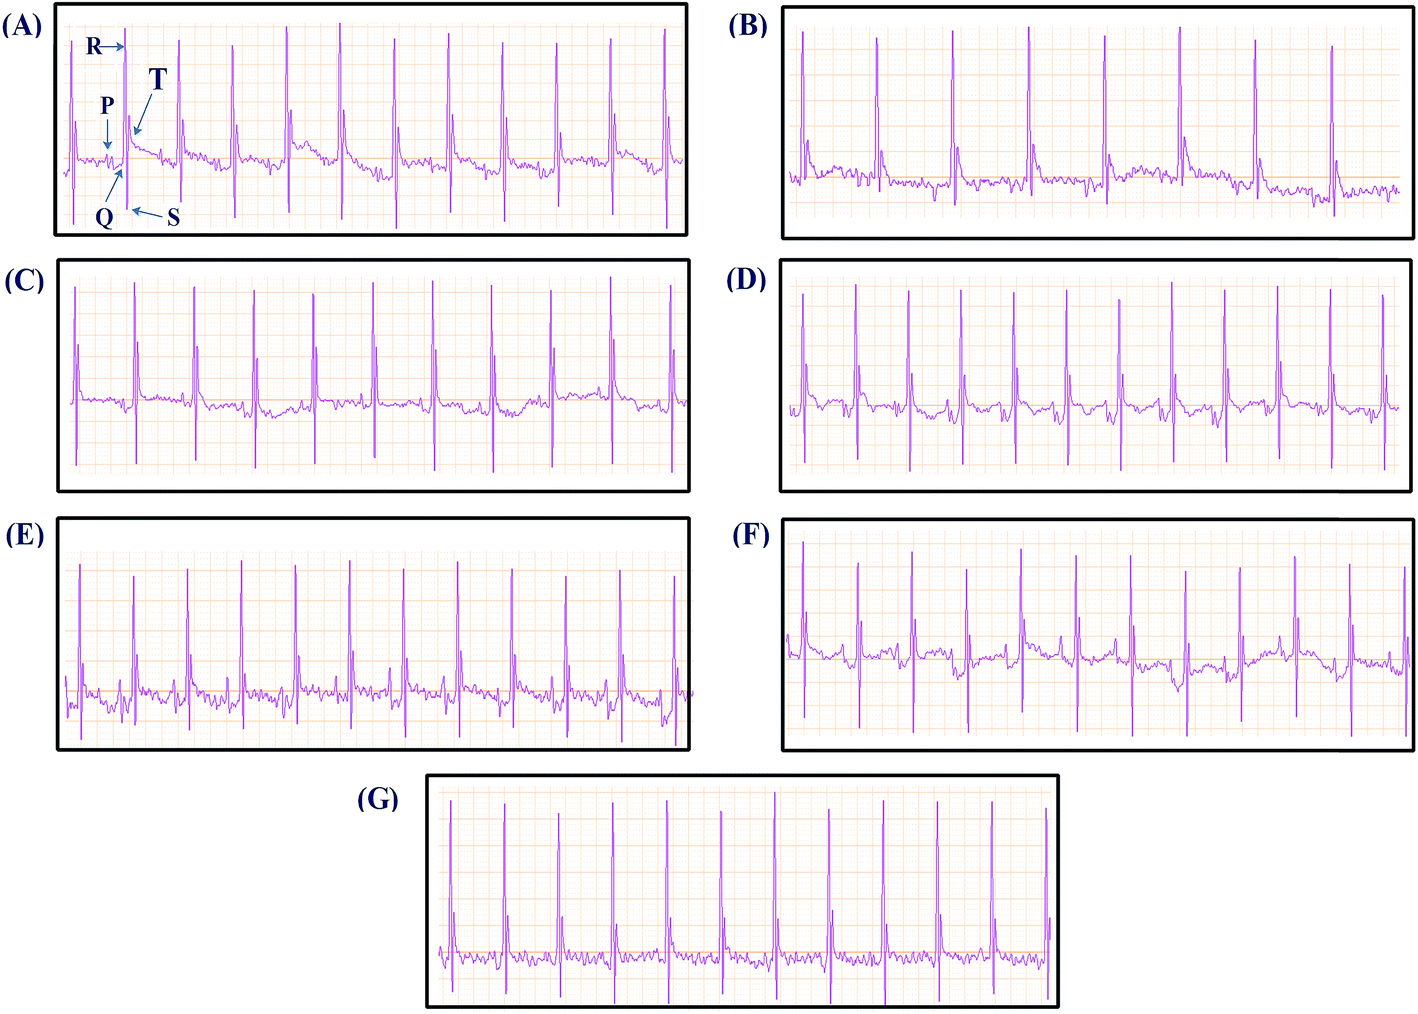 | ||
| Fig. 5 Typical Lead II ECG graphs. (A) Normal mouse ECG; (B) isoprenaline-induced myocardial injury mouse ECG; (C) DSI-treated mouse ECG; (D) SAA-treated mouse ECG; (E) DSS-treated mouse EGC; (F) PCAL-treated mouse ECG; (G) RA-treated mouse ECG. i.p. dose was 40 mg kg−1 b.w. for all groups. | ||
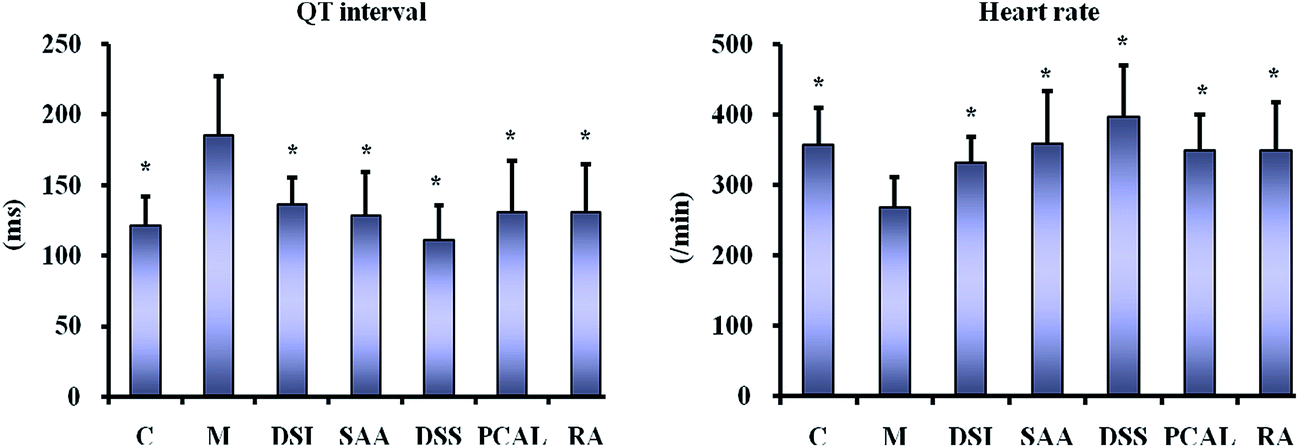 | ||
| Fig. 6 Mice QT interval and heart rate after the treatment for 7 days. C, M, DSI, SAA, DSS, PCAL and RA represent normal, MI model, DSI-treated, SAA-treated, DSS-treated, PCAL-treated and RA-treated groups, respectively (mean ± SD, n = 10). *P < 0.05 vs. MI group. i.p. dose was 40 mg kg−1 b.w. for all groups. | ||
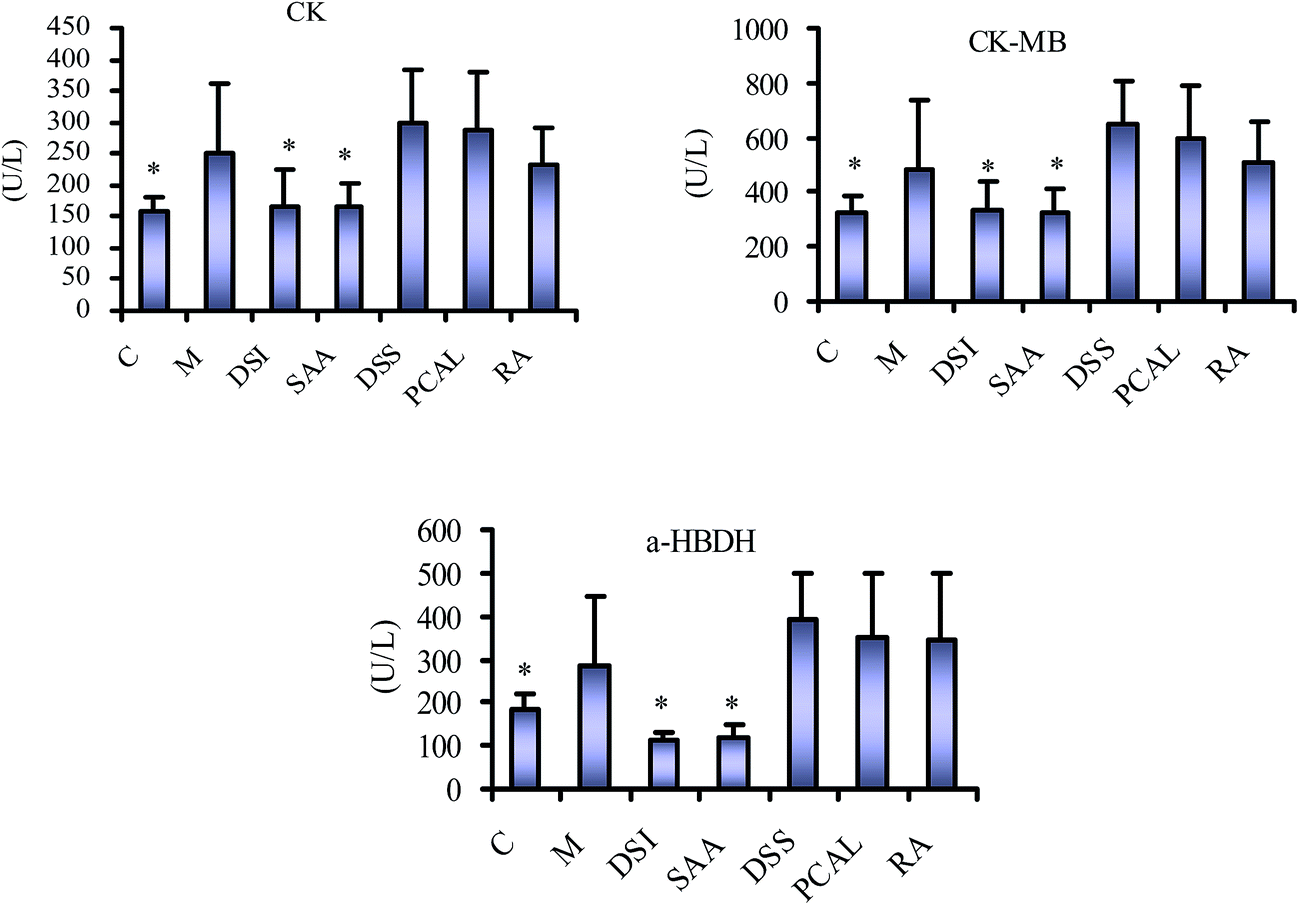 | ||
| Fig. 7 Effects of DSI, SAA, DSS, PACL and RA on serum CK, CK-MB and α-HBDH. C, M, DSI, SAA, DSS, PCAL and RA represent normal, MI model, DSI-treated, SAA-treated, DSSN-treated, PCAL-treated and RA-treated groups, respectively (mean ± SD, n = 10). *P < 0.05 vs. MI group. i.p. dose was 40 mg kg−1 b.w. for all groups. | ||
All these above-mentioned results further confirmed the correlation between in vitro antioxidation and in vivo therapeutic effect. Phenolic acids were the main effective substances and antioxidation is the most important of their therapeutic effects in Danshen injection, which accordingly also provides the basis to evaluate their integrated PK and PD properties by determining the total concentration of their main antioxidants using the inhibited CL signal with SAA, the most powerful ingredient in Danshen injection, as a reference.
In summary, SAA, the most powerful ingredient in Danshen injection, was identified as a suitable reference for integrated PK study, by which both of the total PK and PD properties of the main phenolic acids of Danshen injection can be simultaneously integrated and characterized into SAA equivalent properties by using the inhibited CL signal from the KIO4–luminol-total phenolic acids reaction. Accordingly, the resulting integrated PK parameters of Danshen injection in rat plasma can be represented as the SAA equivalents, including t1/2β and AUC(0–t).
PK profiles of the main antioxidants in rats by HPLC-MS/MS
For HPLC-MS/MS bioanalysis, method validation was performed referring to linearity, lower limit of quantification (LLOQ), lower limit of detection (LLOD), extraction recovery, precision, accuracy, matrix effect and stability for the five main antioxidants, DSS, PCAL, RA, SAB and SAA, in plasma. The typical MRM chromatograms of the five main antioxidants in plasma and blank plasma are presented in Fig. 8, from which no interference or endogeneity could be observed, suggesting the good specificity of the presented HPLC-MS/MS bioanalysis method. All results (data are not shown) were satisfactory, suggesting that the developed HPLC-MS/MS bioanalysis method could be used for the simultaneous determination of the main phenolic acids in rat plasma.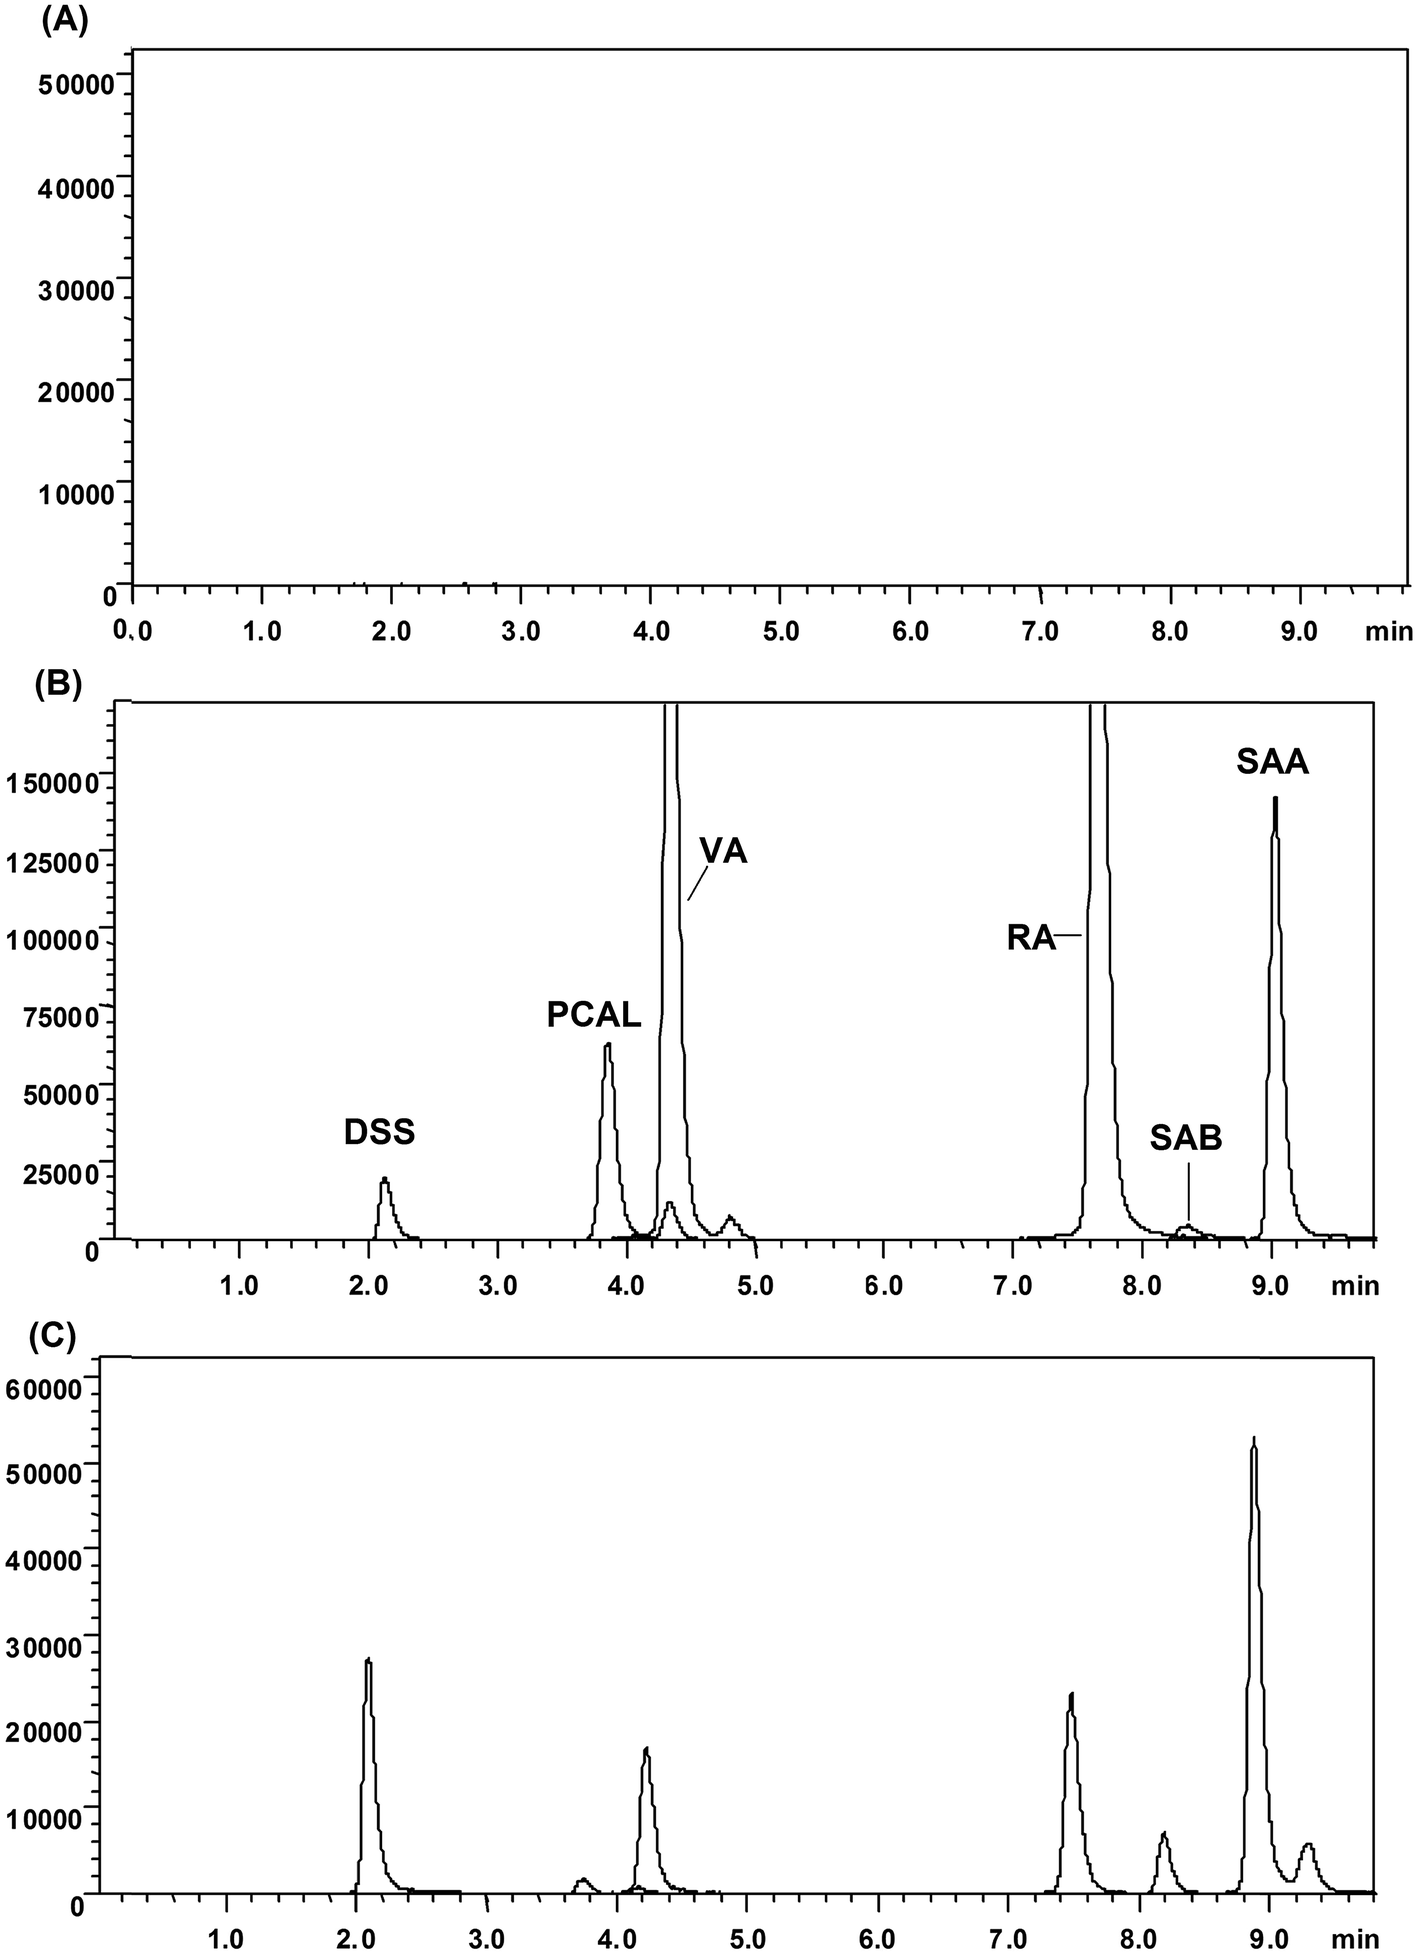 | ||
| Fig. 8 The typical MRM chromatograms of (A) blank plasma, (B) plasma spiked DSS, PCAL, RA, SAB, SAA and VA, and (C) plasma sample at 5 min time point after single i.v. administration of 21 mg kg−1 dose Danshen injection in rats. | ||
The plasma drug concentration–time profiles of DSS, PCAL, RA, SAB and SAA after a single i.v. administration of 21 mg kg−1 Danshen injection are shown in Fig. 9. The respective pharmacokinetic parameters are listed in Table 2. The results showed that DSS and PCAL were eliminated quickly (t1/2β <0.2 h), whereas RA and SAB and SAA were eliminated relatively slowly (t1/2β > 0.6 h) in rat blood. In particular, in comparison with the values of AUC(0–t) or AUC(0–∞), the systematic exposures of rats to DSS and SAA were significantly higher than to the other three phenolic acids (P < 0.05). According to the pharmacokinetic profiles, the main phenolic acids could be classified into two types in rats: one is the rapid elimination type, including DSS and PCAL; another is the relatively slow elimination type containing RA, SAA and SAB; and DSS and SAA could be considered as markers for representing PK characteristics of the two types of phenolic acids due to their high systematic exposure level. Meanwhile, considering the strong anti-MI effect of SAA in vivo, the above-mentioned PK results further confirm that selecting SAA as a reference in the next CL integrated PK study is reasonable.
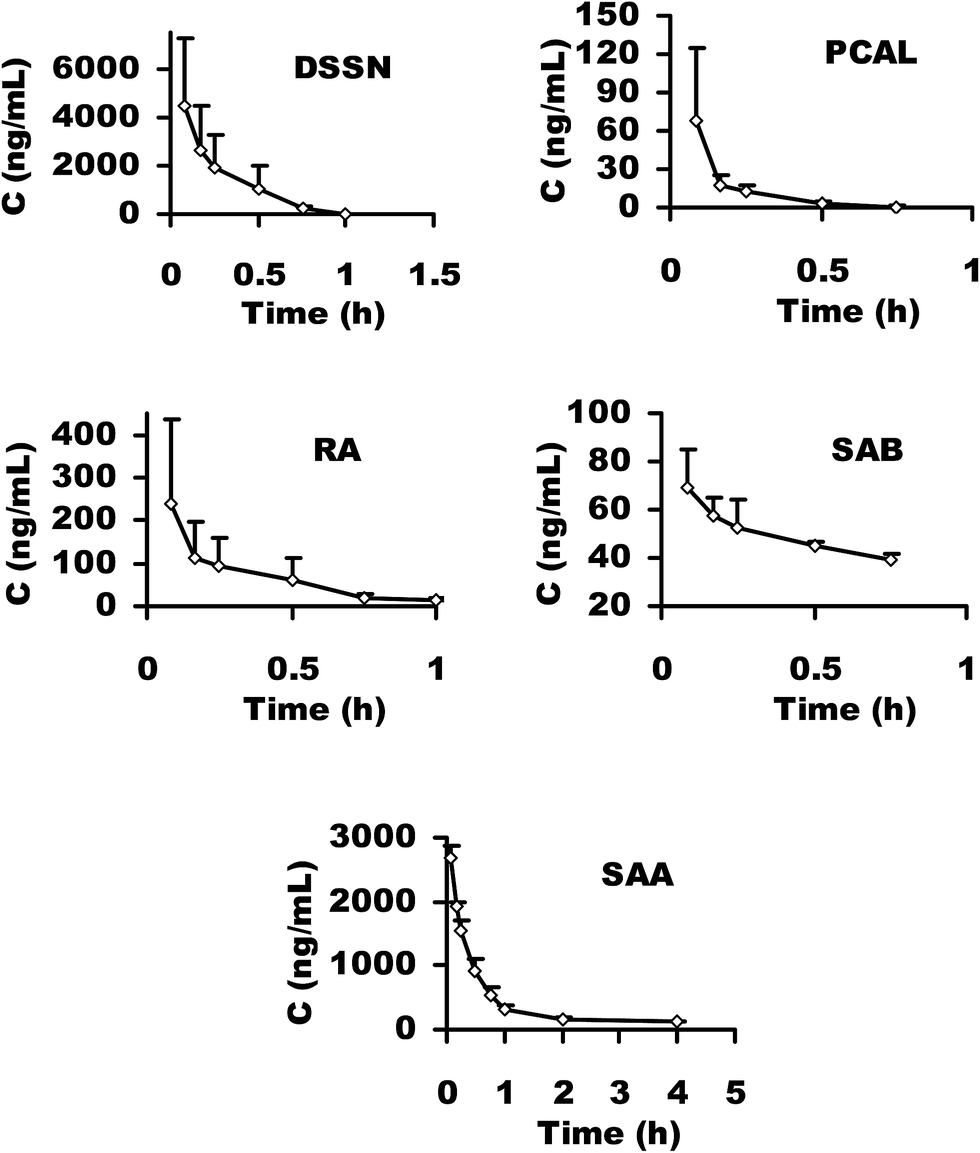 | ||
| Fig. 9 Plasma drug concentration–time profiles of DSSN, PCAL, RA, SAB and SAA after a single i.v. administration of 21 mg kg−1 Danshen injection to rats (mean ± SD, n = 3). | ||
| Parameters | DSS | PCAL | RA | SAB | SAA |
|---|---|---|---|---|---|
| a *P < 0.05 vs. PCAL, RA and SAB. | |||||
| k (h−1) | 6.30 ± 2.49 | 6.90 ± 1.52 | 0.21 ± 0.05 | 0.55 ± 0.44 | 0.50 ± 0.27 |
| t1/2β (h) | 0.12 ± 0.05 | 0.10 ± 0.02 | 3.45 ± 0.73 | 1.76 ± 0.96 | 1.63 ± 0.67 |
| AUC(0–t) (mg h L−1) | 1.54 ± 1.02* | 0.02 ± 0.02 | 0.11 ± 0.08 | 0.04 ± 0.01 | 1.64 ± 0.28* |
| AUC(0–∞) (mg h L−1) | 1.57 ± 1.02* | 0.02 ± 0.02 | 0.15 ± 0.08 | 0.14 ± 0.06 | 1.93 ± 0.38* |
| Vd (L) | 0.42 ± 0.29 | 1.84 ± 1.01 | 3.78 ± 2.01 | 0.13 ± 0.03 | 0.37 ± 0.10 |
| Cltot (L h−1) | 2.32 ± 1.70 | 13.66 ± 9.64 | 0.75 ± 0.31 | 0.64 ± 0.33 | 0.17 ± 0.04 |
| MRT(0–t) (h) | 0.19 ± 0.05 | 0.10 ± 0.04 | 0.65 ± 0.26 | 0.33 ± 0.01 | 0.72 ± 0.24 |
| MRT(0–∞) (h) | 0.20 ± 0.07 | 0.11 ± 0.04 | 3.01 ± 1.16 | 2.48 ± 1.30 | 1.47 ± 0.61 |
Integrated PK study of multiple components of Danshen injection
For CL integrated PK analysis by the KIO4–luminol CL reaction, the method was validated by assessing linearity, precision and recovery, with SAA as a reference.Calibration standards in double-distilled water at concentrations of 1, 5, 10, 50, 100, 500 and 1000 ng mL−1 were prepared with SAA stock solution (1.0 mg mL−1) and assayed on 3 consecutive days. The calibration curves were generated by plotting the relative CL intensity (ΔI) versus the concentration of the calibration standards (C) by the linear regression. The limit of quantification (LOQ) in double-distilled water was defined as the lowest concentration on the calibration curves. The calibration curves showed good linearity in the range of 1–1000 ng mL−1. Representative regression equations for the calibration curves were ΔI = 626.8lnC + 111.8 (r = 0.991) in the range of 1–50 ng mL−1 and ΔI = 218.4lnC + 1914 (r = 0.956) in the range of 50–1000 ng mL−1. The LOQ for SAA equivalent value of total phenolic acids was proved to be 0.5 ng mL−1. In order to validate the intra-day accuracy and precision, quality control (QC) samples (containing 2, 200 and 800 ng mL−1 of SAA in double-distilled water) were prepared and analyzed on the same day (n = 6). To validate the inter-day accuracy and precision and the intra-day accuracy and precision, the assay was repeated on three consecutive days. The results were expressed by averaged measured concentration ± SD and the precision was expressed by relative standard deviation (RSD) of measured concentrations at each QC level, respectively. As shown in Table 3, the results showed that the precision and accuracy of this method were acceptable. The recoveries of the spiked SAA (2, 200 and 800 ng mL−1) in 200 ng mL−1 Danshen injection sample solution (dissolving 400 mg of Danshen freeze-dried powder in water and diluting into 200 ng mL−1 with double-distilled water according to the labeled total phenolic acids content, 400 mg per bottle) were determined by the presented CL method. As can be seen in Table 4, the results showed that the recoveries were acceptable with SAA as a reference for CL integrated PK analysis of total phenolic acids in vitro.
| SAA concentration (ng mL−1) | Intra-day (n = 6) | Inter-day (n = 3) | ||
|---|---|---|---|---|
| Detected (ng mL−1) | RSD (%) | Detected (ng mL−1) | RSD (%) | |
| 2 | 1.85 ± 0.27 | 14.32 | 1.96 ± 0.38 | 19.39 |
| 200 | 211.33 ± 14.54 | 6.89 | 225.32 ± 20.20 | 8.97 |
| 800 | 812.45 ± 58.97 | 7.26 | 745.70 ± 174.38 | 16.38 |
| Original SAA equivalent content in 200 ng mL−1 total phenolic acids solution (ng mL−1) | Spiked SAA concentration (ng mL−1) | Detected mean (ng g−1) | Recovery mean (%) | RSD (%) (n = 3) |
|---|---|---|---|---|
| 50.38 | 2 | 53.14 | 138.0 | 13.83 |
| 200 | 261.57 | 100.6 | 11.52 | |
| 800 | 814.53 | 95.5 | 18.96 |
For CL integrated PK analysis, a series of simulation plasma drug mixture solutions containing the main five phenolic acids, DSS, PCAL, RA, SAB and SAA, were prepared in water and their concentration levels were kept consistent with those in rat plasma at the studied PK time points after a single i.v. administration of 21 mg kg−1 Danshen injection to rats. The typical FI-CL spectrogram is shown in Fig. 10. The CL integrated concentration–time curve is shown in Fig. 11. The PK parameters are calculated and listed in Table 5. These results suggested that after administration of the Danshen injection the plasma level of total phenolic acids decreased at a moderate rate, indicated by the favorable t1/2β (∼100 min) and Cltot (0.4–0.77 L h−1). The Vd value was low, also suggesting total phenolic acids were mainly distributed in the hematological system. Further, the total concentrations of the five phenolic acids in rat plasma were calculated by the “plasma drug concentration sum method” and the “AUC weighting integrated method”1,2,8 at the studied PK time points, respectively. The resulting integrated plasma drug concentration–time curves and PK parameters are also shown in Fig. 11 and Table 5, respectively. There are no significant differences for almost all the PK parameters between the CL integrated method, plasma drug concentration sum method, and AUC weighting integrated method except for AUC(0–t) and AUC(0–∞). The values of AUC(0–t) and AUC(0–∞) from the CL integrated method are similar to those from the plasma drug concentration sum method, but higher than those from the AUC weighting integrated method. Without doubt, these results from the CL integrated method not only present the total concentration information of the main phenolic acids and their whole PK profiles, but also very well reflect the PD properties of phenolic acids after i.v. administration of Danshen injection. Interestingly, the PK parameters k and t1/2β for SAA or SAB are similar to those from the CL integrated method, the plasma drug concentration sum method and the AUC weighting integrated method. Anyway, considering its excellent anti-MI effect in vivo, high content in preparation and favorable PK properties, selecting SAA as a PK marker for representing the whole PK characteristics is also reasonable and reliable.
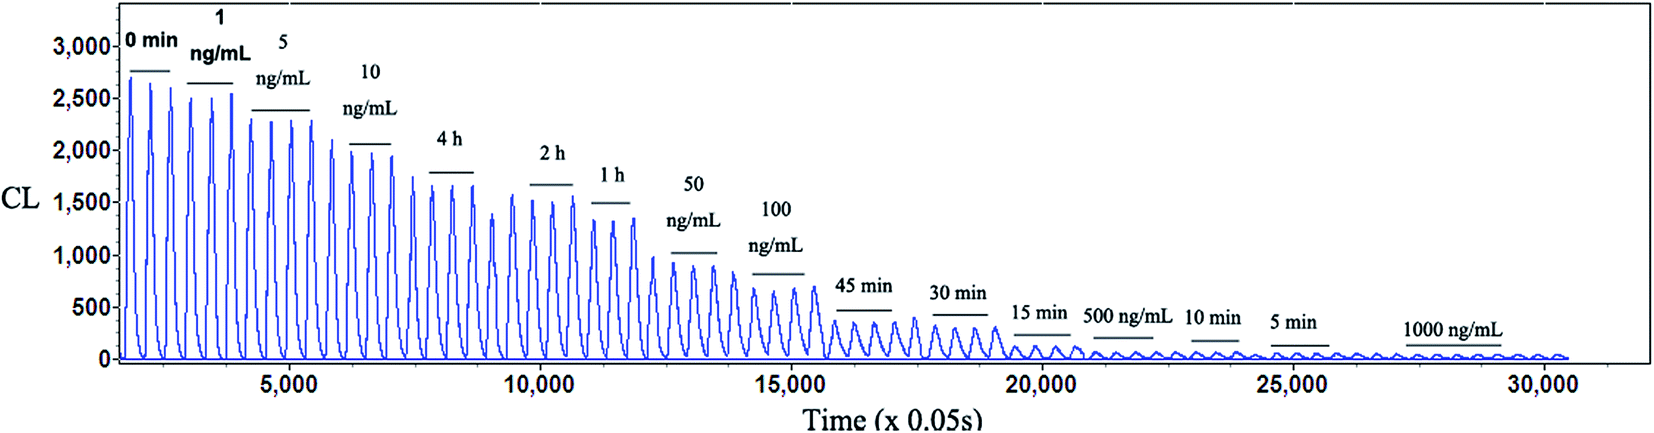 | ||
| Fig. 10 The typical FI-CL spectrogram for the CL integrated PK analysis of Danshen injection. 0, 5, 10, 15, 30, 45 min and 1, 2, 4 h in the graph indicate the CL signals responding to the simulation plasma drug mixture solutions at the relative PK time points after a single i.v. administration of 21 mg kg−1 Danshen injection to rats. 1, 5, 10, 50, 100, 500 and 1000 ng mL−1 indicate the CL signals responding to the SAA reference solutions at the relative concentrations, respectively. | ||
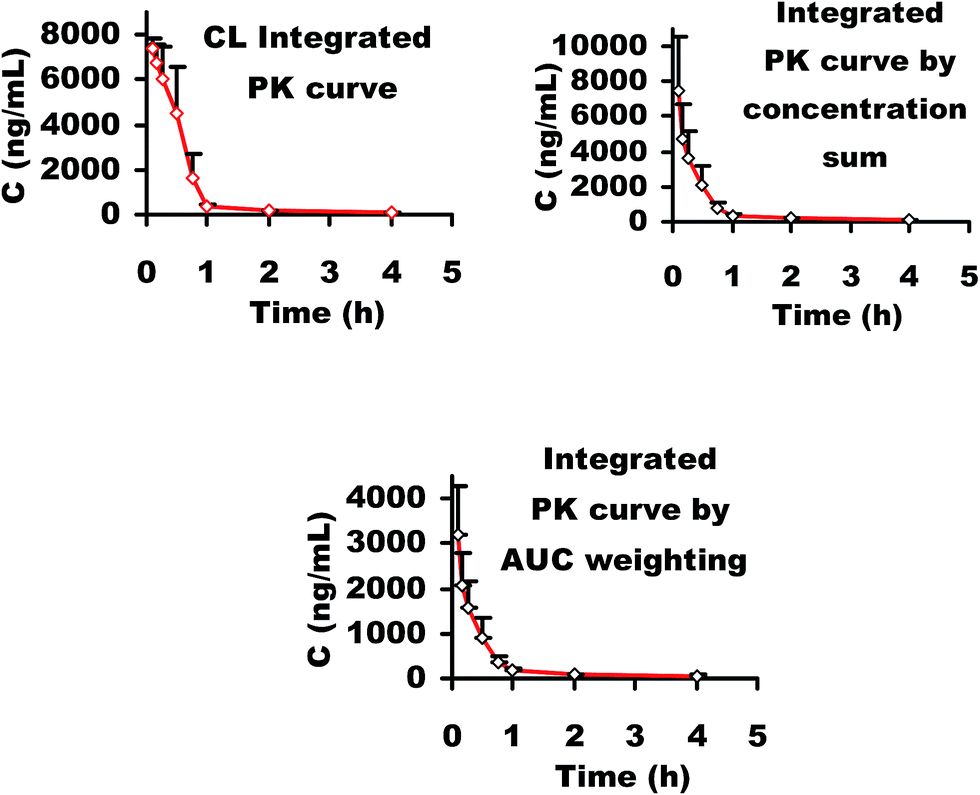 | ||
| Fig. 11 The integrated plasma phenolic acids concentration–time curve by the presented CL integrated, plasma drug concentration sum and AUC weighing integrated methods after a single i.v. administration of 21 mg kg−1 dosage Danshen injection (mean ± SD, n = 3). | ||
| Parameters | CL integrated methoda | Concentration sum methodb | AUC weighting integrated methodc |
|---|---|---|---|
| a By the presented CL method, the determined SAA equivalent dose is 11.45 mg kg−1 for the studied phenolic acids, when administrating a 21 mg kg−1 dose of Danshen injection to rats.b For the plasma drug concentration sum method, the calculated total dose is 13.18 mg kg−1 for the studied phenolic acids, when administrating a 21 mg kg−1 dose of Danshen injection to rats.c For the AUC weighting integrated method, the calculated total dose is 4.57 mg kg−1 for the studied phenolic acids, when administrating a 21 mg kg−1 dose of Danshen injection to rats. *P < 0.05 vs. the values from the AUC weighting integrated method. | |||
| k (h−1) | 0.58 ± 0.33 | 0.53 ± 0.31 | 0.52 ± 0.29 |
| t1/2β (h) | 1.63 ± 1.21 | 1.59 ± 0.71 | 1.59 ± 0.68 |
| AUC(0–t) (mg h L−1) | 4.54 ± 1.31* | 3.36 ± 1.38 | 1.48 ± 0.54 |
| AUC(0–∞) (mg h L−1) | 4.82 ± 1.50* | 3.66 ± 1.48 | 1.63 ± 0.59 |
| V (L) | 1.14 ± 0.53 | 1.98 ± 0.48 | 1.63 ± 0.36 |
| CL (L h−1) | 0.56 ± 0.19 | 0.98 ± 0.43 | 0.80 ± 0.32 |
| MRT(0–t) (h) | 0.45 ± 0.11 | 0.47 ± 0.12 | 0.51 ± 0.13 |
| MRT(0–∞) (h) | 0.78 ± 0.44 | 0.90 ± 0.31 | 0.98 ± 0.33 |
In summary, it is the first time that an integrated PK and PD study for cardiovascular herbal medicine has been implemented simultaneously by a reasonable and reliable means. Also, the results from the CL integrated PK method for Danshen injection are helpful for the further integrated PK study on human beings.
Conclusion
In this paper, for the first time, a strategy was put forward for simultaneously and conveniently indicating integrated PK and PD properties of cardiovascular herbal medicines with antioxidants as the main effective substances, based on the KIO4–luminol CL reaction. Taking Danshen injection as a carrier, the feasibility and efficacy of the presented strategy were validated very well. In our opinion, the present effort provides a feasible strategy for PK analysis of cardiovascular herbal medicines with antioxidants as the main effective substances.Acknowledgements
This work was supported by the National Nature Science Foundation of China (No. 81303298 and 81202987), the Fujian Provincial Natural Science Foundation (No. 2014J07009 and 2016J01371), Program for New Century Excellent Talents in Fujian Province University (No. JA14128), the Medical Elite Cultivation Program of Fujian (No. 2013-ZQN-JC-25 and 2016-ZQN-63) and the Fujian Agriculture and Forestry University Foundation for excellent youth teachers (No. xjq201414).References
- H. P. Hao, C. N. Zheng and G. J. Wang, Acta Pharmacol. Sin., 2009, 44, 270–275 Search PubMed.
- X. Y. Li, H. P. Hao and G. J. Wang, Chin. J. Nat. Med., 2008, 6, 377–381 CrossRef CAS.
- H. F. Liu, J. L. Yang, F. F. Du, X. M. Gao, X. T. Ma, Y. H. Huang, F. Xu, W. Niu, F. Q. Wang, Y. Mao, Y. Sun, T. Lu, C. X. Liu, B. L. Zhang and C. Li, Drug Metab. Dispos., 2009, 37, 2290–2298 CrossRef CAS PubMed.
- T. Lu, J. L. Yang, X. M. Gao, P. Chen, F. F. Du, Y. Sun, F. Q. Wang, F. Xu, H. C. Shang, Y. H. Huang, Y. Wang, R. Z. Wan, C. X. Liu, B. L. Zhang and C. Li, Drug Metab. Dispos., 2008, 36, 1578–1586 CrossRef CAS PubMed.
- T. Yi, L. Zhu, Y.-N. Tang, J.-Y. Zhang, Z.-T. Liang, J. Xu, Z.-Z. Zhao, Z.-L. Yu, Z.-X. Bian, Z.-J. Yang and H.-B. Chen, J. Ethnopharmacol., 2014, 153, 701–713 CrossRef CAS PubMed.
- W. He, G. H. Liu, H. Cai, X. M. Sun, W. E. Hou and P. T. Zhang, J. Ethnopharmacol., 2014, 154, 635–644 CrossRef CAS PubMed.
- Z. T. Ma, X. W. Yang, Y. Zhang and J. X. Liu, J. Asian Nat. Prod. Res., 2014, 16, 483–496 CrossRef CAS PubMed.
- L. M. Pan, J. Zhou, H. X. Zhu, W. Z. Wang, M. Zhang, X. R. Tian and J. Lu, Am. J. Chin. Med., 2014, 42, 393–407 CrossRef CAS PubMed.
- Y.-N. Tang, X.-C. He, M. Ye, H. Huang, H.-L. Chen, W.-L. Peng, Z.-Z. Zhao, T. Yi and H.-B. Chen, J. Ethnopharmacol., 2015, 175, 451–455 CrossRef CAS PubMed.
- P. Y. Shi, X. H. Lin and H. Yao, Xenobiotica, 2015, 45, 999–1008 CrossRef CAS PubMed.
- S. F. Yang, P. Y. Shi, X. M. Huang, M. F. Zhao, S. G. Li, Y. J. Wu, X. H. Lin and H. Yao, Planta Med., 2016, 82, 217–223 CAS.
- X. Y. Li, J. G. Sun, G. J. Wang, H. P. Hao, Y. Liang, Y. T. Zheng, B. Yan and L. S. Sheng, Biomed. Chromatogr., 2007, 21, 735–746 CrossRef CAS PubMed.
- L. J. Li, X. W. Zhou, N. Li, M. Sun, J. X. Lv and Z. C. Xu, Drug Discovery Today, 2015, 20, 1074–1086 CrossRef PubMed.
- E. L. Schiffrin, Mol. Interventions, 2010, 10, 354–362 CrossRef PubMed.
- J. Luo, W. J. Song, G. Y. Yang, H. Xu and K. J. Chen, Am. J. Chin. Med., 2015, 43, 25–43 CrossRef PubMed.
- L. Liu, J. A. Duan, Y. P. Tang, J. M. Guo, N. Y. Yang, H. Y. Ma and X. Q. Shi, J. Ethnopharmacol., 2012, 139, 381–387 CrossRef CAS PubMed.
- C. Y. Dou, X. M. Qin, H. H. Dong, J. Zhang, X. Q. Guo and L. Z. Zhang, Chin. J. Hosp. Pharm., 2009, 29, 1846–1849 CAS.
- R. Yin, X. H. Chen, F. Han, Z. D. Shen, W. M. Cheng and K. S. Bi, Chromatographia, 2008, 67, 961–965 CAS.
- R. Yin, F. Han, Z. Tang, R. Liu, X. Zhao, X. H. Chen and K. S. Bi, J. Pharm. Biomed. Anal., 2013, 72, 127–133 CrossRef CAS PubMed.
- X. Y. Zeng, M. Y. Lu, C. H. Yang and K. Lan, Chin. J. Hosp. Pharm., 2005, 25, 1122–1124 CAS.
- J. L. Zhang, M. Cui, Y. He, H. L. Yu and D. A. Guo, J. Pharm. Biomed. Anal., 2005, 36, 1029–1035 CrossRef CAS PubMed.
- W. R. Chai, W. H. Zhang, Z. Jin, Y. Q. Zheng, P. Y. Jin, Q. Y. Zhang and J. M. Zhi, Lett. Drug Des. Discovery, 2012, 9, 967–972 CrossRef CAS.
- M. Kobori, Y. Takahashi, Y. Akimoto, M. Sakurai, L. Matsimaga, H. Nishimuro, K. Ippoushi, H. Oike and M. Ohnishi-Kameyama, J. Funct. Foods, 2015, 15, 551–560 CrossRef CAS.
- S. B. Wang, J. Y. Jang and Y. H. Chae, Free Radical Biol. Med., 2015, 83, 41–53 CrossRef CAS PubMed.
- L. Xue, Z. Wu, X. P. Ji, X. Q. Gao and Y. H. Guo, Asian Pac. J. Trop. Med., 2014, 7, 280–284 CrossRef CAS PubMed.
- H. Yao, B. Wu, Y. Y. Cheng and H. B. Qu, Food Chem., 2009, 115, 380–386 CrossRef CAS.
- M. Liu, X. H. Xia, Z. M. Zhang, Z. J. Wu and S. Y. Pan, J. Chin. Mater. Med., 2009, 32, 265–267 CAS.
- P. Li, J. G. Ren, C. L. Duan, C. R. Lin and J. X. Liu, Pharmacol. Clin. Chin. Mater. Med., 2009, 25, 29–33 CAS.
- S. B. Wang, S. Tian, F. Yang, H. G. Yang, X. Y. Yang and G. H. Du, Eur. J. Pharmacol., 2009, 615, 125–132 CrossRef CAS PubMed.
- Y. Cheng, H. He, Y. C. Chen, L. H. Huang, Q. Si and X. Q. Liu, Chin. J. Inf. Tradit. Chin. Med., 2011, 42, 255–261 CAS.
- Q. T. Song, X. Chu, X. Zhang, Y. F. Bao, Y. Y. Zhang, H. Guo, Y. Liu, H. Y. Liu, J. P. Zhang, Y. Zhang and L. Chu, J. Ethnopharmacol., 2016, 189, 157–164 CrossRef CAS PubMed.
- Z. R. Lin, C. Chen, D. K. Tian, Q. Gu, S. F. Qu, A. H. Ruan and D. J. Sun, Lishizhen Med. Mater. Med. Res., 2011, 22, 412–414 Search PubMed.
- Y. P. Song, L. S. Kong, J. Wu, A. R. Miao and G. Zhao, J. Tradit. Chin. Med., 2007, 14, 36–38 Search PubMed.
- J. X. Yang and J. J. Zhang, J. Mol. Cell. Cardiol., 2007, 42, S192–S193 CrossRef.
- G. Wei, Y. Guan, Y. Yin, J. L. Duan, D. Zhou, Y. R. Zhu, W. Quan, M. M. Xi and A. D. Wen, Inflammation, 2013, 36, 592–602 CrossRef CAS PubMed.
- W. Quan, D. Zhou, C. Guo, Y. H. Wang, Y. R. Zhu, Y. Guan, M. M. Xi and A. D. Wen, Cent. South Pharm., 2012, 10, 885–888 CAS.
- K. W. Huang, W. F. Zhu, N. Su, J. W. Guo, Z. J. Deng, W. W. Wu, D. W. Hao and X. J. Lu, Eval. Anal. Drug-Use Hosp. China, 2009, 9, 449–452 Search PubMed.
- Y. Cao, J. Wang, G. Z. Su, Y. Wu, R. F. Bai, Q. Zhang, X. L. Gao, C. Li, S. Y. L. Chen, P. F. Tu and X. Y. Chai, J. Ethnopharmacol., 2016, 187, 259–268 CrossRef CAS PubMed.
Footnotes |
| † Electronic supplementary information (ESI) available. See DOI: 10.1039/c7ra00001d |
| ‡ These authors contributed equally to this work. |
| This journal is © The Royal Society of Chemistry 2017 |