
 Open Access Article
 This Open Access Article is licensed under a
 Creative Commons Attribution 3.0 Unported Licence
Ultrahigh protein adsorption capacity and sustained release of nanocomposite scaffolds: implication for growth factor delivery systems†
Ji-Young Yoonab,
Jung-Ju Kimab,
Ahmed El-Fiqiab,
Jun-Hyeog Jangc and
Hae-Won Kim *abd
*abd
aInstitute of Tissue Regeneration Engineering (ITREN), Dankook University, Cheonan 330-714, Republic of Korea. E-mail: kimhw@dku.edu; Fax: +82 41 550 3085; Tel: +82 41 550 3081
bDepartment of Nanobiomedical Science & BK21 PLUS NBM Global Research Center for Regenerative Medicine, Dankook University, Cheonan, Republic of Korea
cDepartment of Biochemistry, Inha University School of Medicine, Incheon 400-712, Republic of Korea
dDepartment of Biomaterials Science, College of Dentistry, Dankook University, Cheonan, Republic of Korea
First published on 14th March 2017
Abstract
Scaffolds that can load and deliver growth factors are promising for the regeneration of tissues. High loading and long-term delivery of the molecules are generally considered key aspects in optimizing the therapeutic outcome of the growth factor-delivering scaffolds. Here we report nanocomposite scaffolds incorporating nanoparticles that have exceptionally high capacity to load proteins/growth factors and release them in a sustainable manner. Bioactive glass nanoparticles (BGn) in a mesoporous form were added to a degradable polymer (polylactic acid; PLA) up to 200% (BGn/PLA by weight), which was formed into highly porous scaffolds. The specific surface area and hydrophilicity of the scaffolds were significantly enhanced by BGn incorporation. The BGn/PLA scaffolds adsorbed proteins at high quantities with respect to pure PLA scaffolds, ∼20 times for cytochrome C and ∼5 times for lysozyme, and the protein adsorption was largely charge-dependent (i.e., selectively adsorbed positively-charged proteins due to a negatively-charged BGn). The loaded protein was released from the BGn/PLA scaffolds in a highly sustainable manner over weeks, which was contrasted to the abrupt protein release (almost complete within one week) observed in pure PLA scaffolds. Fibroblast growth factor 2 (FGF2) was used as the representative growth factor that was involved in cell mitosis and tissue repair for biological efficacy. The FGF2 release continued over 4 weeks with an almost linear release pattern after the initial 3 days. The scaffolds that release FGF2 slowly demonstrated significantly stimulated proliferation of mesenchymal stem cells with respect to those without FGF2, with continuous biological effects over 3 weeks. The BGn/PLA nanocomposite scaffolds, proven to be effective in loading specific growth factors at high quantity and delivering sustainably over weeks to months, may be potentially useful in tissue repair and regeneration processes.
1. Introduction
Scaffolds have been developed to repair and regenerate damaged and diseased tissues including bone.1–3 Bone scaffolds support the anchorage and growth of osteoprogenitor/stem cells, and enable their differentiation into a bone forming cells.4–6 The properties of scaffolds including surface chemistry, pore structure and mechanical rigidity govern the fate of cells, and ultimately the bone forming ability.1,7,8 Therefore, much effort has been made to tailor the physico-chemical properties of scaffolds that are favorable for bone tissue regeneration.9–11Among these properties, when the scaffolds possess the capacity to load and deliver signalling molecules like growth factors the regeneration potential of damaged bone defects can be significantly improved.12–15 Two main issues to consider in designing growth factor-delivering scaffolds are (i) how much the scaffolds can load the growth factors, and (ii) how sustainably and controllably the scaffolds can release them.
However, for the case of synthetic biopolymer scaffolds, the poor affinity to protein molecules has hampered the loading ability.16–18 Moreover, synthetic route to prepare scaffolds generally involves organic solvents, making it difficult to directly load growth factors. In order to overcome these, several approaches have been used. For example, the surface of scaffolds was modified to favour the adsorption of growth factors.13,17 In a more complicated way, microcapsules or microparticles that load growth factors inside were incorporated within the scaffolds.19,20 Moreover, core–shell techniques were often used to load growth factors.21,22 Along with the loading issue, enabling a sustainable release of growth factors over weeks to even months has not been easily implemented.
Here we report a design of bone scaffolds that can load growth factors at large amount and can release them for a long-term period. The introduction of mesoporous bioactive glass nanoparticles (BGn) to a biopolymer poly (lactic acid) (PLA) matrix is shown to improve the ability significantly. The added BGn are also considered to stimulate cellular responses such as osteogenesis and angiogenesis through the release of Ca and Si ions as have been previously documented.23–26 Therefore, the BGn have recently been used as the nanocomponent of polymer-based scaffolds.27–29 As the polymeric component here we chose PLA because it is degradable and has excellent biocompatibility,30,31 and thus has been widely developed as nanocomposites with other bioactive inorganic particles.32–34 The loading capacity and release profile of the BGn/PLA scaffolds are studied using different kinds of model proteins, and the effects of the sustained release on cellular functions are investigated using target growth factors relevant for tissue repair process.
2. Experimental procedures
2.1. Materials
Tetraethyl orthosilicate (TEOS, C8H2O4Si, 98%, Sigma-Aldrich), calcium nitrate tetrahydrate (Ca(NO3)2·4H2O, 99%, Sigma-Aldrich), hexadecetyltrimethyl ammonium bromide (CTAB, C19H42BrN ≥ 98%, Sigma-Aldrich), ammonium hydroxide (NH4OH, 28.0% NH3 in water ≥ 99.99% metal basis), anhydrous methanol (CH4O, 99.8%, Sigma-Aldrich), 1,4-dioxane (C4H8O2, Sigma), chloroform (CHCl3, Dae-Jung), sodium chloride (NaCl, Dae-Jung) were used as-received. Poly-L/D-lactide acid (PLA; LESOMER@LR708, L-lactide![[thin space (1/6-em)]](https://www.rsc.org/images/entities/char_2009.gif) :D,L-lactide molar ratio = 70:30, Mn = 910000) was purchased from Evonic. Micro BCA™ Protein assay kit were obtained from Thermo scientific, and cell counting kit-8 (CCK-8) was purchased from Dojin molecular technologies, INC. Proteins used were cytochrome C from bovine heart (Cyt C, C2037, Sigma), lysozyme form chicken egg white (Lysozyme, 62971, Sigma), and bovine serum albumin (BSA, BAH68, EQUITECH-BIO, INC.).
:D,L-lactide molar ratio = 70:30, Mn = 910000) was purchased from Evonic. Micro BCA™ Protein assay kit were obtained from Thermo scientific, and cell counting kit-8 (CCK-8) was purchased from Dojin molecular technologies, INC. Proteins used were cytochrome C from bovine heart (Cyt C, C2037, Sigma), lysozyme form chicken egg white (Lysozyme, 62971, Sigma), and bovine serum albumin (BSA, BAH68, EQUITECH-BIO, INC.).
2.2. Synthesis of mesoporous bioactive glass nanoparticles
Mesoporous bioactive glass nanoparticles based on 85% SiO2–15% CaO molar composition were prepared by sonochemical sol–gel method using CTAB as mesostructure template.35,36 Briefly, 13.72 mmol of CTAB and 0.76 mmol of Ca (NO3)2·4H2O were solubilized in 120 mL of anhydrous methanol and the pH was then adjusted to 12.5 using NH4OH. Another 4.3 mmol of TEOS was diluted with 30 mL of anhydrous methanol and then added dropwise to the solution with vigorous stirring and ultrasonication for 20 min. After 24 h stirring, the formed precipitate was separated and washed with water/ethanol by cyclic centrifugation/redispersion (5000 rpm for 5 min) and then dried at 70 °C overnight. The powder was heat-treated at 600 °C for 5 h under air flow. The prepared nanoparticles were stored under vacuum for further uses.2.3. Fabrication of BGn/PLA nanocomposite scaffolds
For the preparation of BGn/PLA nanocomposite scaffolds, BGn were first homogenized in a co-solvent (chloroform and 1,4-dioxane at 1:4 v/v) by ultrasonication for 5 min at room temperature, within which 3% w/v PLA was dissolved while stirring (BGn% relative to PLA was set at 0, 50, 100, and 200% w/w). The solutions were poured to a cylindrical plastic mould (5 mm diameter) with NaCl particles (sizes selected between 200–500 μm) packed, which were used as a porogen of scaffolds. The samples were then freezed to −20 °C and freeze-dried at −120 °C for 3 days to remove the co-solvent. The scaffolds were cut (5 mm diameter × 3 mm height), and the NaCl particles were completely leached out in distilled water and then dried until further uses.
2.4. Characterizations
The morphology, mesoporous structure and size of the nanoparticles were observed by high-resolution transmission electron microscopy (HR-TEM, JEM-3010, JEOL, Japan). The particle size distribution was determined from TEM images (n ≈ 200 particles) by Image J software (NIH). The surface charge of nanoparticles at different pH values was measured by zeta (ζ) potential measurements using a laser doppler electrophoresis instrument (Zetasizer Nano ZS, Malvern Instruments, UK). The ζ-potential was measured in water at 25 °C with applied field strength of 20 V cm−1, for five measurements. The instrument automatically calculates the electrophoretic mobility (U), and the ζ-potential is obtained according to the Helmholtz–Smoluchowsky equation: ζ = Uη/ε, where η is the dispersing medium viscosity and ε is the dielectric constant.The specific surface area (m2 g−1) of the scaffolds was measured by Brunauer–Emmett–Teller (BET) method using surface area analyzer (Micromeritics, 3Flex). The morphology of the scaffold and presence of BGn were observed by field emission scanning electron microscope (FE-SEM, S-4300, JEOL). A mercury porosimeter (PM33, Quantachrome) was used to measure the porosity of the scaffolds. BGn component in the scaffold was detected by energy dispersive X-ray spectroscopy (EDX, Bruker) and Fourier transform-infrared spectroscopy (FTIR; 640-IR, Varian) was used to evaluate the chemical functional groups and possible interactions between BGn and polymer.
2.5. Protein loading and release tests
For the loading of proteins, Cyt C was used as the model protein. Each scaffold of 6 mg (0, 50, 100, and 200% BGn) was immersed in 1 mL aqueous solution (distilled water) containing 100 μg mL−1 Cyt C for 24 h at room temperature to access the protein's release behavior, while physically rotating (Multi mixer, SLRM-3, SeouLin Bioscience) the solution at F4 mode and 15 rpm. When the Cyt C was completely loaded additional solutions (100 μg mL−1 Cyt C) were also used to load onto the scaffolds (particularly 100 and 200% BGn). The supernatant was collected at different time points (1, 3, 7, 14, 21 and 28 days) and assayed by using BCA assay kit. The loaded amount was calculated by the absorbance read at 595 nm using Multi-Detection microplate reader (Molecular devices corporation). Other types of proteins including lysozyme and BSA were also tested using 100% BGn scaffolds to investigate the effect of different charges of proteins. Three replicate samples were tested for each condition (n = 3).The release behavior of Cyt C from the scaffolds was measured by immersing each scaffold in 1 mL D.W. while rotating at 15 rpm. At each test period (1, 3, 7, 14, 21, and 28 days), the supernatant was collected to measure an absorbance at 595 nm. The medium was refreshed every run.
2.6. FGF2 loading and release
For the study of growth factor, recombinant form of FGF2 tagged with green fluorescent protein (FGF2-GFP) was prepared as described elsewhere.37 FGF2 (40 μg mL−1 in sterilized phosphate buffered saline) was loaded onto each scaffold of 2 mg for 24 h while gentle shaking (Digital reciprocating shaker, SHR-1D, DAIHAN scientific) at room temperature in dark. The supernatant was collected and the fluorescence intensity was measured using Multi-Detection microplate reader (Molecular devices corporation), which gave a complete loading of FGF2. The release of FGF2 from the scaffolds was then examined by immersing in 1 mL PBS (pH 7.4) while shaking. At predetermined time points (3, 7, 14, and 28 days), the supernatant was collected and the fluorescence intensity was analysed. The medium was refreshed in every run, and three replicate samples were tested for each condition (n = 3).2.7. Mesenchymal stem cell (MSC) culture and proliferation
The effects of FGF2 release on the biological outcome were examined by the proliferation of MSCs. MSCs derived from bone marrow of rats (Sprague Dawley, 5 weeks, from Dayun, South Korea) were used, and the isolation and culture protocols were described in previous reports.38,39 Cells were incubated in a growth medium made of α-Minimal Essential Medium (α-MEM, Gibco), supplemented with 10% fetal bovine serum (FBS, from Corning), and 1% penicillin (P/S) at 37 °C in a humidified atmosphere containing 5% CO2. The medium was changed every 2 days.The cellular toxicity of the nanocomposite scaffolds was checked by using CCK assay. In brief, 1 × 10⁴ cells were seeded at each well of 24-well plates. Cell culture insert (transparent PET membrane, 24 well, 8.0 μm pore size) containing each scaffold was put into each well, and then cultured up to 7 days. At each time point (1, 3, and 7 days), the cell viability was examined by using a CCK assay kit, according to the manufacturer's instruction.40
The effects of FGF2 release from the scaffolds were then examined. For this, 1 × 10⁴ cells were plated onto each well of 24-well plates and incubated for 24 h. Transwell insert containing the scaffold (100% BGn with or without FGF2, and pure PLA as a control) was then placed in the well and then cultured. The cell proliferation for the initial 3 days was measured by CCK assay. After this, the used scaffold was continuously soaked in a fresh culture medium (w/o cells) for 4 days, and then used for the next run of cell culture while cells were refreshed in every run; resultantly, the effects of FGF2 release for the initial 3 days in every week could be examined using new cells. The assay was conducted up to 3 weeks. Three replicate samples were tested for each condition (n = 3). The cell growth image was observed under optical microscopy (fluorescence microscope, Olympus, IX71).
2.8. Statistics
Data were presented as mean ± standard deviation. Statistical analysis was carried out by one way analysis of variance (ANOVA), and the significance level was considered at p < 0.01.3. Results and discussion
3.1. Production of BGn/PLA nanocomposite scaffolds and properties
For the preparation of nanocomposite scaffolds with PLA, BGn was incorporated as the bioactive nanocomponent. The nano-morphology of BGn was examined by TEM image (Fig. 1a). Spherical nanoparticles with highly mesoporous structure were generated well, and the particles were distributed around 80–110 nm in size (95 nm on average) (Fig. 1b). The ζ-potential of the BGn gradually decreased with increasing pH value, recording −18 mV at pH 7.4, implying the nanoparticles became negatively charged at neutral pH (Fig. 1c). When analysed by BET, BGn showed a high mesoporosity, including pore volume (0.415 cm3 g−1), specific surface area (830 m2 g−1) and pore size (3.2 nm) (Fig. 1d), suggesting the highly mesoporous BGn might be effective in loading biological molecules.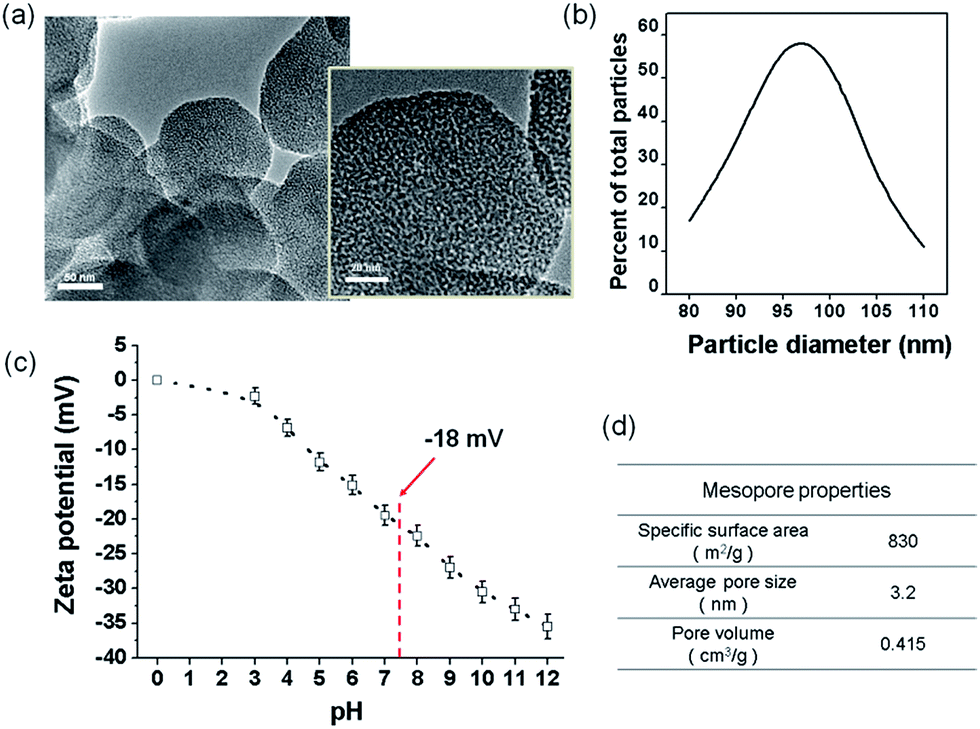 | ||
| Fig. 1 Characteristics of BGn used to produce nanocomposites with PLA. (a) TEM image (low and high magnifications) (b) size distribution. (c) ζ-Potential change with pH (vertical line at pH 7.4 corresponds to −18 mV). (d) Mesopore properties including specific surface area, pore size, and pore volume, as analysed by BET method. | ||
Next, the BGn were incorporated within PLA and a salt-leaching process was introduced to prepare nanocomposite scaffolds. The contents of BGn (with respect to PLA) were varied at 0, 50, 100, and 200% by weight. The morphology of BGn/PLA scaffolds was examined by SEM (Fig. 2a). At low magnification, all the scaffolds showed a similar morphology, i.e., highly porous structure with pore sizes of approximately 200–500 μm. The porosity of scaffolds, as measured by a mercury intrusion porosimeter, showed a similar range of 97.0–98.5% (Fig. 2b). On a closer examination, the presence of BGn in the nanocomposite scaffolds was revealed; aggregated small sized nanoparticles were gathered on the surface, which was contrasted to the smooth surface of pure PLA scaffold. With increasing BGn content in the nanocomposite, more BGn were observed on the surface. The BGn present abundantly on the surface are thought to govern the interface property of the porous scaffolds and, thus, play an important role in the interaction with biological molecules and cells. The EDS analysis of the nanocomposite showed additional peaks corresponding to Si and Ca (along with the peaks of pure PLA scaffold, as shown in ESI in Fig. S1†), and those atomic peak intensities increased gradually with increasing BGn content. The FT-IR spectra of the nanocomposite scaffolds revealed the development of chemical bonds (Si–O–Si at 462 cm−1) associated with BGn in tandem with those of PLA, where the peak intensities also increased as the BGn content increased (Fig. 2c).
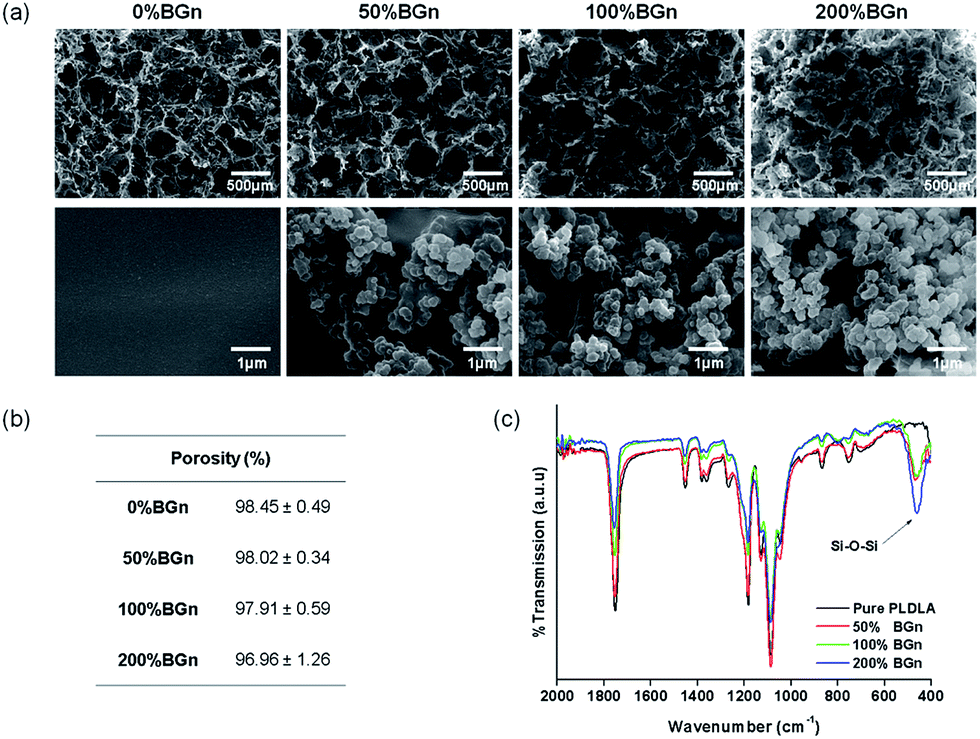 | ||
| Fig. 2 (a) SEM images of BGn/PLA scaffolds with various amounts of BGn at different magnifications. (b) Porosity of scaffolds recorded by a porosimeter. (c) FT-IR spectra of scaffolds. Si–O–Si band related with BGn is noted. | ||
The hydrophilicity and specific surface area of the BGn/PLA scaffolds, the properties considered important for the protein adsorption, were further examined. The contact angle was measured on the scaffolds by a water droplet method (Fig. 3a). Contact angles were recorded to decrease with time up to 60 s on all the scaffolds. The presence of BGn reduced the contact angle significantly at all measured time points. The contact angles recorded were 68° (pure PLA) ∼ 68° (50% BGn) > 56° (100% BGn) > 46° (200% BGn) initially, and 65° (pure PLA) > 58° (50% BGn) > 45° (100% BGn) > 31° (200% BGn) after 60 s. The results demonstrate that the BGn incorporation enables the hydrophobic biopolymer scaffolds to be highly hydrophilic, which signifies the possible rapid water permeation into the BGn/PLA scaffolds in aqueous solutions. Representative images of water droplets on each scaffold sample support the rapid soaking of water in the BGn-incorporated nanocomposite scaffolds.
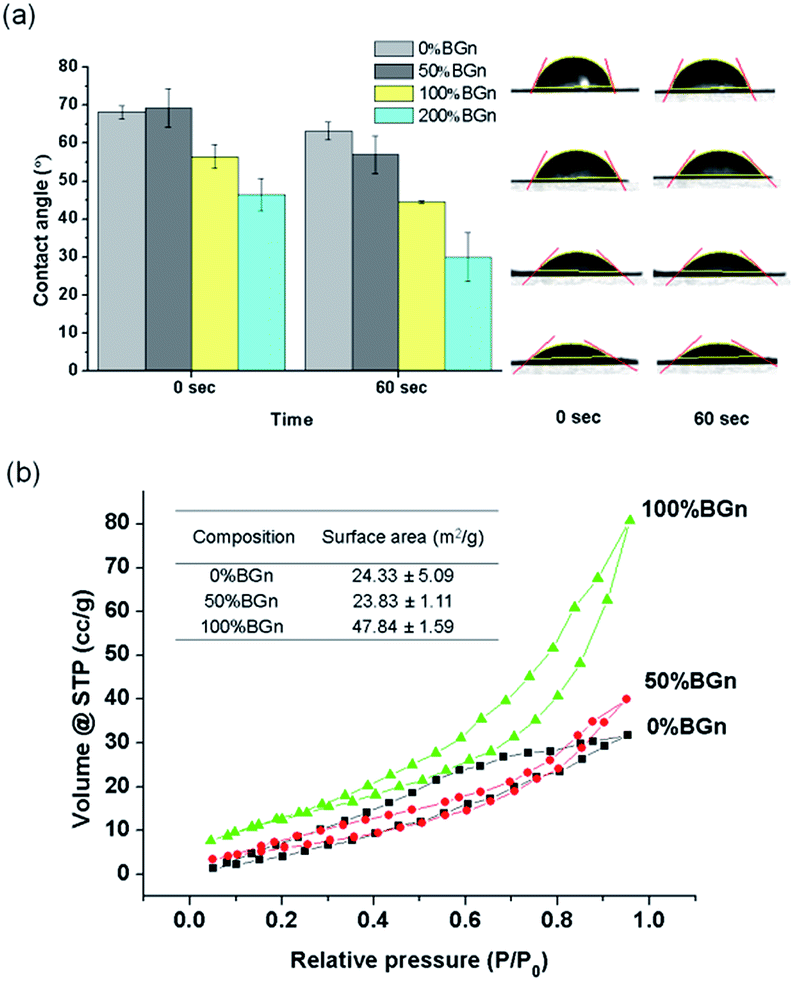 | ||
| Fig. 3 Properties of BGn/PLA scaffolds; (a) hydrophilicity by a contact angle measurement, and (b) specific surface area by a BET method. Contact angles recorded with time up to 60 s, with representative images showing a significantly decrease with the incorporation BGn. Specific surface area of scaffolds measured by the N2 adsorption/desorption curves showing an increase with the incorporation of BGn. | ||
The specific surface area of the scaffolds (PLA, 50% BGn and 100% BGn) was further analysed by BET method (Fig. 3b). The assay was not possible for 200% BGn due to the fragility during measurement. The N2 adsorption/desorption curves showed the BGn/PLA nanocomposite scaffolds recorded higher gas volumes than pure PLA, suggesting more gas adsorption. Based on the curves, the specific surface area of the scaffolds could be deduced. The incorporation of BGn significantly enhanced the specific surface area of scaffolds: 24 m2 g−1 (pure PLA) ∼ 24 m2 g−1 (50% BGn) < 48 m2 g−1 (100% BGn). The increase in specific surface area is considered to be the result of the increase in BGn content at the surface of scaffold, where the high mesoporosity of BGn can effectively adsorb the N2 gas molecules. The increased specific surface area of the scaffold enhances their capacity to interact with biological molecules.
3.2. Capacity of nanocomposites to load and release proteins
The ability of the nanocomposite scaffolds to load growth factors was first assessed by using Cyt C as the model protein. Different compositions of cylindrical scaffolds were soaked in Cyt C solution and the loaded amounts were measured (Fig. 4a). The Cyt C loading amount increased significantly with increasing the content of BGn; 5.5 μg mm−3 for pure PLA < 25.3 μg mm−3 for 50% BGn ≪ 102.3 μg mm−3 for 100% BGn ≪ and 274.1 μg mm−3 for 200% BGn. For comparison, other proteins (lysozyme with positive-charged and BSA with negative-charged at pH 7.4) were also tested using pure PLA and 100% BGn nanocomposite compositions (Fig. 4b). The lysozyme was loaded significantly higher on 100% BGn nanocomposite than on pure PLA (18.6 μg for pure PLA ≪ 95.4 μg for 100% BGn). On the other hand, BSA loading was similar on both scaffolds. Based on the loading results, the nanocomposite scaffolds proved the selective binding of proteins, i.e., favoured positive-charged proteins (Cyt C and lysozyme) than negative-charged one (BSA), and the role was played by BGn which was also negatively-charged (Si–OH). The substantially enhanced protein loading onto the nanocomposite scaffolds (more than 5–20 times of pure PLA) potentiates the usefulness of the scaffolds for the growth factor reservoir and delivery system.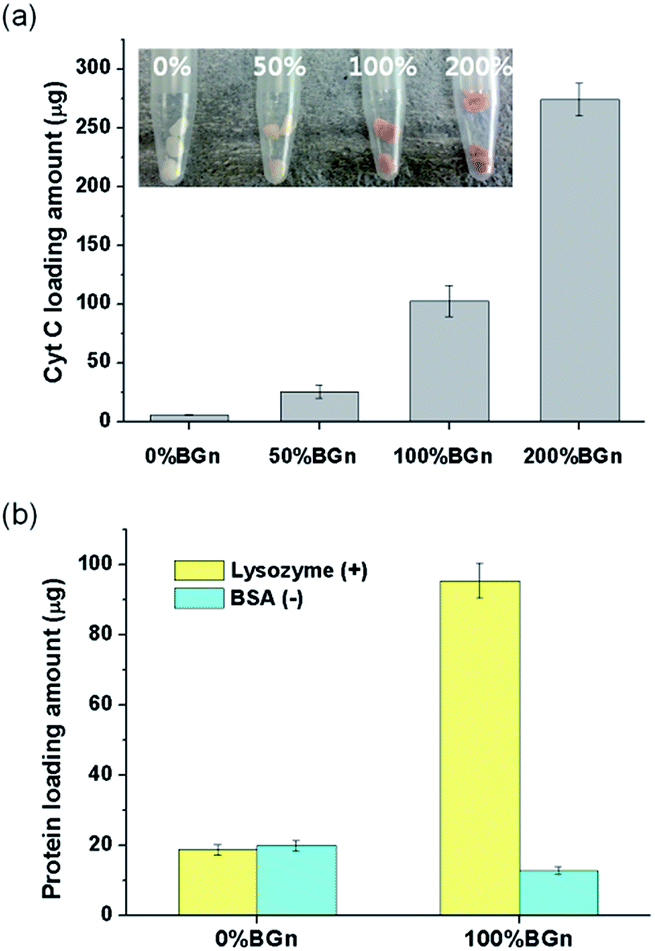 | ||
| Fig. 4 (a) Protein loading onto BGn/PLA scaffolds, measured by using Cyt C as a model protein. (b) Data on other proteins with different charges (lysozyme with positive- vs. BSA with negative-charged at pH 7.4) are also tested for comparison. Cyt C loading significantly increased with increasing BGn content; BGn/PLA scaffolds also selectively loaded positive proteins. | ||
Next the protein release from the scaffolds was investigated for a long-term period. The Cyt C release from the scaffolds was recorded for up to 28 days (Fig. 5a). From pure PLA, the Cyt C release was completed almost within 7 days. However, from the nanocomposite scaffolds, the Cyt C release was sustained and continued for a longer period. The release pattern showed a two-stage profile, i.e., rapid initially (within 3 days) then sustained thereafter (up to the test period). In particular, the release after 3 days appeared to follow almost zero-order kinetics. The data for all nanocomposite scaffolds fitted well (R2 > 0.98) with a linearity of 0.32 for 50% BGn, 0.96 for 100% BGn, and 2.92 for 200% BGn scaffolds. The linear profile of the protein release has been considered an ideal delivery system of scaffolds.41 The release amount was also presented after normalized to the loading amount (Fig. 5b). The release profiles from all nanocomposite scaffolds appeared to show a similar behaviour. However, the release rate became slightly lowered with increasing BGn content, suggesting that the release kinetics of the nanocomposite scaffolds was similar. However, the higher BGn content was highly effective in sustaining the protein release over a longer period. It is noteworthy that the release% of Cyt C after 28 days was approximately 30% (200% BGn), 50% (100% BGn), and 60% (50% BGn), which is in contrast to pure PLA (almost completed and burst release by 7 days).
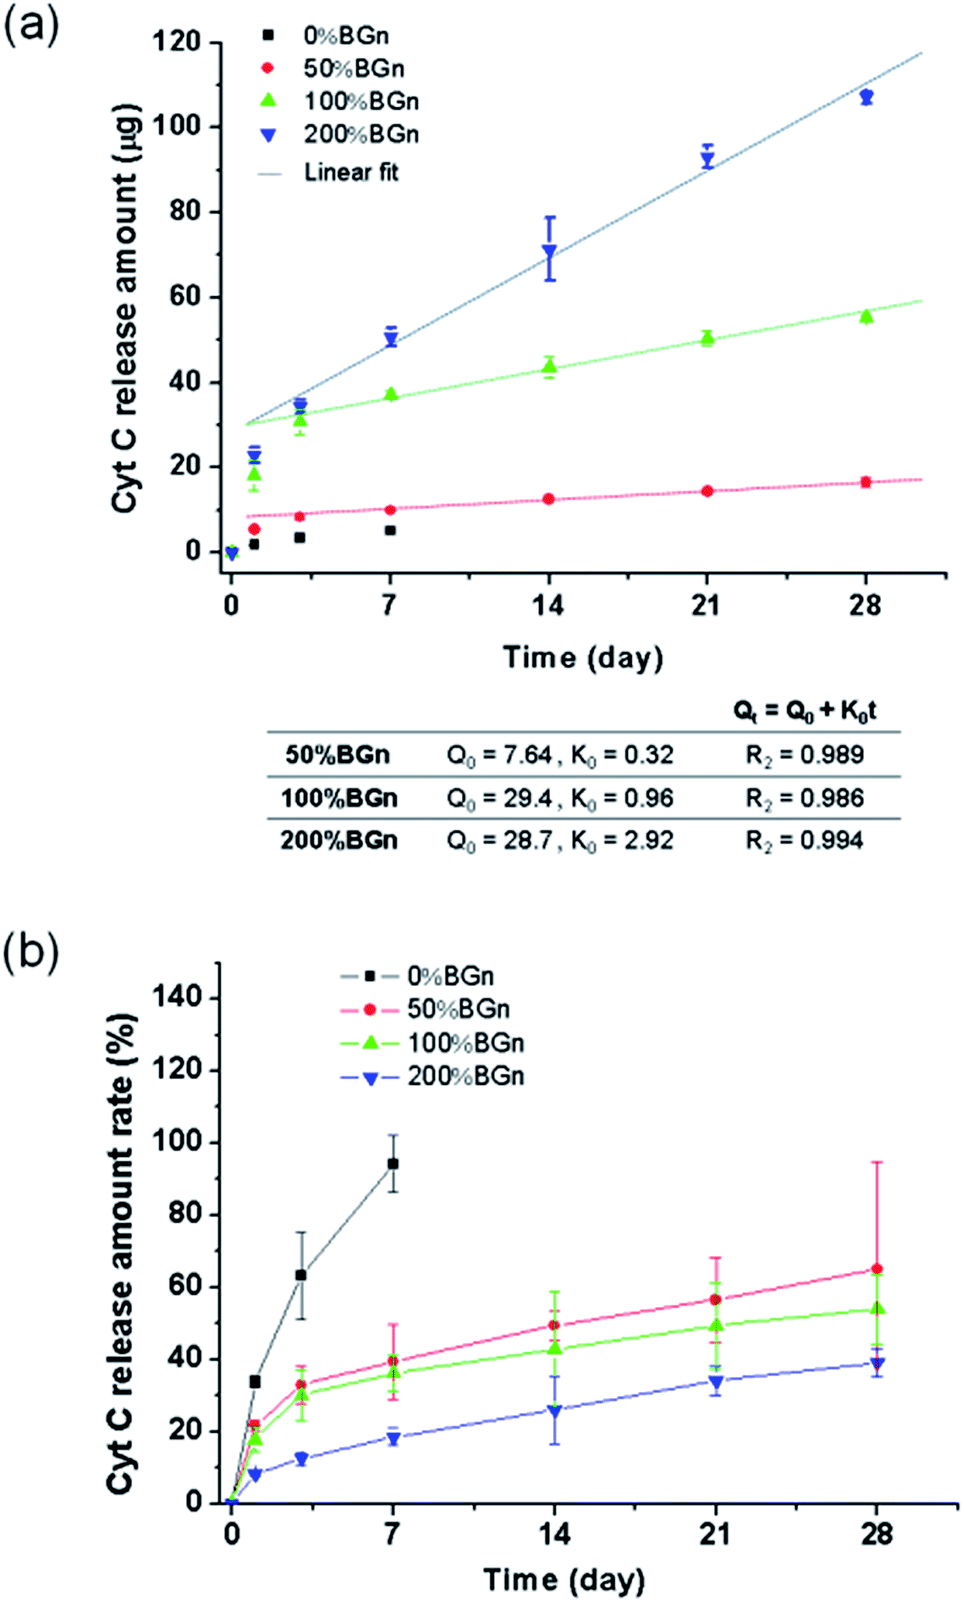 | ||
| Fig. 5 Cyt C release from the scaffolds, recorded cumulatively for up to 28 days. (a) Absolute release amount, and (b) relative (to initial loading) release amount. Cyt C release from the nanocomposite scaffolds was highly sustained (continuous over the test period), being in contrast to pure PLA scaffold. Data fit in late stage (after 3 days) demonstrate well a linear relationship, with kinetic parameters (Q0, K0) shown below the graph (a). | ||
Based on these protein loading and release results, a candidate growth factor FGF2 that has been widely used for tissue repair process was further studied.
3.3. Delivery of growth factor and the effects on in vitro cell responses
FGF2 tagged with GFP was loaded onto a representative nanocomposite scaffold (100% BGn), and its release profile was analysed by the fluorescence intensity, as shown in Fig. 6. FGF2 was released in a highly sustained manner, for up to 28 days. Similarly to that was observed for the Cyt C release, an almost linear release kinetics was well noticed after an initial short period. The corresponding release amount of FGF2 was 3.0, 4.5, 5.9 and 7.3 μg per scaffold at days 7, 14, 21, and 28 days, respectively, and a total release for 28 days was ∼48%, suggesting the FGF2 would continue to release thereafter. The amount of FGF released up to 28 days was consequently ∼7 μg, which corresponded to ∼250 ng per day; this amount of FGF2 has been considered to be therapeutically acceptable for the cellular stimulation and wound healing.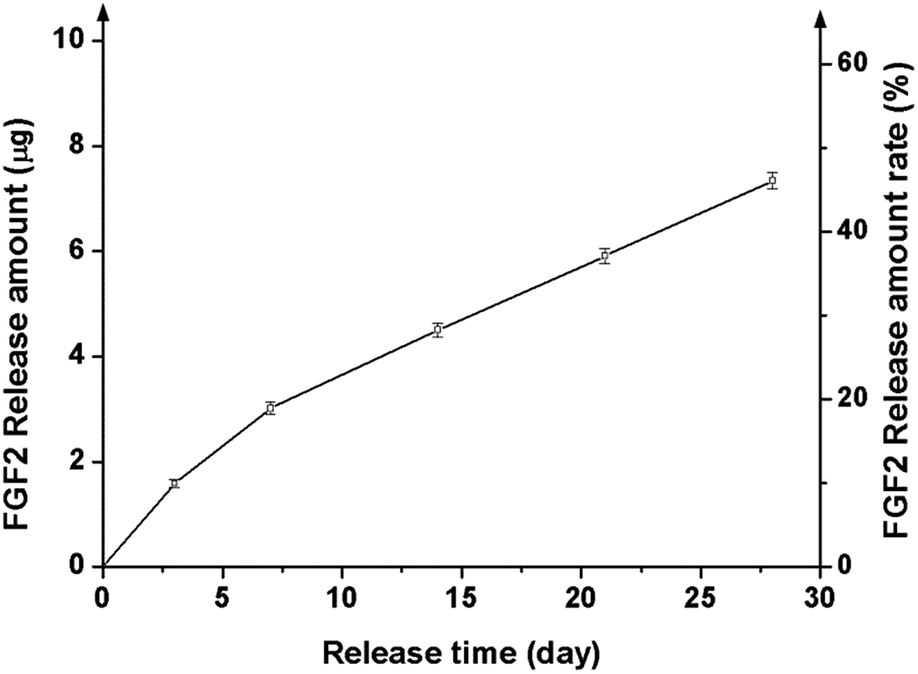 | ||
| Fig. 6 FGF2 growth factor release from the scaffolds (representative composition of 100% BGn used), measured cumulatively for up to 28 days. Release profile was highly sustained over the 28 days, with a total release amount ∼50%. | ||
Next the biological effects of the slowly releasing FGF2 from the nanocomposite scaffold were examined by means of rMSC proliferation. A priori test of the scaffolds (w/o FGF2) exhibited no significant cytotoxicity, as assayed by CCK (ESI, Fig. S2†). The FGF2-loaded scaffold was interacted repeatedly with rMSCs through a Transwell membrane for a certain period of time (3 days) while refreshing the cells every week (up to 3 weeks), as schematically illustrated (Fig. 7a). In the 1st week, the FGF2-loaded scaffolds showed significantly higher cell proliferation (∼20% increase) than the FGF2-free scaffolds after 3 days of culture (Fig. 7b). In the 2nd week, the rMSCs were refreshed and then cultured for 3 days. The cell proliferation was also significantly different between the groups with and w/o FGF2, reflecting the trend observed in the 1st week. In the 3rd week, the refreshed rMSCs also showed a similar proliferation behavior to that observed in the previous weeks. The observed 25–30% increases in cell proliferation between the groups suggest that the FGF2 sustainably released from the scaffolds (up to 3 weeks) should preserve the stimulating role of cell proliferation over the test period. The optical images of cells reflected well the stimulated cellular proliferation by the FGF2-releasing scaffolds (Fig. 7c).
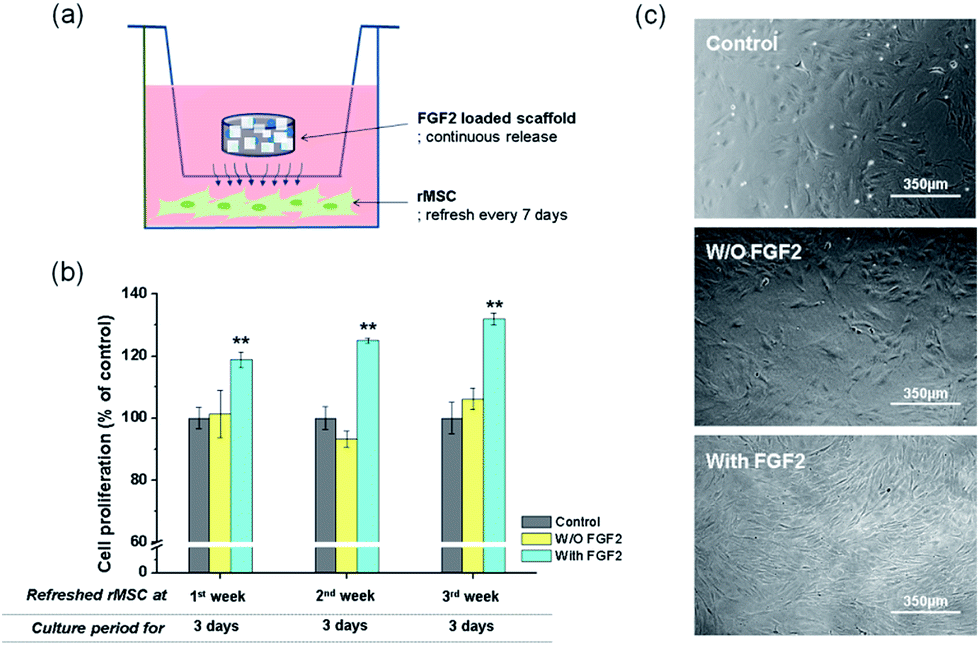 | ||
| Fig. 7 Effects of FGF2 slow release on the rMSCs proliferation. (a) Scheme of experiment, where FGF2-loaded scaffolds contained in Transwell membrane were maintained over the test period while rMSCs were refreshed every week (up to 3 weeks) to measure the 3 days of proliferation in every run. (b) Proliferation of cells measured every week (1st, 2nd, and 3rd week), and (c) representative cell image taken at 3rd week of experiment. FGF2 releasing scaffolds showed significantly higher proliferation level than FGF-free scaffolds, and the stimulation (20–30% increase) continued up to 3 weeks. Statistically significant differences were noticed; **p < 0.01 (ANOVA, n = 4). | ||
Here the FGF2 was used as the model growth factor to assess the capacity of scaffolds for growth factor loading and sustained release, and the biological effects were analyzed by means of MSCs proliferation. In fact, FGF2 has been recognized for stimulating stem cell behaviors at an early phase of bone regeneration, such as cell proliferation, homing and angiogenesis.42,43 As a further study, other growth factors that are engaged in the osteogenesis and maturation of cells (e.g., bone morphogenetic proteins and FGF1844 are considered to demonstrate well the long-term release effects of growth factors through the scaffolds, which may be ultimately helpful for MSCs differentiation into bone lineage and mineralization.
4. Conclusions
Nanocomposite scaffolds made of BGn and PLA were shown to have excellent capacity to load protein at high quantity and deliver it in a sustained manner. This was mainly due to the highly improved hydrophilicity and specific surface area associated with the presence of mesoporous bioactive nanoparticles on the scaffolds. The release of model growth factor FGF2 demonstrated a long-term sustained release profile over at least 4 weeks, and a consequent biological stimulation of cells (MSCs' proliferation). Thus, the current scaffolds may constitute a promising platform that can deliver therapeutic molecules particularly over long-term periods, which is required to repair and regenerate tissues, such as bone.Acknowledgements
This work was supported by the grants from the National Research Foundation, Republic of Korea; Priority Research Centers Program (No. 2009-0093829).Notes and references
- D. Tang, R. S. Tare, L.-Y. Yang, D. F. Williams, K.-L. Ou and R. O. Oreffo, Biomaterials, 2016, 83, 363–382 CrossRef CAS PubMed.
- L. G. Griffith and G. Naughton, Science, 2002, 295, 1009–1014 CrossRef CAS PubMed.
- S. Almubarak, H. Nethercott, M. Freeberg, C. Beaudon, A. Jha, W. Jackson, R. Marcucio, T. Miclau, K. Healy and C. Bahney, Bone, 2016, 83, 197–209 CrossRef CAS PubMed.
- F.-M. Chen and X. Liu, Prog. Polym. Sci., 2016, 53, 86–168 CrossRef CAS PubMed.
- J.-H. Jang, O. Castano and H.-W. Kim, Adv. Drug Delivery Rev., 2009, 61, 1065–1083 CrossRef CAS PubMed.
- X. Yang, H. Roach, N. Clarke, S. Howdle, R. Quirk, K. Shakesheff and R. Oreffo, Bone, 2001, 29, 523–531 CrossRef CAS PubMed.
- J. L. Hoon, M. H. Tan and C.-G. Koh, Cells, 2016, 5, 17 CrossRef PubMed.
- R. A. Perez, S.-J. Choi, C.-M. Han, J.-J. Kim, H. Shim, K. W. Leong and H.-W. Kim, Prog. Mater. Sci., 2016, 82, 234–293 CrossRef.
- S. Mooyen, N. Charoenphandhu, J. Teerapornpuntakit, J. Thongbunchoo, P. Suntornsaratoon, N. Krishnamra, I. Tang and W. Pon-On, J. Biomed. Mater. Res., Part B, 2016 DOI:10.1002/jbm.b.33769.
- H. Chen, M. Gigli, C. Gualandi, R. Truckenmüller, C. van Blitterswijk, N. Lotti, A. Munari, M. L. Focarete and L. Moroni, Biomaterials, 2016, 76, 261–272 CrossRef CAS PubMed.
- R. Cancedda, B. Dozin, P. Giannoni and R. Quarto, Matrix Biol., 2003, 22, 81–91 CrossRef CAS PubMed.
- M. Bouyer, R. Guillot, J. Lavaud, C. Plettinx, C. Olivier, V. Curry, J. Boutonnat, J.-L. Coll, F. Peyrin and V. Josserand, Biomaterials, 2016, 104, 168–181 CrossRef CAS PubMed.
- T. N. Vo, F. K. Kasper and A. G. Mikos, Adv. Drug Delivery Rev., 2012, 64, 1292–1309 CrossRef CAS PubMed.
- S.-H. Lee and H. Shin, Adv. Drug Delivery Rev., 2007, 59, 339–359 CrossRef CAS PubMed.
- L. Pandolfi, S. Minardi, F. Taraballi, X. Liu, M. Ferrari and E. Tasciotti, J. Tissue Eng., 2016, 7, 2041731415624668 Search PubMed.
- A. M. Díez-Pascual and A. L. Díez-Vicente, ACS Appl. Mater. Interfaces, 2016, 8, 17902–17914 Search PubMed.
- L. D. Sánchez, N. Brack, A. Postma, P. J. Pigram and L. Meagher, Biomaterials, 2016, 106, 24–45 CrossRef PubMed.
- B. Dorj, M.-K. Kim, J.-E. Won and H.-W. Kim, Mater. Lett., 2011, 65, 3559–3562 CrossRef CAS.
- S. Zhang, Z. Jiang, J. Shi, X. Wang, P. Han and W. Qian, ACS Appl. Mater. Interfaces, 2016, 8, 25152–25161 CAS.
- P. S. Korrapati, K. Karthikeyan, A. Satish, V. R. Krishnaswamy, J. R. Venugopal and S. Ramakrishna, Mater. Sci. Eng., C, 2016, 67, 747–765 CrossRef CAS PubMed.
- M. S. Kang, J.-H. Kim, R. K. Singh, J.-H. Jang and H.-W. Kim, Acta Biomater., 2015, 16, 103–116 CrossRef CAS PubMed.
- H. Zhu, D. Yu, Y. Zhou, C. Wang, M. Gao, H. Jiang and H. Wang, J. Biomed. Mater. Res., Part B, 2013, 101, 541–552 CrossRef PubMed.
- J. J. Kim, R. K. Singh, K. D. Patel and H. W. Kim, Part. Part. Syst. Charact., 2016, 33, 878–886 CrossRef CAS.
- R. K. Singh, G.-Z. Jin, C. Mahapatra, K. D. Patel, W. Chrzanowski and H.-W. Kim, ACS Appl. Mater. Interfaces, 2015, 7, 8088–8098 CAS.
- A. El-Fiqi, J.-H. Kim and H.-W. Kim, ACS Appl. Mater. Interfaces, 2015, 7, 1140–1152 CAS.
- O. Castaño, N. Sachot, E. Xuriguera, E. Engel, J. A. Planell, J.-H. Park, G.-Z. Jin, T.-H. Kim, J.-H. Kim and H.-W. Kim, ACS Appl. Mater. Interfaces, 2014, 6, 7512–7522 Search PubMed.
- M. Kouhi, M. Morshed, J. Varshosaz and M. H. Fathi, Chem. Eng. J., 2013, 228, 1057–1065 CrossRef CAS.
- C. O. Correia, Á. J. Leite and J. F. Mano, Carbohydr. Polym., 2015, 123, 39–45 CrossRef CAS PubMed.
- E. Sharifi, M. Azami, A.-M. Kajbafzadeh, F. Moztarzadeh, R. Faridi-Majidi, A. Shamousi, R. Karimi and J. Ai, Mater. Sci. Eng., C, 2016, 59, 533–541 CrossRef CAS PubMed.
- B. Tyler, D. Gullotti, A. Mangraviti, T. Utsuki and H. Brem, Adv. Drug Delivery Rev., 2016, 107, 163–175 CrossRef CAS PubMed.
- G. Narayanan, V. N. Vernekar, E. L. Kuyinu and C. T. Laurencin, Adv. Drug Delivery Rev., 2016, 107, 247–276 CrossRef CAS PubMed.
- C. Zhou, Q. Shi, W. Guo, L. Terrell, A. T. Qureshi, D. J. Hayes and Q. Wu, ACS Appl. Mater. Interfaces, 2013, 5, 3847–3854 CAS.
- A. Abdal-hay, F. A. Sheikh and J. K. Lim, Colloids Surf., B, 2013, 102, 635–643 CrossRef CAS PubMed.
- T. Lou, X. Wang, G. Song, Z. Gu and Z. Yang, Int. J. Biol. Macromol., 2014, 69, 464–470 CrossRef CAS PubMed.
- A. El-Fiqi, T.-H. Kim, M. Kim, M. Eltohamy, J.-E. Won, E.-J. Lee and H.-W. Kim, Nanoscale, 2012, 4, 7475–7488 RSC.
- A. El-Fiqi, J. H. Lee, E.-J. Lee and H.-W. Kim, Acta Biomater., 2013, 9, 9508–9521 CrossRef CAS PubMed.
- E. Jeon, Y. R. Yun, H. W. Kim and J. H. Jang, J. Biomed. Mater. Res., Part A, 2014, 102, 1–7 CrossRef PubMed.
- S.-A. Oh, H.-Y. Lee, J. H. Lee, T.-H. Kim, J.-H. Jang, H.-W. Kim and I. Wall, Tissue Eng., Part A, 2012, 18, 1087–1100 CrossRef CAS PubMed.
- C. Mahapatra, R. K. Singh, J.-J. Kim, K. D. Patel, R. A. Perez, J.-H. Jang and H.-W. Kim, ACS Appl. Mater. Interfaces, 2016, 8, 27573–27584 CAS.
- R. K. Singh, K. D. Patel, C. Mahapatra, M. S. Kang and H.-W. Kim, ACS Appl. Mater. Interfaces, 2016, 8, 24433–24444 CAS.
- J. B. Leach and C. E. Schmidt, Biomaterials, 2005, 26, 125–135 CrossRef CAS PubMed.
- M. Du, T. Zhu, X. Duan, S. Ge, N. Li, Q. Sun and P. Yang, Mater. Sci. Eng., C, 2017, 70, 62–70 CrossRef CAS PubMed.
- Y. W. Eom, J.-E. Oh, J. I. Lee, S. K. Baik, K.-J. Rhee, H. C. Shin, Y. M. Kim, C. M. Ahn, J. H. Kong and H. S. Kim, Biochem. Biophys. Res. Commun., 2014, 445, 16–22 CrossRef CAS PubMed.
- S. Stegen, N. van Gastel and G. Carmeliet, Bone, 2015, 70, 19–27 CrossRef CAS PubMed.
Footnote |
| † Electronic supplementary information (ESI) available. See DOI: 10.1039/c6ra28841c |
| This journal is © The Royal Society of Chemistry 2017 |