 Open Access Article
Creative Commons Attribution 3.0 Unported Licence
A facile graphene oxide based sensor for electrochemical detection of prostate anti-cancer (anti-testosterone) drug flutamide in biological samples†
R. Karthika,
Mani Govindasamy a,
Shen-Ming Chen
 *a,
Tse-Wei Chena,
J. Vinoth kumarb,
A. Elangovanc,
V. Muthurajb and
Ming-Chin Yu*d
aElectroanalysis and Bioelectrochemistry Lab, Department of Chemical Engineering and Biotechnology, National Taipei University of Technology, No. 1, Section 3, Chung-Hsiao East Road, Taipei, 106, Taiwan, Republic of China. E-mail: smchen78@ms15.hinet.net; Fax: +886 2270 25238; Tel: +886 2270 17147
bDepartment of Chemistry, VHNSN College, Virudhunagar – 626001, India
cDepartment of Chemistry, Thiagarajar College, Madurai – 625009, India
dDepartment of Surgery, Chang Gung Memorial Hospital at Linkou, No. 5, Fu-Hsing Street, Kweishan, Taoyuan, 333, Taiwan. E-mail: mingchin2000@gmail.com; Tel: +886 32381200, ext. 3366
First published on 12th May 2017
Abstract
A novel electrochemical sensor based on graphene oxide (GO) modified glassy carbon electrode (GCE) has been successfully developed for the determination of anti-cancer drug flutamide for the first time. The morphology and structure of the prepared GO were characterized by Fourier transform infrared spectroscopy (FTIR), X-ray diffraction (XRD), UV-visible spectroscopy, scanning electron microscopy (SEM), energy-dispersive X-ray spectroscopy (EDX), field emission-scanning electron microscopy (FE-SEM), and transmission electron microscopy (TEM). The electrochemical properties of the GO were studied by electrochemical impedance spectroscopy (EIS). GO modified GCE was fabricated and utilized to study the electrochemical performance of flutamide by cyclic voltammetry (CV) and linear sweep voltammetry (LSV). As an electrochemical sensor, GO modified GCE exhibited strong electrocatalytic activity towards the reduction of flutamide. Interestingly, the electrochemical sensor displayed an excellent current response for the detection of flutamide with wide linear response range, excellent limit of detection and good sensitivity of 0.009 to 1.9 μM, 6 nM and 29.55 μA μM−1 cm−2, respectively. The proposed sensor has good repeatability, reproducibility, stability and selectivity even in the presence of biologically co-interfering substances. GO modified GCE sensor was successfully used for the detection of flutamide (spiked) in various blood serum samples.
1. Introduction
Flutamide (2-methyl-N-[-nitro-3-(trifluoromethyl) phenyl]-propanamide) is a synthetic, non-steroidal, pure anti-androgen drug, and it has been widely used in the treatment of men with prostate cancer. Flutamide belongs to a class of drugs known as anti-androgens (anti-testosterone). Testosterone is a natural hormone that is responsible for the growth and spread of prostate cancer cells in humans. Flutamide works by blocking the effects of testosterone, thereby slowing down (decrease) the growth and spread of prostate cancer cells. The overdosage of flutamide in humans may cause severe side effects such as inflamed prostate, blood in urine, rectal bleeding, hot flashes, loss of sexual interest/ability, diarrhea, nausea, vomiting, enlarged growth of male breasts, drowsiness, liver malfunction and methemoglobinemia.1,2 Moreover, initial clinical trials have proven that the drug was highly active initially but required further development to achieve full effectiveness. The drug–drug interaction and selective structural parameters are still challenging. Thus, the metabolites have been retained in human organs due to poor metabolic disorder. Yuwei W. et al., demonstrated the combined quantitative structure activity relationship (QSAR) by quinolinone derivatives to study the metabolic effects.46 Therefore, there is an important need to develop a system for the sensitive and selective determination of flutamide in biological samples. Thus far, only limited analytical techniques such as flow injection,3 spectrophotometry,4 high performance liquid chromatography (HPLC),5 and gas liquid chromatography (GLC) have been developed for the detection and determination of flutamide. However, most of these techniques involved time-consuming procedures and tedious protocols, whereas electrochemical techniques were more simple, fast, sensitive and selective than the other mentioned techniques.6,7In the last decade, the role of carbon and carbon based nanocomposite materials was vital in leading scientific and industrial research related to nanotechnology. The carbon material such as graphite, fullerene C60, fullerene C540, carbanions, graphene, single walled carbon nanotube (SWCNT) and multi walled carbon nanotube (MWCNT) have been widely used in some important applications such as drug delivery,8,9 luminescent nanomaterials,8,10 nanocomposites,11–14 and catalysts of chemical reactions15 owing to their excellent stability, large surface area and thinner thickness.16–19 Among these carbon materials, graphene oxide (GO) and GO based nanocomposite materials have garnered interest of several researchers because of its large surface to volume ratio, low cost, unique and electronic properties, mechanical strength, higher optical and thermal properties. In addition, GO has also been intensively studied due to its good solubility and availability of numerous functional groups on the surface. Moreover, GO is a non-stoichiometric two-dimensional carbon nanomaterial that results from the acid exfoliation of natural graphite and exhibits properties such as facile surface modification, excellent water solubility and high mechanical strength. As a result, they have efficient applications in optical nonlinearity,20 large-scale production of graphene, insulator,21 water purification,22 coating23 paper manufacturing,24 flexible rechargeable battery25 and graphene oxide lens.26 Particularly in electrochemistry, GO is employed in photovoltaic devices,27 fabrication of chemical sensors and biosensors28,29 due to wide electrochemical potential window, low charge-transfer resistance, enhanced detection abilities, excellent electron transfer capability and great electrochemical activity.30
The present study aims to develop a selective and sensitive method for the detection of flutamide based on electrocatalytic activity rich GO modified glassy carbon electrode (GCE). To the best of our knowledge, such a system has been reported for the first time. The prepared GO was characterized by FT-IR, XRD, UV-visible spectroscopy, Raman spectroscopy, SEM, EDX, FE-SEM and TEM. We achieved lowest detection limit (LOD) of 6 nM in the detection of flutamide. This has been the lowest LOD achieved among the earlier reported electrochemical sensors. We also demonstrated the practical applicability of the proposed sensor based on GO modified GCE in real sample analysis involving various blood serum samples, and the obtained results were acceptable.
2. Experimental
2.1 Materials
Raw graphite with average diameter of about >20 mm was obtained from Sigma-Aldrich. Flutamide and other biological compounds such as dopamine, ascorbic acid, uric acid, glucose and catechol were purchased from Sigma-Aldrich and used without further purification. The supporting electrolyte utilized for all experiments was prepared using 0.05 M Na2HPO4 and NaH2PO4 solutions. All other chemicals were of analytical grade, and all the required solutions were prepared using de-ionized water. Rat brain sample and human serum were acquired from Chang Gung University, Taiwan, and the experimental protocols were approved by the institutional Animal Ethics Committee.2.2 Methods
Cyclic voltammetry (CV) and linear sweep voltammetry (LSV) experiments were performed using CHI 405A workstation. Amperometric (i–t) measurements have been achieved with analytical rotator AFMSRX (PINE instruments, USA) with a rotating disk electrode (RDE) having a working area of 0.21 cm2. Electrochemical studies were implemented in a conventional three electrode cell system using GCE as a working electrode (area = 0.07 cm2), platinum wire as a counter electrode and saturated Ag/AgCl (saturated KCl) as a reference electrode. All the electrochemical measurements have been executed at room temperature and electrolyte cell solutions were kept under nitrogen (N2) atmosphere. The EIS studies were carried out using IM6ex ZAHNER (Kronach, Germany). FT-IR spectra were recorded on a model FT-720, Horiba system. The XRD data were analyzed for GO in XPERT-PRO (PANalytical B.V., The Netherlands) diffractometer (Cu Kα radiation, k 1/4 1.54 Å). JASCO V-770 double beam spectrophotometer was used for UV-visible spectral analysis. Raman spectra were recorded on a Raman spectrometer (Dong Woo 500i, Korea) equipped with a charge-coupled detector. The surface morphological studies were investigated using SEM (SEM Hitachi S-3000H) attached with an energy-dispersive X-ray analyzer, field-emission scanning electron microscopy (FE-SEM) JEOL JSM-6500F and transmission electron microscopy (TEM-TECNAI G2).2.3 Synthesis of graphene oxide
GO was prepared by a modified Hummers method.31 In brief, raw graphite powder (2 g) and 1 g of NaNO3 were added with 46 mL of H2SO4 in a 1000 mL beaker kept in an ice bath. The obtained mixture was stirred and 3 g of potassium permanganate was added slowly to the above mixture; the stirring was continued for 2 h. The obtained mixture was then placed in a water bath (35 °C) and stirred for 20 min. Following that, 92 mL of de-ionized water was added slowly into the solution, and the solution temperature was maintained at about 98 °C. Furthermore, 280 mL of de-ionized water and 20 mL of hydrogen peroxide was consequently added to the mixture solution to stop the reaction. The obtained product was centrifuged and washed with 5% HCl solution, followed by washing with de-ionized water several times. Finally, the product of graphene oxide powder was dried in vacuum at 60 °C for 10 h. The required graphene oxide solution was prepared using the final product of graphene oxide powder.2.4 Fabrication of graphene oxide modified GCE
The final product of graphite, 2 mg mL−1 was dispersed in de-ionized water. As prepared, GO was exfoliated by ultrasonication for 1 h to get homogenous GO nanosheets solution. Prior to modification, GCE was cleaned with 0.05 μm alumina slurry and subjected to sonication (20 s) in ethanol and water (1![[thin space (1/6-em)]](https://www.rsc.org/images/entities/char_2009.gif) :
:![[thin space (1/6-em)]](https://www.rsc.org/images/entities/char_2009.gif) 1) mixture. The polished GCE surface was dried at room temperature. About 8 μL (optimized concentration) of the GO solution was drop casted on the GCE surface and allowed to dry in an air oven at ambient temperature. The obtained GO modified GCE surface was gently rinsed with water to remove loosely attached molecule on the GCE surface. The obtained GO modified GCE was employed for further electrochemical experiments, and the GO modified GCE was stored at 4 °C under dry condition when it was not in use.
1) mixture. The polished GCE surface was dried at room temperature. About 8 μL (optimized concentration) of the GO solution was drop casted on the GCE surface and allowed to dry in an air oven at ambient temperature. The obtained GO modified GCE surface was gently rinsed with water to remove loosely attached molecule on the GCE surface. The obtained GO modified GCE was employed for further electrochemical experiments, and the GO modified GCE was stored at 4 °C under dry condition when it was not in use.
3. Results and discussion
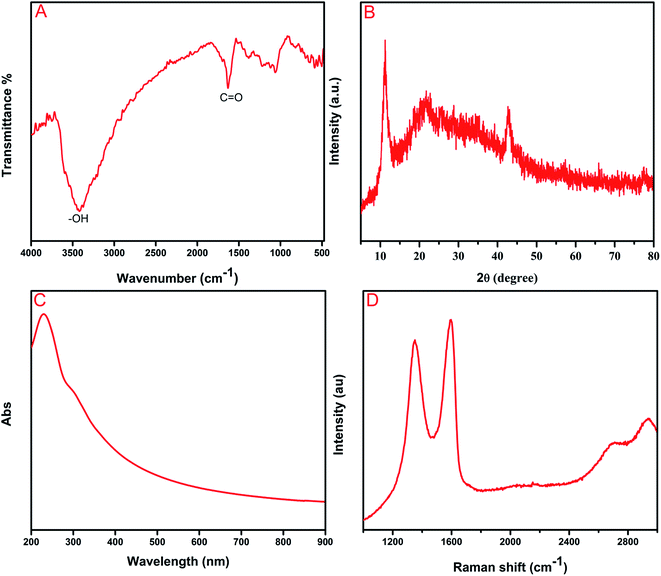
The chemical composition of as-synthesized GO was determined by FT-IR analysis. Fig. 1A shows the absorption bands at 1055 and 1227 cm−1 assigned to the C–O stretching vibration of an epoxy group and C–O–C stretching vibration, respectively.32 The peaks at 1383 and 1627 cm−1 corresponded to the stretching vibration of O![[double bond, length as m-dash]](https://www.rsc.org/images/entities/char_e001.gif) C–O bonds and the skeletal vibration of C
C–O bonds and the skeletal vibration of C![[double bond, length as m-dash]](https://www.rsc.org/images/entities/char_e001.gif) C, respectively.33 The appearance of a broad peak at 3249 cm−1 can be attributed to O–H stretching vibrations of water molecules. The aforementioned different oxygen functionalities have clearly proven the formation of GO from the graphite powder. The XRD analyses revealed the crystalline nature of as-synthesized GO, and they can be observed in Fig. 1B. The distinct diffraction peaks in the 2θ range at 11.1° and 43° corresponded to (001) and (101) reflection planes of GO, respectively.34 The successful oxidation of graphite to graphene oxide has been confirmed by the abovementioned analysis. Furthermore, Fig. 1C depicts the UV-vis spectrum of the as-prepared GO, which displays absorption peaks at 230 and 289 nm. The sharp peak at 230 nm, which indicates aromatic C–C bonds of π → π* transitions, and the shoulder peaks at around 289 nm can be ascribed to the C
C, respectively.33 The appearance of a broad peak at 3249 cm−1 can be attributed to O–H stretching vibrations of water molecules. The aforementioned different oxygen functionalities have clearly proven the formation of GO from the graphite powder. The XRD analyses revealed the crystalline nature of as-synthesized GO, and they can be observed in Fig. 1B. The distinct diffraction peaks in the 2θ range at 11.1° and 43° corresponded to (001) and (101) reflection planes of GO, respectively.34 The successful oxidation of graphite to graphene oxide has been confirmed by the abovementioned analysis. Furthermore, Fig. 1C depicts the UV-vis spectrum of the as-prepared GO, which displays absorption peaks at 230 and 289 nm. The sharp peak at 230 nm, which indicates aromatic C–C bonds of π → π* transitions, and the shoulder peaks at around 289 nm can be ascribed to the C![[double bond, length as m-dash]](https://www.rsc.org/images/entities/char_e001.gif) O bonds of n → π* transitions 35 Raman spectroscopy has been a valuable and non-destructive tool in the analysis of carbonaceous material, particularly graphene material and it is represented in Fig. 1D. The pronounced peaks at 1595 and 1351 cm−1 can be ascribed to G and D bands, respectively. D band can be attributed to the k-point phonons breathing mode of A1g symmetry vibrations and G band corresponds to the C sp2 phonon of E2g symmetry vibrations.36,37
O bonds of n → π* transitions 35 Raman spectroscopy has been a valuable and non-destructive tool in the analysis of carbonaceous material, particularly graphene material and it is represented in Fig. 1D. The pronounced peaks at 1595 and 1351 cm−1 can be ascribed to G and D bands, respectively. D band can be attributed to the k-point phonons breathing mode of A1g symmetry vibrations and G band corresponds to the C sp2 phonon of E2g symmetry vibrations.36,37
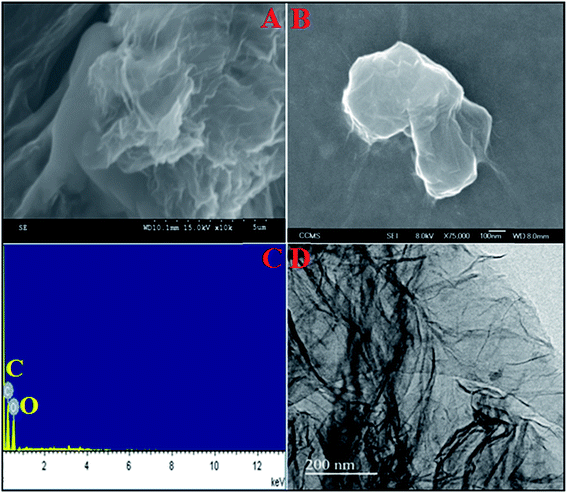
The surface morphology of the as-prepared GO was examined by SEM, FE-SEM and TEM analysis. Fig. 2A displays the visual aspect of the as-synthesized GO using typical SEM micrographs, which reveal the smooth, multilayered and crumpled silk like structure. The corresponding EDX spectrum is shown in Fig. 2C which confirms the presence of carbon and oxygen elements only. No other elements were observed in the spectrum thereby confirming the purity of as-synthesized GO. Moreover, Fig. 2B and D show the FE-SEM and TEM images of GO and confirm the formation of a multilayered structure of GO. The obtained results were found to be in excellent agreement with the SEM results.
3.1 Electrochemical impedance spectroscopy (EIS)
Electrochemical impedance spectroscopy (EIS) is an efficient technique for probing the features of surface modified electrodes. The semicircle of the curve on EIS reflects the interface layer resistance occurring on the electrode surface, and the smaller curve semicircle refers to lower impedance, which favors easier charge transfer. The electron transfer of the modified GO (a) and unmodified GO (b) electrodes was examined in 0.1 M KCl aqueous solution containing 5 mM [Fe(CN)6]3−/4− and it was depicted in Fig. 3. The inset in Fig. 3 displays Randles equivalent circuit model for EIS analysis. The total electrode impedance corresponds to the electron transfer resistance (Rct) in series with the parallel connection of the double layer capacitance (Cdl) and Warburg impedance (Zw). It can be observed from Fig. 3 that the internal resistance of GO modified GCE (Fig. 3a) was a much lower semicircle than that of bare GCE (Fig. 3b), which could be attributed to fast electron transfer by GO when compared to bare GCE. The EIS results suggested that GO modified GCE could dramatically improve the electron transfer efficiency and the reduction of flutamide.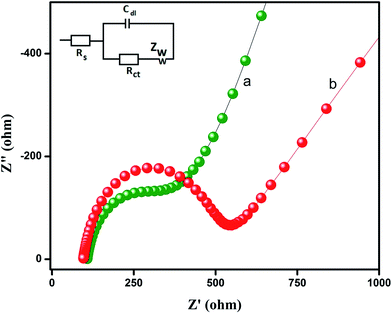 | ||
| Fig. 3 The electrochemical impedance spectroscopy (EIS) of (a) GO (b) bare GCE in 0.1 M KCl aqueous solution containing 5 mM [Fe(CN)6]3−/4−. Inset: the randles equivalent circuit model. | ||
3.2 Electrochemical performance of flutamide on the GO modified GCE
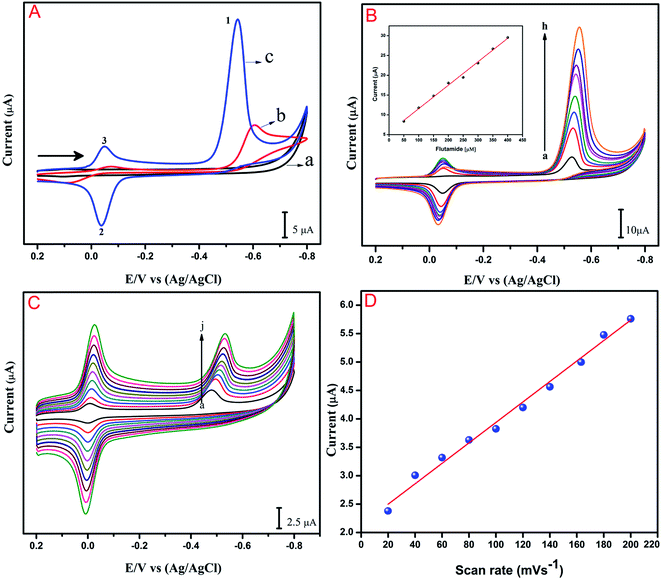
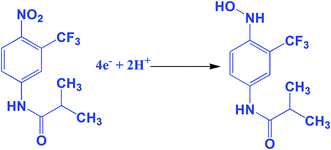
The electrochemical performance of the anti-cancer drug flutamide on various modified electrodes was investigated using CV. Fig. 4A reveals electrochemical performances in the absence of (a) GO/GCE and presence of 200 μM flutamide (b) bare GCE and (c) GO/GCE containing 0.05 M phosphate buffer solution (PB solution) (pH 7) at a scan rate 50 mV s−1. In the curve for (GO/GCE), there was no significant peak in the absence of 200 μM flutamide. At the same time, a well-defined sharp cathodic peak (1) was observed at −0.54 V in the presence of 200 μM flutamide (curve (c)) due to the direct reduction of flutamide to hydroxylamine. In the reverse anodic scan, no other anodic peak was found corresponding to peak 1, thereby indicating that the cathodic peak was irreversible. Two more reversible peaks were observed at GO modified GCE in the presence of 200 μM flutamide and they were denoted as 2 and 3. The anodic peak 2 was observed at the potential of −0.02 V and its corresponding cathodic peak 3 was also observed at a potential of −0.04 V due to two electron reversible reaction of hydroxylamine derivative to nitroso derivative. The result of 3 was obtained by the reduction of nitroso derivative to hydroxylamine derivatives.38 The overall electrochemical mechanism of flutamide has been shown in Scheme 1. In addition, the obtained cathodic peak current at GO modified GCE in the presence of 200 μM flutamide was 2.5 fold higher and exhibited a lower potential (−0.54 V) compared to bare GCE (−0.62 V). These results evidently indicate excellent electrocatalytic activity of the GO modified GCE towards the detection of the anti-cancer drug flutamide. Fig. 4B depicts the CV results of flutamide solutions in different concentrations ranging from 50 to 400 μM (a–h) in 0.05 M PB solution (pH 7) at GO modified GCE with a scan rate 50 mV s−1. In the range of 50 to 400 μM, cathodic peak current has a good linear relationship with the concentration of flutamide (R2 = 0.995), as depicted in the inset of Fig. 4B. Furthermore, the electrochemical features such as linear response range, limit of detection and sensitivity have been discussed and detailed in Section 3.5.3.3 Influence of scan rate
The influence of scan rate on the electrochemical reduction performance of flutamide on GO modified GCE was studied by CV. As shown in Fig. 4C, cathodic peak intensity increased continuously on increasing the scan rate, and the peak potential was slightly shifted towards more negative potential. The cathodic peak current (Ipc) of flutamide showed good linear relationship with scan rate between 20 to 200 mV s−1 (a–j). The linear regression equation of flutamide can be expressed as Ipc (μA) = 0.0179x + 2.1431 (μA, mV s−1, R2 = 0.991), as illustrated in Fig. 4D. The presented results suggest that the electrochemical reduction of flutamide on the GO modified GCE is an adsorption controlled process.393.4 Influence of pH
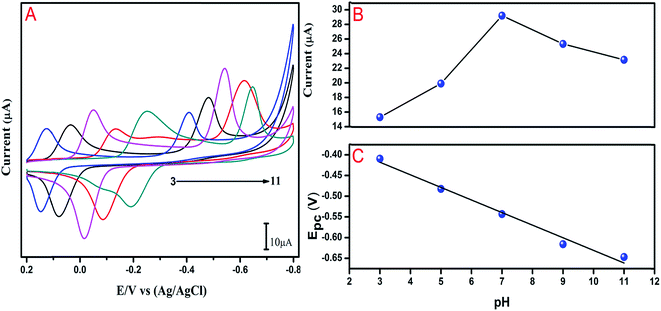
The electrochemical process should be affected by changing pH values due to the involvement of protons at the overall electrode surface. pH was a significant factor affecting the performance of the GO modified GCE in the reduction of flutamide. Therefore, the effect of different pH solutions (0.05 M PB; pH ranging from 3 to 11) was examined by CV observations and the results are shown in Fig. 5A. A gradual increase in the cathodic peak current was observed when pH was increased from 3 to 7, whereas, the cathodic peak current decreased from pH 7 to 11. A higher cathodic peak current for flutamide was obtained when the buffered pH was 7 (Fig. 5B). Therefore, pH 7 was chosen for further electrochemical studies. Furthermore, the relationship between the cathodic peak potential and the function of pH in the range of 3–11 was also investigated in the presence of 200 μM flutamide. Increasing the pH value from 3–11, the cathodic peak potential shifted towards a more negative potential, thereby suggesting the direct involvement of hydrogen ions in the reduction process on modified electrode surface. The linear fit was obtained for relationship between cathodic peak potential (Ep) and pH using linear regression equation of Ep = −0.0305x − 0.3259 and the correlation coefficient of R2 = 0.985. According to the slope value of the linear fit, in the electrocatalytic reduction process of flutamide on GO modified GCE, four electrons and two protons were involved.3.5 Determination of flutamide
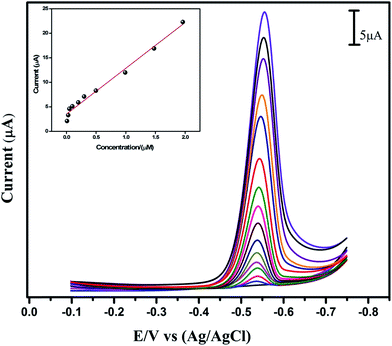
Under optimum CV experimental conditions, linear sweep voltammetry (LSV) measurements were carried out at the GO modified GCE in the presence of different concentrations of anti-cancer drug flutamide (from 0.009 to 14.7 μM) in 0.05 M PB solution (pH 7) and the performances of various flutamide concentrations have been depicted in Fig. 6. When a proper concentration of flutamide was added into the 0.05 M PB solution of pH 7, the cathodic peak currents (Ipc) increased steadily, thereby indicating that GO modified GCE was able to catalyze flutamide efficiently. A linear relationship was obtained between the concentrations of flutamide vs. Ipc (inset, Fig. 6) and the linear range from 0.009 to 1.9 μM. From the calibration plot, linear regression equation can be expressed as I (μA) = 9.345 + 3.512 (μM) (R2 = 0.986) and the limit of detection (LOD) was estimated as 6 nM. The sensitivity of the GO modified GCE electrode was 29.55 (μA μM−1 cm−2). In addition to this, a comparison of the proposed sensor with other reported methods (including electrochemical methods) for the detection of flutamide has also been carried out, and the results are summarized in Table S1.†![[thin space (1/6-em)]](https://www.rsc.org/images/entities/char_2009.gif) 40–45 Compared to other electrochemical methods, the proposed method demonstrated higher sensitivity, wide linear response range, lower LOD and very simple electrode fabrication process. Moreover, the proposed sensor was applied in real samples such as in rat brain, kidney and human blood serum samples.
40–45 Compared to other electrochemical methods, the proposed method demonstrated higher sensitivity, wide linear response range, lower LOD and very simple electrode fabrication process. Moreover, the proposed sensor was applied in real samples such as in rat brain, kidney and human blood serum samples.
3.6 Selectivity, stability, repeatability and reproducibility studies
Selectivity is a very important phenomenon for the newly developed electrochemical sensor and biosensor. The selectivity of GO modified RDE towards detection of anti-cancer drug flutamide in the presence of biologically co-active species was investigated and is presented in Fig. S1.† The GO modified RDE demonstrated well-defined response observed in the each addition of flutamide (a), whereas no noteworthy responses were observed for 30 fold excess concentrations of biologically co-active species such as uric acid (b), glucose (c), ascorbic acid (d), dopamine (e), and catechol (f). At the same time, a quick response was monitored upon the addition of flutamide even in the presence of aforementioned biologically co-active substances into 0.05 M PB (pH 7) electrolyte solution. The obtained results indicate that GO modified RDE displays excellent selectivity towards the detection of anti-cancer drug flutamide.The operational stability of the sensor was investigated by amperometric (i–t) technique. Fig. S2† has shown the amperometric current response of GO modified RDE, which revealed sharp responses for the additions of 6 μM flutamide in 0.05 M PB solution (pH 7). Afterwards, the steady state current was achieved for 2000 s, and only 3.0% of current response was decreased from its original current response after 2000 s. This indicates that GO modified RDE flutamide sensor electrode has excellent operational stability. To investigate the reproducibility and repeatability, we preferred to use three independent GCEs for the detection of flutamide, which illustrated an appreciable reproducibility with relative standard deviation (RSD) of 2.5%. Furthermore, the repeatability for five successive measurements with RSD of 3.4% in the determination of flutamide using GO modified GCE indicates a good repeatability of the proposed sensor. It was observed from these results that GO modified GCE demonstrated good selectivity, stability, reproducibility and repeatability towards the detection of the anti-cancer drug flutamide.
3.7 Real sample analysis
The practicability of the developed sensor was demonstrated in biological samples such as kidney and brain blood samples of rat and human blood serum sample. These samples were flutamide free. Furthermore, 5 mM of stock solution was prepared by injecting known concentrations of flutamide into these real samples. Subsequently, the amperometric experiment was carried out using real samples by adopting experimental conditions of the lab sample analysis. As shown in Fig. S3,† for each aliquot of the lab sample (a), human serum (b) kidney (c) and brain (d) samples, the proposed GO modified RDE was able to produce quick and sensitive signals. The proposed GO modified RDE flutamide sensor electrode attained acceptable recovery ranging from 98.6% to 99.6% for biological samples. Hence, the proposed sensor was able to determine flutamide in biological samples.4. Conclusion
In summary, we developed a novel and simple approach for the selective and sensitive electrochemical detection of the anti-cancer drug flutamide at GO modified GCE in human and rat blood serum samples with acceptable recoveries. GO has illustrated efficient electro catalytic activity through EIS, CV, LSV and amperometric (i–t) methods. Being employed as an electrochemical biosensor for the detection of flutamide, modified GCE has shown noteworthy sensitivity, good stability, selectivity, repeatability, reproducibility, wide linear response range and low detection limit. The obtained results suggest that GO can be used as an advanced carbon-based electrode active material for the selective determination of flutamide.References
- S. Moller, P. Iversen, M. B. Franzmann and S. Mller, J. Hepatol., 1990, 10, 346–349 CrossRef CAS PubMed.
- S. H. Jackson and S. J. Barker, Anesthesiology, 1995, 82, 1065–1067 CrossRef CAS PubMed.
- P. D. Tzanavaras and D. G. Themelis, J. Pharm. Biomed. Anal., 2007, 43, 1820–1824 CrossRef CAS PubMed.
- P. Nagaraja, K. R. Sunitha and M. F. Silwadi, J. Pharm. Biomed. Anal., 2000, 23, 617–622 CrossRef CAS PubMed.
- D. Farthing, D. Sica, I. Fakhry, D. L. Walters, E. A. Cefali and G. Allan, Biomed. Chromatogr., 1994, 8, 251–254 CrossRef CAS PubMed.
- R. Karthik, R. Sasikumar, S. M. Chen, J. Vinoth Kumar, A. Elangovan, V. Muthuraj, P. Muthukrishnan, F. M. A. Al-Hemaid, M. A. Ali and M. S. Elshikh, J. Colloid Interface Sci., 2017, 487, 289–296 CrossRef CAS PubMed.
- R. Karthik, N. Karikalan, S. M. Chen, P. Gnanaprakasam and C. Karuppiah, Microchim. Acta, 2017, 184(2), 507–514 CrossRef CAS.
- X. Sun, Z. Liu, K. Welsher, J. T. Robinson, A. Goodwin and S. Zaric, Nano Res., 2008, 1, 203–212 CrossRef CAS PubMed.
- J. Liu, L. Cui and D. Losic, Acta Biomater., 2013, 9, 9243–9257 CrossRef CAS PubMed.
- S. J. Jeon, S. Y. Kwak, D. Yim, J. M. Ju and J. H. Kim, J. Am. Chem. Soc., 2014, 136, 10842–10845 CrossRef CAS PubMed.
- J. B. Jasinski, D. Ziolkowska, M. Michalska, L. Lipinska, K. P. Korona and M. Kaminska, RSC Adv., 2013, 3, 22857–22862 RSC.
- X. Yang, Y. Tu, L. Li, S. Shang and X. M. Tao, ACS Appl. Mater. Interfaces, 2010, 2, 1707–1713 CAS.
- K. V. Maheshkumar, K. Krishnamurthy, P. Sathishkumar, S. Sahoo, E. Uddin and S. K. Pal, Polym. Compos., 2014, 35, 2297–2310 CrossRef CAS.
- H. Zhang, X. Zhang, D. Zhang, X. Sun, H. Lin and C. Wang, J. Phys. Chem. B, 2013, 117, 1616–1627 CrossRef CAS PubMed.
- J. Pyun, Angew. Chem., Int. Ed., 2011, 50, 46–48 CrossRef CAS PubMed.
- C. Janáky and C. Visy, Anal. Bioanal. Chem., 2013, 405, 3489–3511 CrossRef PubMed.
- C. Jiang, S. Markutsya, Y. Pikus and V. V. Tsukruk, Nat. Mater., 2004, 3, 721–728 CrossRef CAS PubMed.
- S. C. Pang, M. A. Anderson and T. W. Chapman, J. Electrochem. Soc., 2000, 147, 444–450 CrossRef CAS.
- L. Zhang, Y. Wen, Y. Yao, J. Xu, X. Duan and G. Zhang, Electrochim. Acta, 2014, 116, 343–354 CrossRef CAS.
- L. Zhibo, Y. Wang, X. Zhang, Y. Xu, Y. Chen and J. Tian, Appl. Phys. Lett., 2009, 94(2), 021902 CrossRef.
- C. Gómez-Navarro, R. T. Weitz, A. M. Bittner, M. Scolari, A. Mews and M. Burghard, Nano Lett., 2007, 7(11), 3499–3503 CrossRef PubMed.
- E. S. Bober, Final report on reverse osmosis membranes containing graphitic oxide, U.S. Dept. of the Interior, 1970, p. 116 Search PubMed.
- Y. Su, V. G. Kravets, S. L. Wong, J. Waters, A. K. Geim and R. R. Nair, Nat. Commun., 2014, 5, 4843 CrossRef CAS PubMed.
- L. Tang, X. Li, R. Ji, K. S. Teng, G. Tai and J. Ye, J. Mater. Chem., 2012, 22, 5676 RSC.
- L. David and G. Singh, J. Phys. Chem. C., 2014, 118, 28401–28408 CAS.
- X. Zheng, B. Jia, H. Lin, L. Qiu, D. Li and M. Gu, Nat. Commun., 2015, 6, 8433 CrossRef CAS PubMed.
- Z. Yin, S. Sun, T. Salim, S. Wu, X. Huang and Q. He, ACS Nano, 2010, 4, 5263–5268 CrossRef CAS PubMed.
- Y. Shao, J. Wang, H. Wu, J. Liu, I. A. Aksay and Y. Lin, Electroanalysis, 2010, 22, 1027–1036 CrossRef CAS.
- P. Sharma, S. K. Tuteja, V. Bhalla, G. Shekhawat, V. P. Dravid and C. R. Suri, Biosens. Bioelectron., 2013, 39, 99–105 CrossRef CAS PubMed.
- H. Gao and H. Duan, Biosens. Bioelectron., 2015, 65, 404–419 CrossRef CAS PubMed.
- W. S. Hummers and R. E. Offeman, J. Am. Chem. Soc., 1958, 80, 1339 CrossRef CAS.
- B. Liang, W. Zhan, G. Qi, S. Lin, Q. Nan and Y. Liu, J. Mater. Chem. A, 2015, 3(9), 5140–5147 CAS.
- R. Jain, A. Sinha and A. L. Khan, Mater. Sci. Eng., C, 2016, 65, 205–214 CrossRef CAS PubMed.
- M. Behzadi and M. Mirzaei, J. Chromatogr. A, 2016, 1443, 35–42 CrossRef CAS PubMed.
- B. Zhang, L. Li, Z. Wang, S. Xie, Y. Zhang and Y. Shen, Mater. Chem., 2012, 22, 7775–7781 RSC.
- D. C. Marcano, D. V. Kosynkin, J. M. Berlin, A. Sinitskii, Z. Sun and A. Slesarev, ACS Nano, 2010, 4, 4806–4814 CrossRef CAS PubMed.
- Y. Song, M. Feng and H. Zhan, Electrochem. Commun., 2015, 56, 38–42 CrossRef CAS.
- D. A. Skoog, Fundamentals of Analytical Chemistry, Grupo Editorial Norma, 2004 Search PubMed.
- R. Karthik, J. V. Kumar, S. M. Chen, C. Karuppiah, Y. H. Cheng and V. Muthuraj, ACS Appl. Mater. Interfaces, 2017, 9, 6547–6559 CAS.
- F. Ahmadi, J. B. Raoof, R. Ojania, M. Baghayeria, M. M. Lakouraj and H. Tashakkorian, Chin. J. Catal., 2015, 36, 439–445 CrossRef CAS.
- M. J. Chaichi, S. N. Azizi and M. Heidarpour, Spectrochim. Acta, Part A, 2013, 116, 594–598 CrossRef CAS PubMed.
- A. A. P. Khan, K. Anish, A. M. Asiri, S. A. Khan and A. Mohd, Arabian, J. Chem., 2014 DOI:10.1016/j.arabjc.2014.07.011.
- P. K. Brahman, R. A. Dar, S. Tiwari and K. S. Pitre, Colloids Surf., A, 2012, 396, 8–15 CrossRef CAS.
- E. Hammam, H. S. El-Desoky, K. Y. El-Baradie and A. M. Beltagi, Can. J. Chem., 2004, 82(9), 1386–1392 CrossRef CAS.
- Y. M. Temerk, H. S. M. Ibrahim and W. Schuhmann, Electroanalysis, 2016, 28, 372–379 CrossRef CAS.
- W. Yuwei, F. Bai, H. Cao, J. Li, H. Liu and P. Gramatica, Comb. Chem. High Throughput Screening, 2015, 18(9), 834–845 CrossRef.
Footnote |
| † Electronic supplementary information (ESI) available. See DOI: 10.1039/c6ra28792a |
| This journal is © The Royal Society of Chemistry 2017 |

