 Open Access Article
Electrodeposition of PtNPs on the LBL assembled multilayer films of (PDDA-GS/PEDOT:PSS)n and their electrocatalytic activity toward methanol oxidation
Hui Li,
Li-Ping Jia *,
Rong-Na Ma,
Wen-Li Jia and
Huai-Sheng Wang*
Department of Chemistry, Liaocheng University, Liaocheng, Shandong 252000, China. E-mail: hswang@lcu.edu.cn; jialiping@lcu.edu.cn; Fax: +86 0635 8239121; Tel: +86 0635 8239121
First published on 14th March 2017
Abstract
In the present work, PDDA-functionalized graphene sheets (PDDA-GS) were prepared by reduction with hydrazine hydrate in situ in the presence of poly(diallyldimethylammonium chloride) (PDDA). The (PDDA-GS/PEDOT:PSS)n multilayer films were fabricated by a layer-by-layer self-assembly technique based on the electrostatic interaction between positively charged PDDA-GS and negatively charged poly(3,4-ethylenedioxythiophene):poly(styrene sulfonate) (PEDOT:PSS). The self-assembly process was characterized by ultraviolet-visible spectroscopy (UV-vis). Pt nanoparticles were electrodeposited in situ on the multilayer films. X-ray diffraction (XRD) analysis and field emission scanning electron microscopy (FE-SEM) were used to characterize the properties of Pt/[(PDDA-GS/PEDOT:PSS)n] multilayer films. Cyclic voltammetry and chronoamperometry were used to study the electrocatalytic activity of Pt/[(PDDA-GS/PEDOT:PSS)n] multilayer films towards methanol oxidation. The results indicated that Pt/[(PDDA-GS/PEDOT:PSS)n] showed high electrocatalytic activity toward methanol oxidation and good tolerance toward carbon monoxide (CO) poisoning. This novel support for Pt nanoparticle catalysts will be promising in the fabrication of fuel cell electrodes and other catalytic devices.
1. Introduction
The direct methanol fuel cell (DMFC) has received much attention in the past few years due to its several advantages such as compact volume, clean and environmentally friendly protection, high power density and use of cheap and abundant methanol as a fuel. Up to now, Pt is still an ideal catalyst for the electrocatalytic oxidation of methanol. However, a pure Pt catalyst is expensive and rare. In addition, methanol anodic oxidation intermediate adsorption and accumulation on the Pt surface cause catalyst poisoning and deactivation and reduce the electrocatalytic activity of electrodes, limiting the performance of a DMFC.1,2 Up to date, the research has been mainly focused on how to improve the anode catalytic efficiency and reduce the cost of Pt-based fuel cell.3,4Catalyst supports have a great influence on the catalytic ability of a Pt catalyst.5–7 Graphene, a two-dimensional honeycomb lattice composed of a single layer of bonded-sp2 carbons, has been attracting more attention in recent years due to its superior electric conductivity, strong mechanical strength, high specific surface area, high electron mobility, and so on.2,8,9 So, graphene is a promising catalyst support in the carbon-based support materials. In recent years researchers have exerted intensive efforts in fabricating nanocomposites or hybrids of graphene doped with metals via various routes. For instance, Li et al. prepared Pt/graphene nanocomposites by reduction of graphite oxide and H2PtCl6 in one pot and the hybrids showed superior catalytic performance toward methanol oxidation.10 Unfortunately, the graphene nanosheets are easy to agglomerate due to the strong π–π stacking interaction between the graphene sheets, which will not only ruin the advantage of high surface area of graphene, but also obstruct the dispersion of Pt nanoparticles on graphene surface.2,4 So the surface modification of graphene is an essential step for obtaining a molecular level dispersion of individual graphene. Poly(diallyldimethylammonium chloride) (PDDA), a positively charged polyelectrolyte, has been found to be attractive for noncovalently functionalizing graphene sheets. PDDA not only could prevent the aggregation of graphene sheets but also improve the solubility of graphene, which will extend the application in biosensing. Wang et al. found that the PDDA-adsorbed graphene electrode showed remarkable ORR electrocatalytic activities.11 Furthermore, the PDDA functionalized graphene sheets are positively charged, which are suitable to assemble multilayer composite films by electrostatic adsorption. Mevold et al. found that the PDDA functionalized graphene sheets can be used as supporting substrate to uniformly embed the negatively AuNPs by ionic binding.12
Poly(3,4-ethylenedioxythiophene):poly(styrene sulfonate) (PEDOT:PSS), is a polyelectrolyte consisting of positively charged conjugated PEDOT and negatively charged saturated PSS. PSS is an anionic polyelectrolyte, which helps to disperse and stabilize PEDOT in water or other solvents. The polymer couple is highly conductive and electrochemical stable in electrolyte. In fact, it is commonly accepted to be more environmentally stable in comparison with other conducting polymers, thus being appealing on a commercial point of view.13 PEDOT:PSS can be used as a strong anionic polyelectrolyte to bind cationic polyelectrolyte through electrostatic forces. Jurin et al. prepared PDDA/PEDOT:PSS multilayer film by layer-by-layer (LBL) assembly method and the physicochemical parameters such as pH, ionic strength were studied in detail.14 Knowles et al. synthesized polyethylenimine-capped platinum nanoparticles (PEI-capped Pt NPs) and fabricated [PEI-capped Pt NPs/(PEDOT:PSS)] multilayers via electrostatic assembly. This multilayer films showed high and stable catalytic activity toward the oxidation of methanol.15
Layer-by-layer (LBL) assembly is a versatile thin-film fabrication method, which allows deposition of oppositely charged species to form multilayer films. Compared with other thin-film fabrication methods, such as electrodeposition, the LBL process allows precise control over the deposition of each component from solution and hence is very useful for fabrication of hybrid films.16–18 Several works have been published about the use of LBL method for applications involving sensors and biosensors,19,20 optical devices,21 immunosensors,22 electrocatalysis,23–25 and other electrochemical devices.26
In this work PDDA functionalized graphene sheets (PDDA-GS) were synthesized and qualified as a component for electrostatic LBL assembly. The (PDDA-GS/PEDOT:PSS)n hybrid films were fabricated through electrostatic LBL assembly of positively charged PDDA-GS and negatively charged PEDOT:PSS. Then the multilayer films were used as a novel catalyst support for electrodeposition of Pt nanoparticles in situ. The results showed that the Pt/[(PDDA-GS/PEDOT:PSS)n] exhibited good electrocatalytic activity for the methanol oxidation and improved tolerance toward CO poisoning.
2. Experimental
2.1 Materials
Graphite powders (325 mesh, 99.9995%) were purchased from Alfa Aesar Company. Poly(diallyldimethylammonium chloride) (PDDA, MW 200![[thin space (1/6-em)]](https://www.rsc.org/images/entities/char_2009.gif) 000–350
000–350![[thin space (1/6-em)]](https://www.rsc.org/images/entities/char_2009.gif) 000 Da) and poly(3,4-ethylenedioxythiophene):poly(p-styrenesulfonate) [(PEDOT:PSS)Na+, 2% wt] were purchased from Tianjin Guangfu chemical reagents company. KMnO4, H2O2 (30%), N2H4·H2O, K2S2O8, P2O5, H2SO4 (98%), HCl, K3Fe(CN)6, K4Fe(CN)6, KCl, and absolute methanol were obtained from Shanghai reagent company. H2PtCl6·6H2O was purchased from Sinopharm Chemical Reagent Co., Ltd. (Shanghai, China). All reagents were of analytical grade and used without further purification. Double distilled water was used in the whole experimental process.
000 Da) and poly(3,4-ethylenedioxythiophene):poly(p-styrenesulfonate) [(PEDOT:PSS)Na+, 2% wt] were purchased from Tianjin Guangfu chemical reagents company. KMnO4, H2O2 (30%), N2H4·H2O, K2S2O8, P2O5, H2SO4 (98%), HCl, K3Fe(CN)6, K4Fe(CN)6, KCl, and absolute methanol were obtained from Shanghai reagent company. H2PtCl6·6H2O was purchased from Sinopharm Chemical Reagent Co., Ltd. (Shanghai, China). All reagents were of analytical grade and used without further purification. Double distilled water was used in the whole experimental process.
2.2 Instrumentation
Images of field emission scanning electron microscope (FE-SEM) were observed on a JSM-7500F field emission scanning electron microanalyzer (JEOL, Japan). Transmission electron microscope (TEM) images were obtained on a JEM-2100 electron microscope operating at 200 kV (JEOL Ltd., Japan). X-ray diffraction (XRD) patterns were measured on Bruker D8 (with a Cu Ka radiation) instrument. The UV-vis absorption spectra were obtained using a Shimadzu UV-2550 spectrophotometer. Raman spectra were recorded on an RM3000-514 Laser Raman Spectrometer (Renishaw Instruments, England) with 514 nm laser excitation. The Fourier-transform infrared spectroscopy (FT-IR) spectra were recorded with a FT6700 instrument in KBr matrix. Zeta potential measurements were performed using a Zetasizer Nano-ZS (Malvern Instruments Ltd., Westborough, MA).All electrochemical measurements were performed on a CHI760 electrochemical workstation (Shanghai, China) with a conventional three-electrodes system composed of a platinum auxiliary, a Ag/AgCl (saturated KCl) reference, and a glassy carbon working electrode.
2.3 Preparation of PDDA functionalized graphene
Graphite oxide (GO) was prepared from purified natural graphite by the Hummers method.27 Subsequently, the homogeneous GO dispersion (1 mg mL−1, 50 mL) was mixed with 1 mL PDDA (20%) solution and stirred for 30 min. The resulting mixture was further treated with 1.5 mL hydrazine hydrate and allowed to react for 3 h at 100 °C in Teflon autoclave. Finally, the black PDDA-functionalized graphene (PDDA-GS) was collected by centrifugation at 10![[thin space (1/6-em)]](https://www.rsc.org/images/entities/char_2009.gif) 000 rpm for 10 min and further washed with water.
000 rpm for 10 min and further washed with water.
2.4 Preparation of (PDDA-GS/PEDOT:PSS)n multilayer films
For layer-by-layer self-assembly, the substrate (glassy carbon electrode (GCE), indium tin oxide (ITO) or quartz slide) was dipped in PDDA-GS aqueous solution (2 mg mL−1) for 30 min, followed by rinsing with double distilled water and drying with high-purity nitrogen steam. Then, PDDA-GS adsorbed electrode was dipped in PEDOT:PSS aqueous solution (1%) for 30 min, rinsed with double distilled water, and dried with high-purity nitrogen steam. Thus, the bilayer film was obtained. By repeating the above process, the subsequent multilayer films (designated as (PDDA-GS/PEDOT:PSS)n) were prepared.2.5 Electrodeposition of Pt nanoparticles on (PDDA-GS/PEDOT:PSS)n films
Pt nanoparticles were deposited in situ on the surface of (PDDA-GS/PEDOT:PSS)n multilayer films by potentiostatic electrodeposition in a 0.5 M H2SO4 solution containing 1.0 mM H2PtCl6 at −0.25 V for 1200 s. For the purpose of making a comparison, the electrodeposition of platinum on the surface of bare GCE was also prepared under the same conditions.3. Results and discussion
3.1 The design principle of Pt/(PDDA-GS/PEDOT:PSS)n multilayer films
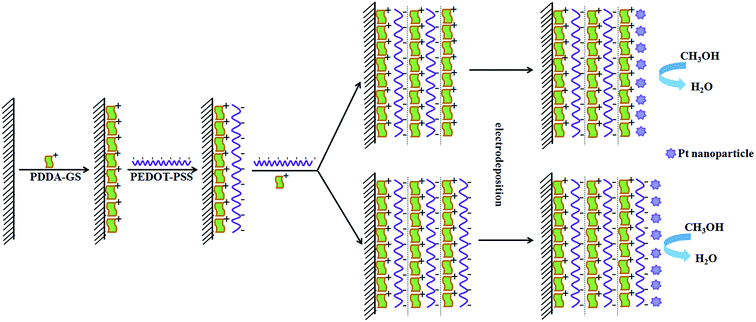
In order to confirm the feasibility of LBL self-assembly, we measured the zeta potential of PDDA-GS and PEDOT:PSS solutions respectively. The results showed that the zeta potential was 35.8 mV for PDDA-GS (pH 7.4) and −49.5 mV for PEDOT:PSS solution (pH 2.2), which indicated that PDDA-GS was positively charged and PEDOT:PSS was negatively charged. So the PDDA-GS and PEDOT:PSS are appropriate for LBL assembly based on the electrostatic interaction. The assembly process is depicted in Scheme 1. Freshly cleaned ITO substrate or pretreated glassy carbon electrode bear negatively charged oxide surfaces. So the substrate is firstly immersed into the solution of positively charged PDDA-GS, which makes the substrate surface positive in charge. Subsequently, the PDDA-GS modified substrate is immersed into the solution of negatively charged PEDOT:PSS, which makes the substrate surface back to a negative state. At this point, the fabrication sequence has generated the first complete bilayer of the two materials. Accordingly, repeating the fabrication cycle n times leads to a multilayer with n bilayers and the multilayer is defined as (PDDA-GS/PEDOT:PSS)n where PEDOT:PSS as outmost layer. If the outmost layer of the multilayer films is PDDA-GS, it is defined as (PDDA-GS)n/(PEDOT:PSS)n−1. Finally, Pt nanoparticles are electrodeposited in situ on the multilayer at −0.25 V.3.2 Characterization of PDDA functionalized graphene
The PDDA-GS was first characterized by TEM (Fig. 1A). The TEM image of PDDA-GS clearly illustrated the flake-like shapes of graphene. The crumpled silk waves that are corrugated and scrolled are intrinsic to graphene nanosheets.28 The UV-vis spectra of graphene oxide (GO) and PDDA-GS are shown in Fig. 1B. GO in water shows two absorption bands at 230 nm and 300 nm corresponding to the π–π* transitions of aromatic C![[double bond, length as m-dash]](https://www.rsc.org/images/entities/char_e001.gif) C bond and n–π transitions of C
C bond and n–π transitions of C![[double bond, length as m-dash]](https://www.rsc.org/images/entities/char_e001.gif) O bond respectively.29 However, the absorption peak of PDDA-GS red-shifts to 265 nm, suggesting that the electronic conjugation within graphene sheets is restored after reduction.30 At the same time, the peak of GO at 300 nm disappears after being reduced, indicating the removal of most oxygen groups. Raman spectroscopy has played an important role in the characterization of graphene. As shown in Fig. 1C, Raman spectra of GO and PDDA-GS both exhibit two prominent peaks at about 1325 cm−1 and 1594 cm−1 corresponding to the well documented D and G bands respectively. However, the D/G intensity ratio increased slightly from GO to graphene, indicating that GO has been well deoxygenated into graphene.31,32 Furthermore, the FT-IR spectra of GO, graphene and PDDA-GS had been studied (Fig. 1D). We can see from Fig. 1D that GO shows a strong peak at around 1625 cm−1 attributable to aromatic C
O bond respectively.29 However, the absorption peak of PDDA-GS red-shifts to 265 nm, suggesting that the electronic conjugation within graphene sheets is restored after reduction.30 At the same time, the peak of GO at 300 nm disappears after being reduced, indicating the removal of most oxygen groups. Raman spectroscopy has played an important role in the characterization of graphene. As shown in Fig. 1C, Raman spectra of GO and PDDA-GS both exhibit two prominent peaks at about 1325 cm−1 and 1594 cm−1 corresponding to the well documented D and G bands respectively. However, the D/G intensity ratio increased slightly from GO to graphene, indicating that GO has been well deoxygenated into graphene.31,32 Furthermore, the FT-IR spectra of GO, graphene and PDDA-GS had been studied (Fig. 1D). We can see from Fig. 1D that GO shows a strong peak at around 1625 cm−1 attributable to aromatic C![[double bond, length as m-dash]](https://www.rsc.org/images/entities/char_e001.gif) C, along with peaks characteristic of C
C, along with peaks characteristic of C![[double bond, length as m-dash]](https://www.rsc.org/images/entities/char_e001.gif) O stretching (1725 cm−1), carboxyl (1382 cm−1), and epoxy (∼1232 cm−1).11 The reduction of GO to graphene was evidenced by the obvious decrease in absorption bands of oxide groups. It can be seen that the adsorption of PDDA did not make much difference to the reduction of GO. The functionalization of graphene with PDDA is only reflected by the appearance of new peaks at around ∼860 and ∼1457 cm−1, attributable to the N–C bond in the adsorbed PDDA.11,33
O stretching (1725 cm−1), carboxyl (1382 cm−1), and epoxy (∼1232 cm−1).11 The reduction of GO to graphene was evidenced by the obvious decrease in absorption bands of oxide groups. It can be seen that the adsorption of PDDA did not make much difference to the reduction of GO. The functionalization of graphene with PDDA is only reflected by the appearance of new peaks at around ∼860 and ∼1457 cm−1, attributable to the N–C bond in the adsorbed PDDA.11,33
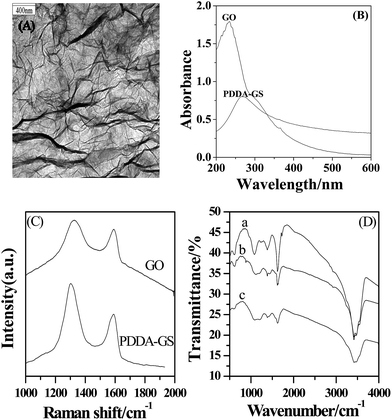 | ||
| Fig. 1 (A) TEM images of PDDA-GS. (B) The UV-vis spectra of GO and PDDA-GS. (C) The Raman spectra of GO and PDDA-GS. (D) The FT-IR spectra of GO (a), PDDA-GS (b) and graphene (c). | ||
3.3 UV-vis of (PDDA-GS/PEDOT:PSS)n multilayer films
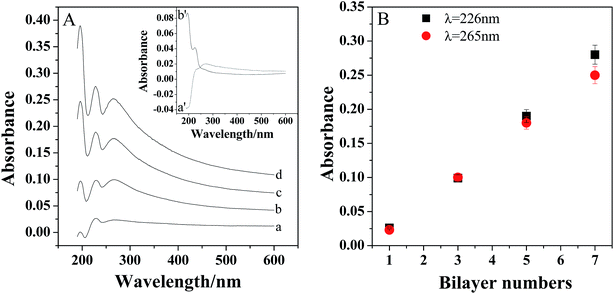
The assembly process was confirmed by the UV-vis absorption spectra. As shown in inset of Fig. 2A, there is an absorption peak appeared at about 265 nm for PDDA-GS (curve a′), which should be ascribed to the graphene sheets.34 And PEDOT:PSS exhibited two peaks at about 195 nm and 226 nm (curve b′), which are attributed to the aromatic ring in PSS.34,35 However, there are three bands located at 195 nm, 226 nm and 265 nm observed for the multilayer films, indicating the successful assembly of PDDA-GS and PEDOT:PSS on the substrate. With the assembly numbers increasing, the peaks intensities increased, suggesting a continuous growth of composite layers with each layer-by-layer deposition step. Furthermore, as shown in Fig. 2B, the absorbance at 226 nm and 265 nm increased linearly with increasing bilayer number, indicating the regular growth of the films.3.4 Characterization of Pt/(PDDA-GS/PEDOT:PSS)n multilayer films
The XRD patterns of ITO (a), PEDOT:PSS/ITO (b), PDDA-GS/ITO (c) and Pt/[(PDDA-GS)3/(PEDOT:PSS)2]/ITO (d) multilayer films are shown in Fig. 3. The 2θ values at 30.2°, 35.5°, and 50.8° are attributed to the (222), (400), (440) crystal face diffraction peaks for ITO, respectively.35 PEDOT:PSS and PDDA-GS showed no obvious diffraction peak (curve b and c). However, as illustrated in Fig. 3d, there are other two major peaks appeared at about 40.4° and 46.8°, corresponding to the (111) and (200) planes of the face-centered cubic structure of Pt, respectively.2 The results proved the successful assembly of multilayer films and the deposition of Pt nanoparticles.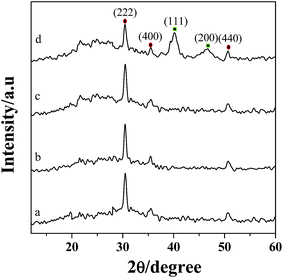 | ||
| Fig. 3 XRD patterns of ITO (a), PEDOT:PSS/ITO (b), PDDA-GS/ITO (c), Pt/[(PDDA-GS)3/(PEDOT:PSS)2]/ITO (d). | ||
The surface morphologies of Pt deposited on ITO, [PDDA-GS/PEDOT:PSS]3/ITO and [(PDDA-GS)3/(PEDOT:PSS)2]/ITO were characterized with FE-SEM. As shown in Fig. 4A, the Pt nanoparticles electrodeposited on bare ITO show irregular nanoflower structure with average diameter of 500–700 nm. Pt nanoparticles deposited on [PDDA-GS/PEDOT:PSS]3 aggregate to form micro-nanoclusters (Fig. 4B). However, As seen in Fig. 4C, the as-prepared product with PDDA-GS as outmost layer consists of a large quantity of microstructures, which are built with many staggered nanoflakes. The unique structure can greatly increase the surface area of Pt clusters. When PDDA functional graphene was as the outmost layer of the multilayer films, negatively charged PtCl62− could easily diffuse into the surface of the multilayer films via the electrostatic interaction. During the electrodeposition process, the quaternary ammonium provides binding sites for anchoring precursor metal ions, resulting in the continuous formation of new nuclei.2 So the characters of deposited substrates would affect the size and morphology of Pt nanoparticles.
 | ||
| Fig. 4 FE-SEM images of (A) Pt/ITO, (B) Pt/[PDDA-GS/PEDOT:PSS]3/ITO, (C) Pt/[(PDDA-GS)3/(PEDOT:PSS)2]/ITO electrodeposited at −0.25 V for 1200 s. | ||
3.5 Methanol oxidation at different modified film
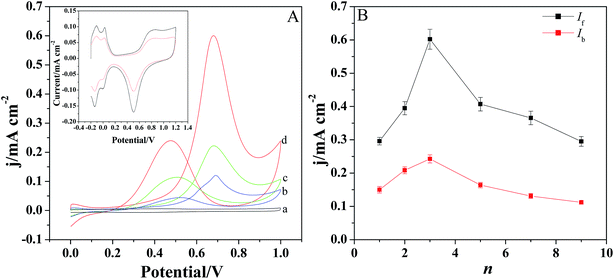
The electrochemical oxidation of methanol was investigated by cyclic voltammetry in the solution containing 0.5 M H2SO4 and 1 M CH3OH (Fig. 5A). Fig. 5A displays the CV behaviors of methanol at different modified electrodes. It is evident that there are two anodic peaks observed for Pt/GCE, Pt/[(PDDA-GS)3/(PEDOT:PSS)2]/GCE and Pt/[PDDA-GS/PEDOT:PSS]3/GCE. However, [(PDDA-GS)3/(PEDOT:PSS)2]/GCE exhibits no electrocatalytic activity toward methanol oxidation (curve a), indicating the electrocatalytic function of Pt nanoparticles. The forward anodic peak at about 0.68 V is attributed to the electrooxidation of methanol and the peak current density is defined as the forward anodic peak current density (If). In the reverse potential scan (from 1.2 V to 0.0 V), a peak appears at about 0.47 V and the peak current density is designated as the backward anodic peak current density (Ib). The backward anodic peak is attributed to the oxidation of COads-like species, which are generated from the incomplete oxidation of methanol during the forward potential scan.36 As shown in Fig. 5A, the Pt/[(PDDA-GS)3/(PEDOT:PSS)2]/GCE electrode shows the highest peak current and the greatest negative shift of the forward and backward peak potentials. The forward anodic peak current density for Pt/(PDDA-GS)3/(PEDOT:PSS)2/GCE is 0.61 mA cm−2, which is about 1.27 and 5.54 times as high as that of the Pt/[PDDA-GS/PEDOT:PSS]3/GCE (0.48 mA cm−2) and Pt/GCE (0.11 mA cm−2), respectively. Interestingly, Pt nanoparticles exhibits higher electrocatalytic activity with PDDA-GS as the outmost layer. This may be attributed to the exclusive interaction between the negatively charged PSS and PtCl62− ions, which resulted in the less deposition quantities of Pt nanoparticles and the lower electrochemical surface area. It is known that the electrochemically active surface area (ECSA) of Pt particles is an important parameter to determine the catalytic activity. CV is a convenient and efficient tool to estimate ECSA on an electrode, which can not only provide the electrochemical active sites of the catalyst, but also compare the difference between catalysts.37 The inset of Fig. 5A shows the cyclic voltammetry curves of the Pt/[(PDDA-GS)3/(PEDOT:PSS)2]/GCE and Pt/[PDDA-GS/PEDOT:PSS]3/GCE in 0.5 M H2SO4 aqueous solutions. It can be seen that both electrodes presented two pairs of hydrogen adsorption/desorption peaks at −0.2 to 0.1 V. Platinum hydroxide (Pt–OH) and oxide (Pt–O) formed in the 0.60–1.1 V range, and was reduced at 0.503 V. The ECSA values of Pt/[(PDDA-GS)3/(PEDOT:PSS)2] and Pt/[(PDDA-GS)3/(PEDOT:PSS)3] were estimated by a calculation from the charges of the hydrogen adsorption/desorption peaks.38 And the ECSAs of Pt/[(PDDA-GS)3/(PEDOT:PSS)2] and Pt/[(PDDA-GS)3/(PEDOT:PSS)3] electrodes were determined to be 69.8 and 32.8 m2 g−1, respectively. The higher ECSA of Pt/[(PDDA-GS)3/(PEDOT:PSS)2] electrode was likely due to the high specific area of PDDA-GS, the small size of Pt nanoparticles, and the highly Pt-loadings on the (PDDA-GS)3/(PEDOT:PSS)2 matrix.Fig. 5B displays the forward and backward anodic peak current density (If and Ib) of methanol oxidation at Pt/[(PDDA-GS)n/(PEDOT:PSS)n−1]/GCE with different layers. With the self-assembly layer (n) increasing, the peak current density increases at first and then decreases. And the best catalytic performance is obtained when n = 3.
In general, the ratio of If to Ib can be used to explain the catalyst tolerance to CO and other carbonaceous species. A large ratio of If/Ib represents a more complete methanol oxidation, less accumulation of CO-like species on the catalyst surface, and thus a better CO-tolerance. As shown in Fig. 5B, Pt/[(PDDA-GS)3/(PEDOT:PSS)2] have a If/Ib ratio of 2.48, which is much higher than that of carbon black supported Pt-NPs (1.73),37 graphene-supported Pt (1.35)39 and carbon-nanotube-supported Pt (0.75) catalyst,40 indicating the superior antipoisoning behavior. A comparison for the electroanalytical performance toward methanol electrooxidation between the present work and reported methods are listed in Table 1. It can be concluded that the present work showed higher ECSAs and larger ratio of If/Ib, which may be attributed to the high conductivity of PEDOT, the large surface area of PDDA-GS and the wide dispersion of Pt nanoparticles on the substrate of [(PDDA-GS)3/(PEDOT:PSS)2].
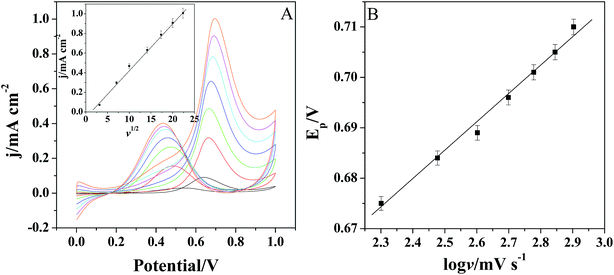
Fig. 6A shows the cyclic voltammograms of Pt/(PDDA-GS)3/(PEDOT:PSS)2/GCE to methanol oxidation at different scan rates. It indicates that the forward peak current density If is positively proportional to the square root of scan rate (inset of Fig. 6A), suggesting that the oxidation of methanol at electrode is a diffusion controlled process. According to the ref. 47 and 48 the removal of CO adsorbed on the surface of catalyst is the rate-controlling step for methanol oxidation reaction, and the reaction is described as: COads + H2O → CO2 + 2H+ + 2e−. It can be seen from Fig. 6B that the peak potential (Ep) is linearly proportional to the logarithm of scan rate. According to the Lavirons equations:49  the electron transfer coefficient (α) can be calculated, which is often used to characterize the effect of potential on the reaction activation energy. A smaller α value indicates a lower activation energy and an easier reaction.49 According to the Lavirons equations, the α was calculated to be 0.486, indicating a faster removal of COads on the surface of catalyst.
3.6 The stability of the modified electrode
The catalytic activity and stability of the catalyst are usually characterized with chronoamperometry method. Fig. 7 shows the chronoamperometry curves of different films modified electrodes in 0.5 M H2SO4 and 1.0 M CH3OH solutions under a constant potential of 0.65 V for 600 s. As shown in Fig. 7, the currents decrease rapidly for Pt, Pt/[(PDDA-GS)3/(PEDOT:PSS)2] and Pt/[PDDA-GS/PEDOT:PSS]3 catalyst in the initial period, which may be due to the formation of intermediate species, such as COads, COOHads, and CHOads during the methanol oxidation reaction.44 Among the three catalyst, the Pt/[(PDDA-GS)3/(PEDOT:PSS)2] maintained the highest current density and the lowest rate of current decay over time, which is consistent with that obtained from the CVs of methanol electrooxidation. These results indicate that the Pt/[(PDDA-GS)3/(PEDOT:PSS)2]/GCE displayed the best electrocatalytic performance and tolerance toward CO poisoning of all the catalysts. The enhanced catalytic activity and stability may be attributed to the superior electric conductivity of graphene and PEDOT, and the high Pt loading of PDDA-GS.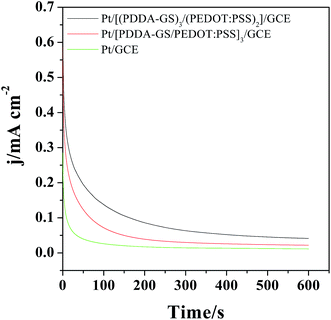 | ||
| Fig. 7 Chronoamperometric curves of the different films modified electrode in 0.5 M H2SO4 + 1 M CH3OH at 0.65 V for 600 s. | ||
4. Conclusion
In the present work, the [PDDA-GS/PEDOT:PSS]n multilayer film was prepared by LBL method based on the electrostatic interaction. The multilayer film was used as a new kind of catalyst support for the preparation of Pt nanoparticles through in situ electrodeposition. Compared with Pt/GCE, the Pt/[PDDA-GS/PEDOT:PSS]n/GCE showed higher catalytic activity toward the methanol oxidation. This may be attributed to the high conductivity of PDDA-GS and PEDOT in promoting the methanol oxidation process. More interestingly, the outmost layer characters of [PDDA-GS/PEDOT:PSS]n multilayer film effect not only the size and morphology of Pt nanoparticles but also the catalytic performance of the catalyst to the methanol oxidation. The results showed that Pt nanoparticles exhibits higher electrocatalytic activity with PDDA-GS as the outmost layer, which may be attributed to the electrostatic interaction between the positively charged PDDA and PtCl62− ions, which resulted in the more deposition quantities of Pt nanoparticles and the larger electrochemical surface area. Furthermore, the ratio of If/Ib of the Pt/[(PDDA-GS)3/(PEDOT:PSS)2]/GCE toward methanol oxidation is much higher than that of the commercial Pt/C catalysts, and carbon nanotubes. The method developed in this work provides a general route for preparing various multilayer films as the support of Pt nanoparticles.Acknowledgements
This work is supported by the Natural Science Foundation of China (No. 21405070, 21427808, 21505063 & 21375055) and Natural Science Foundation (ZR2015BQ007) of Shandong Province.References
- J. R. C. Salgado, F. Alcaide, G. álvarez, L. Calvillo, M. J. Lázaro and E. Pastor, J. Power Sources, 2010, 195, 4022–4029 CrossRef CAS.
- X. M. Huang, Z. S. Li, X. F. Zhang, X. L. He and S. Lin, J. Colloid Interface Sci., 2013, 393, 300–305 CrossRef CAS PubMed.
- H. J. Huang, H. Q. Chen, D. P. Sun and X. Wang, J. Power Sources, 2012, 204, 46–52 CrossRef CAS.
- Y. C. Xin, J. G. Liu, Y. Zhou, W. M. Liu, J. A. Gao, Y. Xie, Y. Yin and Z. G. Zou, J. Power Sources, 2011, 196, 1012–1018 CrossRef CAS.
- J. Prabhuram, T. S. Zhao, Z. K. Tang, R. Chen and Z. X. Liang, J. Phys. Chem. B, 2006, 110, 5245–5252 CrossRef CAS PubMed.
- P. Hernández-Fernández, R. Nuño and E. Fatás, Int. J. Hydrogen Energy, 2011, 36, 8267–8278 CrossRef.
- A. V. Rozhkov, G. Giavaras, Y. P. Bliokh, V. Freilikher and F. Nori, Phys. Rep., 2011, 503, 77–114 CrossRef CAS.
- S. Guo and S. Dong, Chem. Soc. Rev., 2011, 40, 2644–2672 RSC.
- X. Huang, Z. Yin, S. Wu, X. Qi, Q. He, Q. Zhang, Q. Yan, F. Boey and H. Zhang, Small, 2011, 7, 1876–1920 CrossRef CAS PubMed.
- Y. M. Li, L. H. Tang and J. H. Li, Electrochem. Commun., 2009, 11, 846–849 CrossRef CAS.
- S. Y. Wang, D. S. Yu, L. M. Dai, D. W. Chang and J. B. Baek, ACS Nano, 2011, 5, 6202–6209 CrossRef CAS PubMed.
- A. H. H. Mevold, W. W. Hsu, A. Hardiansyah, L. Y. Huang, M. C. Yang, T. Y. Liu, T. Y. Chan, K. S. Wang, Y. A. Su, R. J. Jeng, J. K. Wang and Y. L. Wang, Nanoscale Res. Lett., 2015, 10, 397–403 CrossRef PubMed.
- Y. J. Xia, K. Sun and J. Y. Ouyang, Energy Environ. Sci., 2012, 5, 5325–5332 CAS.
- F. E. Jurin, C. C. Buron, N. Martin and C. Filiâtre, J. Colloid Interface Sci., 2014, 431, 64–70 CrossRef CAS PubMed.
- K. R. Knowles, C. C. Hanson, A. L. Fogel, B. Warhol and D. A. Rider, ACS Appl. Mater. Interfaces, 2012, 4, 3575–3583 CAS.
- N. Joseph, P. Ahmadiannamini, R. Hoogenboom and I. F. J. Vankelecom, Polym. Chem., 2014, 5, 1817–1831 RSC.
- S. A. Castleberry, W. Li, D. Deng, S. Mayner and P. T. Hammond, ACS Nano, 2014, 8, 6580–6589 CrossRef CAS PubMed.
- H. Ling, L. Liu, P. S. Lee, D. Mandler and X. H. Lu, Electrochim. Acta, 2015, 174, 57–65 CrossRef CAS.
- F. N. Crespilho, F. Huguenin, V. Zucolotto, P. Olivi, F. C. Nart and O. N. Oliveira Jr, Electrochem. Commun., 2006, 8, 348–352 CrossRef CAS.
- F. N. Crespilho, V. Zucolotto, J. R. Siqueira Jr, C. J. L. Constantino, F. C. Nart and O. N. Oliveira Jr, Environ. Sci. Technol., 2005, 39, 5385–5389 CrossRef CAS PubMed.
- M. Altman, A. D. Shukla, T. Zubkov, G. Evmenenko, P. Dutta and M. E. van der Boom, J. Am. Chem. Soc., 2006, 128, 7374–7382 CrossRef CAS PubMed.
- C. F. Ou, R. Yuan, Y. Q. Chai, M. Y. Tang, R. Chai and X. L. He, Anal. Chim. Acta, 2007, 603, 205–213 CrossRef CAS PubMed.
- F. N. Crespilho, M. E. Ghica, M. Florescu, F. C. Nart, O. N. Oliveira Jr and C. M. A. Brett, Electrochem. Commun., 2006, 8, 1665–1670 CrossRef CAS.
- F. N. Crespilho, V. Zucolotto, O. N. Oliveira Jr and F. C. Nart, Int. J. Electrochem. Sci., 2006, 1, 194–214 CAS.
- F. N. Crespilho, V. Zucolotto, J. R. Siqueira Jr, A. F. J. Carvalho, F. C. Nart and O. N. Oliveira Jr, Int. J. Electrochem. Sci., 2006, 1, 151–159 CAS.
- L. P. Lu, S. Q. Wang and X. Q. Lin, Anal. Chim. Acta, 2004, 519, 161–166 CrossRef CAS.
- W. S. Hummers and R. E. Offeman, J. Am. Chem. Soc., 1958, 6, 1339 CrossRef.
- J. C. Meyer, A. K. Geim, M. I. Katsnelson, K. S. Novoselov, T. J. Booth and S. Roth, Nature, 2007, 446, 60–63 CrossRef CAS PubMed.
- Y. Zhou, Q. Bao, L. A. L. Tang, Y. Zhong and K. P. Loh, Chem. Mater., 2009, 21, 2950–2956 CrossRef CAS.
- D. Li, M. B. Müller, S. Gilje, R. B. Kaner and G. G. Wallace, Nat. Nanotechnol., 2008, 3, 101–105 CrossRef CAS PubMed.
- S. Stankovich, D. A. Dikin, R. D. Piner, K. A. Kohlhaas, A. Kleinhammes, Y. Y. Jia, Y. Wu, S. T. Nguyen and R. S. Ruoff, Carbon, 2007, 45, 1558–1565 CrossRef CAS.
- Y. X. Xu, H. Bai, G. W. Lu, C. Li and G. Q. Shi, J. Am. Chem. Soc., 2008, 130, 5856–5857 CrossRef CAS PubMed.
- Y. Y. Yu, Z. G. Chen, B. B. Zhang, X. C. Li and J. B. Pan, Talanta, 2013, 112, 31–36 CrossRef CAS PubMed.
- A. Rani, K. A. Oh, H. Koo, H. J. Lee and M. Park, Appl. Surf. Sci., 2011, 257, 4982–4989 CrossRef CAS.
- Z. Y. Sun, J. B. He, A. Kumbhar and J. Y. Fang, Langmuir, 2010, 26, 4246–4250 CrossRef CAS PubMed.
- M. S. Wietecha, J. Zhu, G. H. Gao, N. Wang, H. Feng, M. L. Gorring, M. L. Kasner and S. F. Hou, J. Power Sources, 2012, 198, 30–35 CrossRef CAS.
- M. M. Zhang, J. M. Xie, Q. Sun, Z. X. Yan, M. Chen and J. J. Jing, Int. J. Hydrogen Energy, 2013, 38, 16402–16409 CrossRef CAS.
- A. Pozio, M. De Francesco, A. Cemmi, F. Cardellini and L. Giorgi, J. Power Sources, 2002, 105, 13–19 CrossRef CAS.
- A. Bragaru, E. Vasile, C. Obreja, M. Kusko, M. Danila and A. Radoi, Mater. Chem. Phys., 2014, 146, 538–544 CrossRef CAS.
- Y. J. Gu and W. T. Wong, Langmuir, 2006, 22, 11447–11452 CrossRef CAS PubMed.
- Q. Liang, L. Zhang, M. Cai, Y. Li, K. Jiang, X. Zhang and P. K. Shen, Electrochim. Acta, 2013, 111, 275–283 CrossRef CAS.
- R. Kiyani, S. Rowshanzamir and M. J. Parnian, Energy, 2016, 113, 1162–1173 CrossRef CAS.
- B. M. Luo, S. Xu, X. B. Yan and Q. J. Xue, J. Electrochem. Soc., 2013, 160, F262–F268 CrossRef CAS.
- Y. Hu, P. Wu, H. Zhang and C. Cai, Electrochim. Acta, 2012, 85, 314–321 CrossRef CAS.
- J. P. Zhong, Y. J. Fan, H. Wang, R. X. Wang, L. L. Fan, X. C. Shen and Z. J. Shi, J. Power Sources, 2013, 242, 208–215 CrossRef CAS.
- H. Wang, J. Du, Z. Yao, R. Yue, C. Zhai, F. Jiang, Y. Du, C. Wang and P. Yang, Colloids Surf., A, 2013, 436, 57–61 CrossRef CAS.
- G. Wu, L. Li and B. Q. Xu, Electrochim. Acta, 2004, 50, 1–10 CrossRef CAS.
- Z. B. Wang, Z. P. Yin and Y. Y. Shao, J. Power Sources, 2007, 165, 9–15 CrossRef CAS.
- E. Laviron, J. Electroanal. Chem., 1979, 100, 263–270 CrossRef CAS.
| This journal is © The Royal Society of Chemistry 2017 |

