 Open Access Article
Self-assembly of porous CuO nanospheres decorated on reduced graphene oxide with enhanced lithium storage performance†
Gangyong Li,
Mingjun Jing*,
Zhengu Chen,
Binhong He,
Minjie Zhou and
Zhaohui Hou *
*
School of Chemistry and Chemical Engineering, Hunan Institute of Science and Technology, Yueyang 414006, China. E-mail: zhaohuihou@126.com; jingmingjun86@163.com
First published on 7th February 2017
Abstract
This work aims at enhancing the cycling stability and rate capability of a CuO-based anode material for lithium-ion batteries. Here porous CuO nanospheres decorated on reduced graphene oxide (CuO-NSs/RGO) have been synthesized by a two-step thermal treatment procedure. The porous CuO nanospheres are assembled by ultra-fine nanoparticles of CuO with a size of ∼15 nm. Such a porous nature endows many merits, improving the lithium storage performances of the CuO-NSs/RGO composite used as a lithium-ion battery anode. The porous CuO-NSs/RGO composite demonstrates superior reversible capacity (753.3 mA h g−1 at 100 mA g−1) and good cycling stability (616.2 mA h g−1 after 200 cycles at 500 mA g−1). In particular, it exhibits an outstanding high-rate capability of 327.3 mA h g−1 even at 5 A g−1. The feasibility of the CuO-NSs/RGO composite as an anode material was further investigated with a commercial LiFePO4 (LFP) cathode for lithium-ion batteries.
Introduction
Transition-metal oxides (TMOs) have great potential as anode candidates for high-performance lithium-ion batteries (LIBs) due to their large theoretical specific capacity based on the reversible electrochemical conversion reaction with lithium.1–7 CuO, as a member of the TMO family, has attracted significant attention because of its remarkably high theoretical capacities (672 mA h g−1), nontoxic nature, and eco-friendliness.8–10 However, given its intrinsic properties (e.g., inferior electrical conductivity, low lithium diffusivity, large volume expansion and contraction during lithiation/delithiation), CuO as anode electrode for LIBs has limitations, including large initial irreversible capacity loss, poor cycling stability, and undesirable rate performance.11,12 To tackle these drawbacks and improve the electrochemical properties, designing novel electrode materials with advanced structures is critical for CuO anodes. To date, porous CuO nanorods,8 hierarchical CuO microspheres,13 urchin-like and shuttle-like CuO,14 nanoplate-like CuO,15 CuO nanowire,16 and leaf-like CuO17 have been synthesized and exhibit enhanced anodic performance due to their improved electrical/ionic conductivity and mechanical stability. In addition, another effective strategy is to incorporate carbonaceous material into the nanocomposites, such as pyrolysis carbon,11 carbon nanotubes,18–21 and graphene.12,22–24 Among these carbonaceous materials, graphene as a one-atom-thick layer of carbon is now becoming one of the most attractive matrices owing to its superior electrical, mechanical and chemical properties.25,26 Recently, it has been widely used as a matrix to fabricate nanostructured hybrid anodes to boost the performance of CuO anode electrodes.13,22–24 In our previous work, we reported an ultra-short rice-like CuO nanorods/RGO composite with a high reversible specific capacity of 762.6 mA h g−1 at a charge rate of 100 mA g−1 after 100 cycles.27 We found that the small dimensional CuO nanorods combined with conductive graphene sheets exhibited high specific capacity and good cyclic stability. However, it is still a big challenge to obtain the high-rate capability of CuO-based anodes.Recently, many studies demonstrated that porous structures provide significant advantages to enhance the lithium storage performance of electroactive materials because of its large surface area and high porosity, which can restrain the huge volume change and offer good surface contact between the electrolyte and the electrode.11,28–30 For example, Wang et al.6 synthesized porous CuO nanorods and achieved 654 mA h g−1 at a charge rate of 0.5C for 200 cycles. Yuan et al.31 fabricated 3D porous SnO2–Fe2O3 composite via an electrostatic spray deposition technique; they show enhanced lithium storage performance because of the synergistic effect between the Fe2O3 and the SnO2, and also the 3D hierarchical porous structure. Currently, Mohapatra et al.32 prepared mulberry-like porous CuO and CuO nanoplate, which found that the mulberry-like porous CuO electrode exhibited higher capacity in starting several cycles than that of the CuO nanoplate electrode because of the porous architecture of the electrode. However, this CuO sample showed poor cyclic stability due to its structural instability during cycling. Thus, it is expected that porous CuO nanostructures modified via the flexible and conductive graphene sheets could display favorable anodic performances for LIB anode. However, to this day, the reports about the preparation of porous CuO-based anodes for LIBs are still rare, especially for self-assembly porous CuO/graphene composite.
In this work, a facile two-step thermal treatment procedure for the synthesis of porous CuO-NSs decorated on RGO nanosheets was firstly reported. The porous CuO-NSs with a homogeneous size of ∼100 nm, are assembled by the ultra-fine nanoparticles of CuO with a size of around 10–15 nm. The as-prepared CuO-NSs/RGO composite possesses the combined merits of graphene and the porous shape of CuO, which can display the following advantages: (i) the electrical conductivity and structural stability of the porous CuO-NSs/RGO can be enhanced through the conductive and flexible graphene; (ii) the porous characteristics of CuO can shorten the diffusion distance for Li+ ions and buffer the large volume change during cycling. Hence, the porous CuO-NSs/RGO composite can deliver large reversible specific capacity, long cycling lifespan, and outstanding high-rate performance for lithium storage.
Results and discussion
The synthesis process of the porous CuO-NSs/RGO composite is shown in Fig. 1. The preparation of the solution of Cu2+ ions in toluene in detail is illustrated in Fig. S1 of ESI Materials.† Firstly, the solution of Cu2+ ions in toluene was prepared by a modification of the procedure reported by Yang et al.34 In this case, cetyltrimethyl ammonium bromide (CTAB) was served as stabilizer to promote the dispersion of GO in toluene to form a homogeneous GO suspension. Taking advantage of the abundant oxygen functional groups, Cu2+ ions can be tightly adsorbed on the surface of GO sheets due to electrostatic interaction. Subsequently, Cu2O nanoparticles were grown uniformly on RGO sheets via chemical reduction with hydrazine hydrate as reductant. Finally, the porous CuO-NSs/RGO composite was obtained after thermally treated the resultant Cu2O/RGO composite under air atmosphere.The crystalline structure of the as-made products was investigated by XRD characterization, which is given in Fig. 2a. After chemical reduction, the pattern shows that cubic Cu2O phase (JCPDS No. 05-0667) was formed. After thermal treatment, the pattern verifies the formation of monoclinic CuO phase (JCPDS No. 48-1548). The diffraction peak at ∼26° can be assigned to RGO nanosheets, and no characteristic diffraction peak of GO at ∼10° can be observed (Fig. S2 of ESI Materials†), indicating the effective reduction from GO to RGO by hydrazine hydrate. The structure change of the samples can be further investigated by FTIR and Raman spectroscopy, which is shown in Fig. 2b and c. As presented in Fig. 2b, the adsorption peaks at 3420, 1730, and 1630 cm−1 of the GO sample could be assigned to the characteristic peak of hydroxy stretching vibrations, carbonyl stretching vibrations, and unoxidized graphitic domains or adsorbed water, respectively, consisting well with previous reports.35,36 As regards the CuO-NSs/RGO composite, the adsorption peak of hydroxy was attenuated, and the peak of carbonyl groups was disappeared in both RGO and CuO-NSs/RGO composite, indicating that GO could be effectively reduced into RGO. The significant structural change of GO after the two-step thermal treatment procedure was further demonstrated by Raman spectroscopy. Fig. 2c shows that two main typical peaks located at ∼1580 and ∼1350 cm−1 in the Raman spectra of the three samples are assigned to the and G band and D, respectively. It is generally believed that a high increased value of ID/IG (intensity ratio of D band to G band) results in more disordered carbon atoms in graphene materials.35–38 The Raman spectra of the as-synthesized products show the higher ID/IG values of CuO-NSs/RGO composite (1.23) and RGO nanosheets (1.41) than that of in GO (1.02), suggesting that the structure of GO has been changed significantly after the two-step thermal treatment, and a high defective nature of CuO-NSs/RGO composite was obtained. The existence of defects can be helpful to improve the ability of interfacial lithium storage capacity of LIBs.
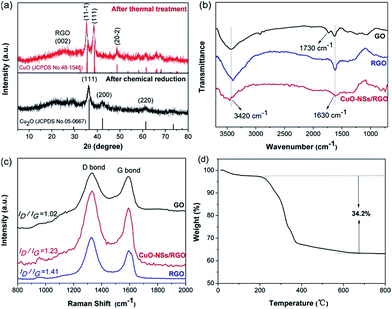 | ||
| Fig. 2 (a) XRD patterns of the as-prepared samples; (b) FTIR and (c) Raman spectra of GO, RGO, and CuO-NSs/RGO composite; (d) TGA curves of the CuO-NSs/RGO composite. | ||
The amount of graphene in the CuO-NSs/RGO composite was calculated by TGA, as presented in Fig. 2d. The small weight lose about 2.5% below 200 °C could be ascribed to the evaporation of physical absorbed water. The weight decreased dramatically in the range from 250 to 400 °C and then remained unchanged till 800 °C, which could be attributed to the oxidation of the RGO nanosheets upon exposure to air. Thus the content of RGO in the CuO-NSs/RGO composite is evaluated as ∼34.2 wt%. Such an acceptable amount of RGO nanosheets in the CuO-NSs/RGO composite, on the one hand, endows the composite a good electronic conductivity, and effectively suppresses the pulverization and aggregation of CuO-NSs during the cycling process. On the other hand, the sufficient CuO in the composite ensures high capacity.
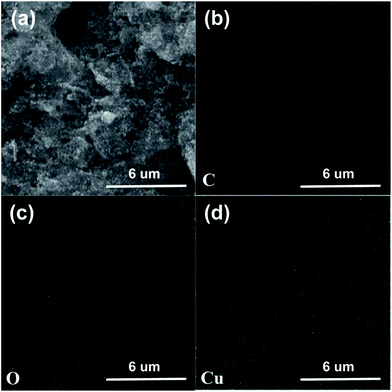
The morphologic characteristics of the as-prepared CuO-NSs/RGO composite are shown in Fig. 3. SEM images (Fig. 3a–c) reveal that the porous CuO-NSs and RGO nanosheets in this composite are interconnected well, and the porous CuO-NSs are uniformly supported on or wrapped in the RGO nanosheets. The SEM images of the Cu2O/RGO composite (Fig. S3 of ESI Materials†) show a similar morphology as the CuO-NSs/RGO composite, indicating no significant changes for the morphologies of the products after chemical reduction and thermal treatment. Fig. 4 shows the elemental mapping of the CuO-NSs/RGO composite. It can be obviously observed that the elements C (Fig. 4b), O (Fig. 4c) and Cu (Fig. 4d) are uniformly distributed on the composite. EDS pattern of the composite, as shown in Fig. S4,† also confirms the existence of the three elements.
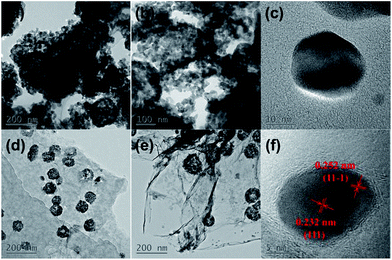
The detailed micromorphologies of the products were investigated by TEM and are presented in Fig. 5. Fig. 5a and b show that the pristine CuO is randomly aggregated by ultra-fine CuO nanoparticles due to the high surface energy,39 and only few spherical secondary aggregates can be found. Fig. 5c shows that the size of the primary CuO nanoparticle is ∼30 nm.
The porous feature of the CuO-NSs/RGO composite was observed in Fig. 5d and e, which displays that the porous CuO-NSs have a homogeneous size of ∼100 nm, and are homogeneously decorated on RGO nanosheets. Simultaneously, Fig. 5e reveals that the porous CuO-NSs were loosely and orderly aggregated by the primary ultra-fine CuO nanoparticles with high surface energies to form porous structured secondary aggregates. For one thing, such unique porous nanostructured morphology can buffer the volume expansion and contraction during lithiation and delithiation process. More importantly, the structural stability of porous CuO-NSs could be significantly enhanced by introducing the flexible RGO nanosheets. For another, the multi-dimensional channels for electron transport and Li+ ion diffusion can be offered, so the structure of CuO-NSs/RGO composite can be beneficial to facilitate the permeation of electrolyte and apparently improve the rate capability. The HRTEM image of individual ultra-fine CuO nanoparticle in the composite is presented in Fig. 5f, which shows that the primary nanosized CuO particles have a diameter of around 15 nm. The distinct lattice distances of 0.252 and 0.232 nm, corresponding to the (11−1) and (111) lattice planes of monoclinic CuO, respectively, which is coincide well with the XRD peaks (Fig. 2a). Noting that the size of the individual CuO nanoparticle in CuO-NSs/RGO composite is smaller than that of in pristine CuO. The possible explanation is that, after the mix of the solution of Cu2+ ions in toluene and the GO suspension, Cu2+ ions were adsorbed on the surface of GO sheets due to the electrostatic interactions, thus the concentration of the free Cu2+ ions in toluene was decreased. The adsorbed Cu2+ ions on GO sheet could act as the heterogeneous nucleation sites so that the size of the individual CuO nanoparticle in the CuO-NSs/RGO composite is smaller than that of in pristine CuO.
N2 sorption measurements were operated to further analyze the pore structure of the as-synthesized samples. Fig. 6a shows the N2 adsorption–desorption isotherms of the samples, which are of type IV with a distinct hysteresis, indicating the porous features of the products. The specific surface area of the CuO-NSs/RGO composite calculated by Brunauer–Emmett–Teller (BET) method is 61.9 m2 g−1, and the Barrett–Joyner–Halenda (BJH) desorption cumulative pore volume of the CuO-NSs/RGO composite is 0.28 cm3 g−1, which is larger than those of in pristine CuO (15.6 m2 g−1, 0.09 cm3 g−1) and RGO nanosheets (4.7 m2 g−1, 0.05 cm3 g−1). The CuO-NSs/RGO composite possesses large specific surface area, which could be ascribed to the synergistic effect between the porous CuO-NSs and the RGO nanosheets. The RGO nanosheets served as substrate for the ordered agglomeration of primary CuO nanoparticles to form porous spherical secondary agglomerates. At the same time, the re-stacking of RGO nanosheets could be inhibited by the porous CuO-NSs, resulting in a high specific surface area of the porous CuO-NSs/RGO composite. However, pristine CuO was severely and disorderly agglomerated due to its high surface energy and small size effect as demonstrated in Fig. 5a and b, and the small specific surface area of RGO is mainly caused by the re-stacking of graphene nanosheets owing to the recovery of π–π conjugated system from the GO sheets upon chemical reduction.40
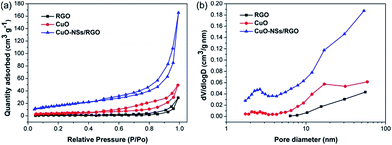 | ||
| Fig. 6 (a) N2 adsorption–desorption isotherms and (b) BJH pore size distribution curves of the as-synthesized samples. | ||
The pore size distribution curves of the as-prepared products were obtained using BJH model, which are shown in Fig. 6b. The porous CuO-NSs/RGO composite exhibits a small portion of pores centred at 2.6 nm and a majority of pores in the range of 10–60 nm. The pores size centred at 2.6 nm may be generated by the slit of CuO-NSs originated from the self-assembly of ultra-fine nanoparticles of CuO, while the wide pores size distribution of 10–60 nm could be attributed to the pore formation between the porous CuO-NSs and the RGO sheets.41 By contrast, the pore size distribution curves of pristine CuO and RGO demonstrate the small amount of meso- and macropores formed. So it is believed that the lithium storage performances of the porous CuO-NSs/RGO composite could be significantly enhanced because of their porous characteristics.
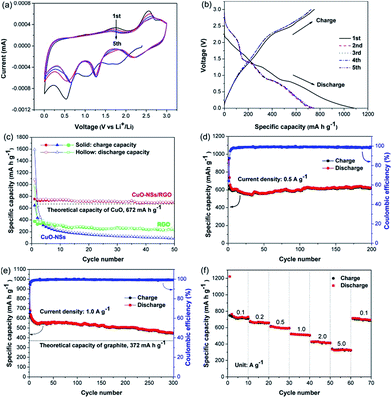
The electrochemical performance of the porous CuO-NSs/RGO composite anode was firstly detected by cyclic voltammetry (CV) tests, which is displayed in Fig. 7a. In the first cathodic sweep, three well-resolved reduction peaks at ∼2.0, 1.2, and 0.5 V were attributed to the formation of CuII1−xCuIxO1−x/2 phase, the creation of Cu2O phase, and then decomposed into Cu and Li2O, respectively.10,13,16 The reduction peak at ∼0.5 V also involves the growth of a solid electrolyte interface (SEI) film over the surface of electrode. In the following anodic sweep, three distinctive oxidation peaks at around 1.6, 2.5 (strong) and 2.9 V (weak) can be observed, which could be assigned to the partial decomposition of SEI layer, the formation of Cu2O, and the conversion of Cu2O into CuO, respectively.11 In the following scanning, the three reduction peaks overlap very well starting from the second cycle, however, with little shift to high potential region because of the formation of SEI film resulted by the partial decomposition of electrolyte,42,43 indicating that the overpotential of discharge process gradually decreased within the increased cycle number. For the three oxidation peaks, the individual peak area is decreased, implying reversible capacity loss. Fig. 7b depicts the initial five cycles galvanostatic charging and discharging curves of the porous CuO-NSs/RGO composite at 0.1 A g−1. Plateaus at around 2.0, 1.2, and 0.7 V in the initial discharging curve, and at around 1.6, 2.5, and 2.9 V during the first charging curve indicate a multi-step electrochemical reactions of CuO.44 The first-cycle discharge capacity of the CuO-NSs/RGO composite is 1085.3 mA h g−1 with a reversible capacity of 753.3 mA h g−1, corresponding to a first-cycle coulombic efficiency of 69.4%. The high initial irreversible capacity loss of the porous CuO-NSs/RGO composite is mainly attributed to the formation of SEI layer, the irreversible insertion of Li+ ions into RGO scaffolds, and the partial decomposition of electrolyte.10,16 It should be noting that the conversion of Cu into CuO is incomplete, which causes a number of Li+ ions could not participate in the subsequent electrochemical reaction, leading to the irreversible capacity loss.45,46 Fig. 7c depicts the comparative cyclic performance of the porous CuO-NSs/RGO composite, pristine CuO, and RGO sheets electrode at 0.1 A g−1. The pristine CuO electrode can deliver a high first-cycle discharge capacity of 1593.5 mA h g−1 with a reversible capacity of 646.2 mA h g−1. But the discharge capacity sharply decreased to 88 mA h g−1 after 50 cycles. This result could be attributed to the structure collapse and/or pulverization of CuO during charge/discharge process, which might make the electroactive CuO material fall away from the current collector. As evidenced in Fig. S5 of ESI Materials,† the separators were peeled down from the cells after 50 cycles. It can be observed that the separator obtained from a pristine CuO cell was coated with brown materials. However, the separator from a CuO-NSs/RGO composite cell still remains the same color as the pristine separator, indicating the structural stability and integrity of the porous CuO-NSs/RGO electrode. For the RGO electrode, a high first-cycle discharge capacity of 976.4 mA h g−1 was delivered. However, the charge capacity was gradually decreased from 1st cycle (376.2 mA h g−1) to 50th cycle (228.5 mA h g−1), which could be caused by the re-stacking of graphene nanosheets. By contrast, the porous CuO-NSs/RGO electrode exhibits a higher reversible capacity, and a lower irreversible capacity loss than those of the pristine CuO electrode. The coulombic efficiency of the CuO-NSs/RGO electrode at first cycle is 69.4%, and then increased dramatically to 96.9% in the 2nd cycle and near ∼99% after the subsequent cycles, indicating its remarkable reversibility. The capacity retention of 90.6% was achieved after 50 cycles (692.8 mA h g−1), suggesting the stable cyclability of the porous CuO-NSs/RGO composite electrode.
To further demonstrate the stable cycling performance of the porous CuO-NSs/RGO composite electrode, the cells were measured at a high charge rate of 0.5 and 1.0 A g−1 with prolonged cycles. Fig. 7d and e show that the initial discharge and charge capacities at 0.5 A g−1 are 948.8 and 608.1 mA h g−1, and at 1 A g−1 are 968.6 and 643.7 mA h g−1, with a first-cycle coulombic efficiency of 64.1% and 66.5%, respectively. The CuO-NSs/RGO composite electrode exhibited perfect cycling stability, with no capacity lose at 0.5 A g−1 after 200 cycles (616.2 mA h g−1 for the 200th cycle). Even at high charge rate of 1 A g−1, the reversible capacity after 300 cycles can still achieve 446 mA h g−1, demonstrating its good specific capacity retention and enhanced cyclic stability. The morphology of the composite after 200 cycles at 0.5 A g−1 was observed through ex situ SEM. Fig. S6† presents the SEM images of the composite before and after cycling. Noting that the composite can maintain its structural integrity after 200 cycles, suggesting the structural stability of the composite.
Fig. 7f shows the rate capability of the porous CuO-NSs/RGO composite electrode. The battery was cycled at different charge rates range from 0.1 to 5.0 A g−1, and maintained at 10 cycles for each charge rate. It was found that the porous CuO-NSs/RGO composite electrode exhibited an outstanding high-rate capability. The average reversible capacities at 0.1, 0.2, 0.5, 1.0, and 2.0 A g−1 are 720.8, 659.4, 599.1, 514.5, and 419.9 mA h g−1 respectively. Even at a high charge rate of 5 A g−1, an average reversible capacity of 329.4 mA h g−1 can still be obtained. When the current density was reset to 0.1 A g−1, an average reversible capacity of 696.1 mA h g−1 was still obtained, suggesting good reversibility. Compared with some other CuO-based anodes as presented in Table S1,† the porous CuO-NSs/RGO composite possesses excellent rate performance when served as a LIB anode. The prominent lithium storage properties of the composite could be mainly attributed to the synergistic effect between the porous CuO-NSs and RGO nanosheets, as schematically illustrated in Fig. 8. First, the porous architecture of CuO-NSs was given by the self-assembly of ultra-fine CuO nanoparticles, which is beneficial to the electrolyte permeation from outside into inside of CuO. Furthermore, the Li+ ion diffusion length and the electron transfer distance could also be shortened due to the porous structure, resulting in an ability of rapid charge/discharge. Additionally, a good conductive network for the fast electron transfer could be formed by the introduction of RGO nanosheets, which also serve as cushions to relieve the stress caused by the huge volume change of CuO-NSs upon cycling, thus enhancing the structural integrity and stability of the composite.
 | ||
| Fig. 8 Schematic illustration of the lithiation/delithiation process of the porous CuO-NSs/RGO composite. | ||
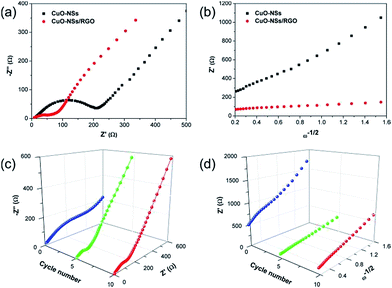
To further understand the reason why the composite electrode exhibited such good lithium storage performances, in particular, the high-rate capability, a comparative study of EIS between the characteristics of pristine CuO electrode and the porous CuO-NSs/RGO composite electrode has been proposed. Nyquist plots of the pristine CuO and the porous CuO-NSs/RGO composite electrode obtained at full charge state after five cycles and are shown in Fig. 9a. It can be seen from the electrochemical impedance spectra (EIS) that the shape of the Nyquist plots is similar, a depressed semicircle followed by a sloped line. The depressed semicircle in the high- and medium-frequency region represents the charge-transfer process, involving the total resistance come from the SEI film and the interior of the electrode. While the sloped line in low frequencies associates with Li+ ion diffusion within the electrode.10,15 As seen in Fig. 9a, the depressed semicircle of the CuO-NSs/RGO electrode is far smaller than that of pristine CuO electrode, suggesting a low resistance for the CuO-NSs/RGO electrode. The relationship between Z′ and ω−1/2 after 5 cycles is presented in Fig. 9b. Z′ is the real part of the impedance spectra, and ω is the angular frequency, provided by ω = 2πf. The low slope of Z′ versus ω−1/2 indicates a high Li+ ion diffusion rate.12,47 It can be seen that the slope of the porous CuO-NSs/RGO electrode is much lower than the pristine CuO electrode, suggesting a high Li+ ion diffusion rate was achieved in the CuO-NSs/RGO electrode, which could be attributed to the well-conductive network in the composite with the introduction of high-conductivity of RGO nanosheets. Thus, the total resistance of the CuO-NSs/RGO electrode could be reduced and the migration rate of Li+ ions could also be significantly enhanced. Fig. 9c shows a comparative EIS analysis of the porous CuO-NSs/RGO composite before and after different cycles. It can be observed that the depressed semicircle of the CuO-NSs/RGO electrode is dramatically reduced after 5 cycles due to the electrochemical activation process of the electrode. However, it becomes larger after 10 cycles, which could be caused by the continuous growth of the SEI film.50,51 Fig. 9d presents the corresponding relationship between Z′ and ω−1/2. The slope of Z′ versus ω−1/2 after 5 and 10 cycles is much lower than that of before cycling, indicating that the fast Li+ ion diffusion rate is achieved after cycling.52
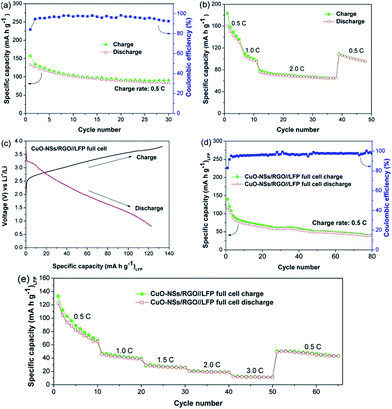
To verify the viability of the porous CuO-NSs/RGO composite as prospective anode for LIBs, CuO-NSs/RGO//LFP full cells were assembled by using the porous CuO-NSs/RGO composite anodes and commercial LFP cathodes. Fig. 10 depicts the electrochemical performance of the LFP half-cell and the CuO-NSs/RGO//LFP full cell. The cycling performance of the LFP half-cell was firstly examined, as shown in Fig. 10a. The reversible specific capacity gradually decreased from 1st cycle (132.4 mA h g−1) to 30th cycle (83.6 mA h g−1) at 0.5C (1C = 170 mA g−1). Fig. 10b shows the rate performance of the LFP half-cell. The LFP half-cell delivers a reversible capacity of 160.8 mA h g−1 at 0.5C, when the charge rate increased to 2C, the capacity drastically decreased to ∼90 mA h g−1. Fig. 10c presents the initial galvanostatic charge and discharge curves of the CuO-NSs/RGO//LFP full cell at 0.5C cycling between 0.8 and 3.8 V. The full cell gives a first charging and discharging capacities of 133.2 and 122.6 mA h g−1, respectively, with an initial coulombic efficiency of as high as 92%. It should be pointed out that the electrochemical activation process of anode electrode remarkably enhanced the coulombic efficiency of the CuO-NSs/RGO//LFP full cell because it can compensate the loss of lithium during the formation of SEI layer or other side reactions. The cycling performance of the CuO-NSs/RGO//LFP full cell at 0.5C is shown in Fig. 10d. The full cell exhibited large capacity loss from 116.3 to 39.6 mA h g−1 after 80 cycles, which could be mainly caused by the restricted source of Li from cathode side (cathode limited).48
The rate capability of the CuO-NSs/RGO//LFP full cell was also examined (Fig. 10e). The full cell delivered an average reversible capacities of 84.5, 41.6, 27.0, 19.4 and 11.6 mA h g−1 at 0.5, 1.0, 1.5, 2.0 and 3.0C, respectively. It is found that the rate property of the CuO-NSs/RGO//LFP full cell is not in agreement with those of CuO-NSs/RGO half-cell but consistent well with those of LFP half-cell. This result could be attributed to the following reasons. On the one hand, lithium source is limited by the LFP cathode in the full cell. But for the half-cell, Li foil as the counter/reference electrode can provide excess Li+ ions, which is in favor of improving the electrochemical reaction kinetics of the cell. On the other hand, it is believed that the rate property of the CuO-NSs/RGO//LFP full cell is affected by both of CuO-NSs/RGO anode based on the conversion reaction and LFP cathode based on the insertion/deinsertion mechanism.49 Thus, the incompatibilities of the conversion reaction ratio and the insertion/deinsertion degree make the CuO-NSs/RGO//LFP full cell an unsatisfied rate property.
Conclusions
In summary, porous CuO-NSs/RGO composite was synthesized through a two-step thermal treatment procedure. It was found that the porous CuO-NSs are assembled by the ultra-fine CuO nanoparticles, and are homogeneously decorated on RGO nanosheets. The as-made porous CuO-NSs/RGO composite was used as a LIB anode, which exhibited superior anodic properties, including high reversible specific capacity, enhanced cyclic stability, and outstanding high-rate capability, which could be ascribed to the synergistic effect between the porous CuO-NSs and the flexible and well-conductive RGO nanosheets. The feasibility of the porous CuO-NSs/RGO composite as anode for LIBs was investigated with commercial LFP cathode. These results show that by further engineering the full cell design, the porous CuO-NSs/RGO composite can be a promising anode material for high-performance LIBs.Experimental
Synthesis of graphene oxide
Graphene oxide (GO) was prepared by a chemical oxidation process of graphite flakes (99.8%, Alfa Aesar) using a modified Hummers' method.33 Briefly, graphite flakes (1 g) was mixed with concentrated H2SO4 (25 mL) in a 250 mL of round-bottom flask under stirring with ice-water bath. KMnO4 powder (3 g) was then slowly added into the mixture, and stirring was continued for 2 h. The mixture was then kept at 35 °C for 30 min of stirring. Next, ultra-pure water (100 mL) was slowly poured into the mixture with cold-water bath and then moved in oil-bath pot and heated to 90 °C for 15 min under stirring. Afterwards, the mixture was poured into a 500 mL of beaker, 5 mL of H2O2 (30%) was then added into the mixture under stirring and a brilliant yellow solution was formed. The solution was centrifuged and washed with HCl aqueous (1 mol L−1) and ultra-pure water. After the washing process, the resultant GO suspension was obtained. The aqueous GO suspension was then freeze-dried using a lyophilizer. After lyophilization, low-density and loosely packed GO was obtained.Preparation of pristine CuO and porous CuO-NSs/RGO composite
Pristine CuO was synthesized by a facile two-step thermal treatment procedure. First, the solution of Cu2+ ions in toluene was prepared by a modification of the procedure reported by Yang et al.34 Typically, 1 mM of Cu(NO3)2·3H2O was dissolved in ultra-pure water (50 mL) in a 300 mL of beaker, ethanol (50 mL) containing 1 mL of dodecylamine (DDA) was then poured into the Cu2+ aqueous solution. After stirring for 3 min, toluene (50 mL) was then added into the beaker, and stirring was continued for 1 min. A few minutes later, the aqueous phase was complete color bleached, which indicates that Cu2+ ions were transferred from water to toluene. The upper layer of the solution of Cu2+ ions in toluene was transferred into another container, 1 mL of hydrazine hydrate was added. After stirring for 30 min, the mixture was then placed in oven at 50 °C for 1 h. The final precipitates were collected by centrifugation, washed with absolute alcohol, and dried at 50 °C. The CuO-NSs were then obtained after thermally treated the final precipitates in a muffle furnace at 300 °C for 2 h.The synthesis of porous CuO-NSs/RGO composite is similar to the pristine CuO. Typically, CTAB (0.795 g) was firstly dissolved into 50 mL of toluene. Then, 20 mg of as-obtained lyophilized GO was added into the above solution, with ultrasonic treatment for 2 h to form a homogeneous GO suspension. The solution of Cu2+ ions in toluene was then poured into the GO suspension under stirring. Afterwards, hydrazine hydrate (1 mL) was injected into the mixture, and stirring was maintained for 30 min. The overall mixture was then placed in oven at 50 °C for 1 h. The final precipitates were collected by centrifugation, washed with absolute alcohol, and dried at 50 °C. The powder was ground in an agate mortar and then placed in a muffle furnace at 200 °C for 2 h to obtain the porous CuO-NSs/RGO composite.
RGO nanosheets were synthesized as the similar procedure as the CuO-NSs/RGO composite but in the absence of the solution of Cu2+ ions in toluene.
Characterization
![[thin space (1/6-em)]](https://www.rsc.org/images/entities/char_2009.gif) :
:![[thin space (1/6-em)]](https://www.rsc.org/images/entities/char_2009.gif) 1
1![[thin space (1/6-em)]](https://www.rsc.org/images/entities/char_2009.gif) :
:![[thin space (1/6-em)]](https://www.rsc.org/images/entities/char_2009.gif) 1 (by volume) mixture of DMC/EMC/EC (DMC = dimethyl carbonate, EMC = ethyl methyl carbonate, EC = ethylene carbonate) as the electrolyte. The recharge properties were investigated on a cell test system (Land CT2001A) in the voltage range from 0.005 to 3 V (vs. Li/Li+). CV and EIS were tested on an electrochemical working station (CHI 660B). EIS measurements were operated at a perturbation amplitude of 5 mV in the frequency between 0.01 and 100 kHz. CV tests were measured at a scanning rate of 0.5 mV s−1 within a voltage between 0.005 and 3 V.
1 (by volume) mixture of DMC/EMC/EC (DMC = dimethyl carbonate, EMC = ethyl methyl carbonate, EC = ethylene carbonate) as the electrolyte. The recharge properties were investigated on a cell test system (Land CT2001A) in the voltage range from 0.005 to 3 V (vs. Li/Li+). CV and EIS were tested on an electrochemical working station (CHI 660B). EIS measurements were operated at a perturbation amplitude of 5 mV in the frequency between 0.01 and 100 kHz. CV tests were measured at a scanning rate of 0.5 mV s−1 within a voltage between 0.005 and 3 V.Full cells were assembled by using porous CuO-NSs/RGO composite as anode and commercial LFP as cathode. The LFP cathodes were prepared by casting the slurry containing LFP powder (80 wt%), conducting acetylene black (15 wt%), and PVDF (5 wt%) in NMP onto Al foil and dried in vacuum at 110 °C overnight to evaporate the solvent. Before assembling full cells, the CuO-NSs/RGO anodes were pretreated to decrease the large initial irreversible capacity through an electrochemical activation process. The loading masses of CuO-NSs/RGO anode and LFP cathode were about 0.7 and 1.8 mg cm−2, respectively. The as-assembled full cell was tested between 0.8 and 3.8 V, and the specific capacity of full cells was calculated based on cathode mass.
Acknowledgements
The authors are thankful for the financial support of the National Natural Science Foundation of China (No. 51238002, No. 51372080, and No. 51272075), and the Scientific Research Project of Education Department of Hunan Province (No. 16C0717). The authors also thank Dr Fan-Yan Zeng at Jiangxi Normal University for SEM and TEM analyses.Notes and references
- P. Poizot, S. Laruelle, S. Grugeon, L. Dupont and J. M. Tarascon, Nature, 2000, 407, 496–499 CrossRef CAS PubMed.
- M. V. Reddy, G. V. Subba Rao and B. V. R. Chowdari, Chem. Rev., 2013, 113, 5364–5457 CrossRef CAS PubMed.
- Z. Y. Wang, L. Zhou and X. W. (David) Lou, Adv. Mater., 2012, 24, 1903–1911 CrossRef CAS PubMed.
- A. K. Mondal, D. W. Su, S. Q. Chen, X. Q. Xie and G. X. Wang, ACS Appl. Mater. Interfaces, 2014, 6, 14827–14835 CAS.
- F. X. Ma, H. Hu, H. B. Wu, C. Y. Xu, Z. C. Xu, L. Zhen and X. W. (David) Lou, Adv. Mater., 2015, 27, 4097–4101 CrossRef CAS PubMed.
- M. Zhang, M. D. Cao, Y. M. Fu, L. L. Xing, Q. Wang and X. Y. Xue, Mater. Lett., 2016, 185, 282–285 CrossRef CAS.
- M. D. Cao, M. Zhang, L. L. Xing, Q. Wang and X. Y. Xue, J. Alloys Compd., 2017, 694, 30–39 CrossRef CAS.
- L. L. Wang, H. X. Gong, C. H. Wang, D. K. Wang, K. B. Tang and Y. T. Qian, Nanoscale, 2012, 4, 6850–6855 RSC.
- Z. C. Bai, Y. W. Zhang, Y. H. Zhang, C. L. Guo and B. Tang, Electrochim. Acta, 2015, 159, 29–34 CrossRef CAS.
- R. B. Wu, X. K. Qian, F. Yu, H. Liu, K. Zhou, J. Wei and Y. Z. Huang, J. Mater. Chem. A, 2013, 1, 11126–11129 CAS.
- T. Chen, Y. Hu, B. R. Cheng, R. P. Chen, H. L. Lv, L. B. Ma, G. Y. Zhu, Y. R. Wang, C. Z. Yan, Z. X. Tie, Z. Jin and J. Liu, Nano Energy, 2016, 20, 305–314 CrossRef CAS.
- G. D. Park and Y. C. Kang, Chem.–Eur. J., 2015, 21, 9179–9184 CrossRef CAS PubMed.
- L. Shi, X. X. Fu, C. Y. Fan, S. Q. Yu, G. D. Qian and Z. Y. Wang, RSC Adv., 2015, 5, 85179–85186 RSC.
- L. Q. Lu and Y. Wang, Electrochem. Commun., 2012, 14, 82–85 CrossRef CAS.
- F. Janene, H. Dhaouadi, L. Arfaoui, N. Etteyeb and F. Touati, Ionics, 2016, 22, 1395–1403 CrossRef CAS.
- R. P. Zhang, J. Liu, H. G. Guo and X. L. Tong, Mater. Lett., 2015, 139, 55–58 CrossRef CAS.
- L. Shi, C. Y. Fan, C. X. Sun, Z. M. Ren, X. X. Fu, G. D. Qian and Z. Y. Wang, RSC Adv., 2015, 5, 28611–28618 RSC.
- Z. C. Bai, Y. W. Zhang, Y. H. Zhang, C. L. Guo and B. Tang, Electrochim. Acta, 2015, 159, 29–34 CrossRef CAS.
- S. F. Zheng, J. S. Hu, L. S. Zhong, W. G. Song, L. J. Wan and Y. G. Guo, Chem. Mater., 2008, 20, 3617–3622 CrossRef CAS.
- J. Y. Xiang, J. P. Tu, J. Zhang, J. Zhong, D. Zhang and J. P. Cheng, Electrochem. Commun., 2010, 12, 1103–1107 CrossRef CAS.
- S. Ko, J. I. Lee, H. S. Yang, S. Park and U. Jeong, Adv. Mater., 2012, 24, 4451–4456 CrossRef CAS PubMed.
- Q. Wang, J. Zhao, W. F. Shan, X. B. Xia, L. L. Xing and X. Y. Xue, J. Alloys Compd., 2014, 590, 424–427 CrossRef CAS.
- Y. Liu, W. Wang, L. Gu, Y. W. Wang, Y. L. Ying, Y. Y. Mao, L. W. Sun and X. S. Peng, ACS Appl. Mater. Interfaces, 2013, 5, 9850–9855 CAS.
- A. K. Rai, L. T. Anh, J. Gim, V. Mathew, J. W. Kang, B. J. Paul, N. K. Singh, J. J. Song and J. Kim, J. Power Sources, 2013, 244, 435–441 CrossRef CAS.
- F. Y. Zeng, Y. F. Kuang, G. Q. Liu, R. Liu, Z. Y. Huang, C. P. Fu and H. H. Zhou, Nanoscale, 2012, 4, 3997–4001 RSC.
- G. Q. Tang, Z. G. Jiang, X. F. Li, H. B. Zhang, A. Dasari and Z. Z. Yu, Carbon, 2014, 77, 592–599 CrossRef CAS.
- G. Y. Li, B. H. He, M. Zhou, G. X. Wang, N. B. Zhou, W. Y. Xu, M. J. Jing and Z. H. Hou, Ionics, 2016 DOI:10.1007/s11581-016-1822-y.
- B. C. Qiu, M. Y. Xing and J. L. Zhang, J. Am. Chem. Soc., 2014, 136, 5852–5855 CrossRef CAS PubMed.
- Z. H. Wen, Q. Wang, Q. Zhang and J. H. Li, Adv. Funct. Mater., 2007, 17, 2772–2778 CrossRef CAS.
- J. S. Zhou, L. L. Ma, H. H. Song, B. Wu and X. H. Chen, Electrochem. Commun., 2011, 13, 1357–1360 CrossRef CAS.
- T. Z. Yuan, Y. Z. Jiang, Y. Li, D. Zhang and M. Yan, Electrochim. Acta, 2014, 136, 27–32 CrossRef CAS.
- S. Mohapatra, S. V. Nair, D. Santhanagopalan and A. K. Rai, Electrochim. Acta, 2016, 206, 217–225 CrossRef CAS.
- W. S. Hummers and R. E. Offeman, J. Am. Chem. Soc., 1958, 80, 1339 CrossRef CAS.
- J. Yang, E. H. Sargent, S. O. Kelley and J. Y. Ying, Nat. Mater., 2009, 8, 683–689 CrossRef CAS PubMed.
- S. Stankovich, D. A. Dikin, R. D. Piner, K. A. Kohlhaas, A. Kleinhammes, Y. Y. Jia, Y. Wu, S. T. Nguyen and R. S. Ruoff, Carbon, 2007, 45, 1558–1565 CrossRef CAS.
- Z. Q. Jiang, Z. J. Jiang, X. N. Tian and L. J. Luo, Electrochim. Acta, 2014, 146, 455–463 CrossRef CAS.
- G. Q. Tang, Z. G. Jiang, X. F. Li, H. B. Zhang, A. Dasari and Z. Z. Yu, Carbon, 2014, 77, 592–599 CrossRef CAS.
- X. W. Liu, Y. Wu, Z. Z. Yang, F. S. Pan, X. W. Zhong, J. Q. Wang, L. Gu and Y. Yu, J. Power Sources, 2015, 293, 799–805 CrossRef CAS.
- D. F. Qiu, B. Zhao, Z. X. Lin, L. Pu, L. J. Pan and Y. Shi, Mater. Lett., 2013, 105, 242–245 CrossRef CAS.
- J. Wang, B. Ding, X. D. Hao, Y. L. Xu, Y. Wang, L. F. Shen, H. Dou and X. G. Zhang, Carbon, 2016, 102, 255–261 CrossRef CAS.
- J. H. Lee, N. Park, B. G. Kim, D. S. Jung, K. Im, J. Hur and J. W. Choi, ACS Nano, 2013, 7, 9366–9374 CrossRef CAS PubMed.
- S. Laruelle, S. Grugeon, P. Poizot, M. Dolle, L. Dupont and J. M. Tarascon, J. Electrochem. Soc., 2002, 149, A627–A634 CrossRef CAS.
- S. D. Seo, D. H. Lee, J. C. Kim, G. H. Lee and D. W. Kim, Ceram. Int., 2013, 39, 1749–1755 CrossRef CAS.
- X. Y. Xue, P. Deng, S. Yuan, Y. X. Nie, B. He, L. L. Xing and Y. Zhang, Energy Environ. Sci., 2013, 6, 2615–2620 CAS.
- A. Débart, L. Dupont, P. Poizot, J. B. Leriche and J. M. Tarascon, J. Electrochem. Soc., 2001, 148, A1266–A1274 CrossRef.
- L. Martin, H. Martinez, D. Poinot, B. Pecquenard and F. L. Cras, J. Phys. Chem. C, 2013, 117, 4421–4430 CAS.
- N. R. Srinivasan, S. Mitra and R. Bandyopadhyaya, Phys. Chem. Chem. Phys., 2014, 16, 6630–6640 RSC.
- P. S. Veluri, A. Shaligram and S. Mitra, J. Power Sources, 2015, 293, 213–220 CrossRef CAS.
- W. X. Zhang, G. Ma, H. Y. Gu, Z. H. Yang and H. Cheng, J. Power Sources, 2015, 273, 561–565 CrossRef CAS.
- C. Wang, A. J. Appleby and F. E. Little, J. Electroanal. Chem., 2001, 497, 33–46 CrossRef CAS.
- C. K. Chan, R. Ruffo, S. S. Hong and Y. Cui, J. Power Sources, 2009, 189, 1132–1140 CrossRef CAS.
- R. H. Wang, C. H. Xu, J. Sun, L. Gao and H. L. Yao, ACS Appl. Mater. Interfaces, 2014, 6, 3427–3436 CAS.
Footnote |
| † Electronic supplementary information (ESI) available: Self-assembly of porous CuO nanospheres decorated on reduced graphene oxide with enhanced lithium storage performance. See DOI: 10.1039/c6ra28724g |
| This journal is © The Royal Society of Chemistry 2017 |


