
 Open Access Article
 This Open Access Article is licensed under a
 Creative Commons Attribution 3.0 Unported Licence
Characterization of the biosorption properties of dormant spores of Aspergillus niger: a potential breakthrough agent for removing Cu2+ from contaminated water
Jing-Yao Wang and
Chong-Wei Cui*
and
Chong-Wei Cui*
School of Municipal and Environmental Engineering, Harbin Institute of Technology, Harbin 150090, China. E-mail: 18845181188@126.com; Tel: +8618845181188
First published on 2nd March 2017
Abstract
Recent work has focused on a new cultivation method (solid fermentation), by which a new form of Aspergillus niger was produced; the spores were characterised by a 2 μm diameter and higher biosorption capacity than that of Aspergillus niger mycelium, which was prepared using the traditional method (submerged fermentation). The results showed that the maximum biosorption capacity for Cu2+ of the Aspergillus niger spore was 25.3 mg g−1 and that of the Aspergillus niger mycelium was only 10.1 mg g−1 at a natural pH with an initial concentration of 30 mg L−1. Meanwhile, the mechanism of the spores involved ion exchange (P, K, Ca and Mg), complexation (C–O, C![[double bond, length as m-dash]](https://www.rsc.org/images/entities/char_e001.gif) O, C–N and C–H) and electrostatic attraction, and Cu–O was formed during the process. Moreover, the spores exhibited a short biosorption equilibrium time of 60 min over a pH range of 4.0–6.0, and the data fitted well with the pseudo-second-order kinetic equation and the Freundlich isotherm. A thermodynamic study demonstrated that the process was spontaneous and endothermic. In addition, the amplification of Aspergillus niger spores on an agricultural waste medium was from 106 to 109.
O, C–N and C–H) and electrostatic attraction, and Cu–O was formed during the process. Moreover, the spores exhibited a short biosorption equilibrium time of 60 min over a pH range of 4.0–6.0, and the data fitted well with the pseudo-second-order kinetic equation and the Freundlich isotherm. A thermodynamic study demonstrated that the process was spontaneous and endothermic. In addition, the amplification of Aspergillus niger spores on an agricultural waste medium was from 106 to 109.
1. Introduction
Biosorption is a recent effective method to remove heavy metals from wastewater and the biosorbents are usually divided into three types: microbiological, agricultural waste and algae. Moreover, those that are microbiological include bacteria, fungi and actinomycetes. In addition, fungal biosorbents (yeast, filamentous fungi and macrofungi) can biosorb metal ions more effectively as the compositions of their cell walls (mannan, glucan, chitin, cellulose and protein) possess strong negative charges.1Previously, filamentous fungi were used widely in heavy metal wastewater treatment as they can be removed from a liquid medium easily, and Aspergillus niger biosorbents, as one kind of mycelium fungus, were commonly used because they are inexpensive and non-toxic, and they are negatively charged on the fungus surface which leads to their cationic combining ability.2–4 So, in the past, researchers always prepared biosorbents from mycelium. However, this kind of biosorbent has two drawbacks: (1) the process for preparing the biosorbents was a costly and usually lengthy procedure consisting of shaked cultivation of the liquid medium, filtration, drying in an oven, crushing, and lastly, passing through a sieve to create the biosorbent powder; (2) the biosorption capacity was usually found to be low.5–7
Aspergillus niger spores are a kind of reproductive propagule produced in the later stage of Aspergillus niger growth. In contrast with mycelium biosorbents acquired from a liquid medium, spores can only be achieved from a solid medium. In addition, they have small diameters and their surfaces are rough.8 The surfaces of them are typically characterized by negative zeta potentials over a wide range of pH values.9 Spores are able to survive in extreme conditions, resisting chemical and physical attack.10 In addition, spores can grow on most agricultural waste without added nutrition.11 These characteristics may lead to the feasibility of their use in heavy metal biosorption.
To the best of our knowledge, there are no reports with regard to the application of spores of Aspergillus niger to remove copper. On the basis of the available literature, it is hypothesized that Aspergillus niger spores may be a promising candidate for such biosorption studies, thanks to their high biosorption capacity and being easy to acquire. In addition, copper is used as a probe to test the spores’ effectiveness.
The aim of this study was to explore the characteristics and mechanisms of spore biosorption in order to gain a deeper insight into the potential of Aspergillus niger spores as a biosorbent. For this purpose, the spores launched by aerial mycelium in solid media were obtained directly, and the effect of spore dosage, pH level, contact time and initial metal concentration on the biosorption process was investigated using a batch biosorption procedure. Finally, the spores before and after heavy metal ion biosorption were characterized using SEM-EDX, FTIR, XPS and FETEM.
2. Materials and methods
2.1 Microbiology and medium
Aspergillus niger CMCC98003 was purchased from CMCC (B).The liquid Martin medium (for submerged fermentation) was composed of peptone (5 g), yeast powder (1 g), glucose (20 g), KH2PO4 (1 g), MgSO4 (0.5 g), and 1 L of deionized water with a pH of 6.4.
The solid medium was the liquid Martin medium with 15% agar.
The agricultural waste medium was agricultural waste crushed into a powder with a diameter of about 0.3 mm.
2.2 Preparation and collection of biosorbent spores and mycelium
2.3 Fermentation substrate experiment
Rice straw, corn stalk, rice husk and wood flour were washed with distilled water, crushed with a grinder (FW100, Tianjin Theis brand) and sieved with a standard sieve to obtain a powder with a particle diameter of 0.3 mm. Then, the powders were dried in an electrically heated blast dry box to a constant weight. The spore suspension and powder were mixed at a ratio of 1![[thin space (1/6-em)]](https://www.rsc.org/images/entities/char_2009.gif) :1. Three days later, when the aerial mycelia of Aspergillus niger covered the whole medium, the number of spores were counted using a blood cell counting chamber.
:1. Three days later, when the aerial mycelia of Aspergillus niger covered the whole medium, the number of spores were counted using a blood cell counting chamber.
2.4 Biosorption experiment
2.5 Spore characterization
Fourier Transform Infrared Spectroscopy (FTIR) was used to ascertain the presence of specific chemical groups in the dried biosorbents (mycelium pellets and aerial mycelia).13 The dried spores used for Scanning Electron Microscopy (SEM) analysis were mounted on metal stubs and coated with gold for better image contrast. An SU8010 scanning electron microscope from Japan was used to view the images.14 XPS was performed (PHI 5400 ESCA System) with Al Kα radiation (hν = 1486.6 eV with an eV deviation of ±0.2 in the binding energy position) and the pass energies of the wide scan and narrow scan were 178.95 and 22.35 eV, respectively. In addition, a Talos F200x Field Emission Transmission Electron Microscope (FETEM) from America was used to view the spores.3. Results and discussion
3.1 Growth situation of spores on different agricultural waste media
Fig. 1 shows the growth curve of the spores on different agricultural waste media. The data of the fermentation substrate experiments show that the spores can grow on many kinds of agricultural waste, such as rice straw, corn stalk and rice husk, and that wood flour can’t provide nutrition for spore growth since it contains too much lignin. This phenomenon indicates that sporogony can happen greatly and quickly on a solid medium such as agricultural waste, which eliminates the time and effort needed to prepare the biosorbents, and as it is cheap and easy to acquire, it can be used directly without any desorption and reuse. | ||
| Fig. 1 The number of spores (108) grown on agricultural and forestry residues. | ||
Moreover, most of these agricultural waste types were also made to be raw or modified biosorbents to biosorb heavy metal waste water, and have been very popular in recent research.15,16 Therefore, growing spores on agricultural waste is an innovative method and the medium (agricultural and forestry residues) can also increase the biosorption capacity.17
3.2 Biosorption experiments
 | ||
| Fig. 2 Effect of factors on the biosorption capacity for Cu2+ by spores: (a) spore dosage; (b) pH level; (c) contact time; (d) initial concentration. | ||
| Biosorbent | Initial concentration (mg L−1) | pH | Biomass dosage (g L−1) | Cu2+ uptake (mg g−1) | Reference |
|---|---|---|---|---|---|
| Spores | 30 | 5.3 | 1 | 25.3 | This study |
| Mycelium | 30 | 5.3 | 1 | 10.1 | This study |
| PVA-immobilized mycelium | 30 | 5.5 | 1 | 8.9 | 6 |
| Mycelium | 30 | 5.5 | 1 | 5.8 | 6 |
| HCl-pretreated mycelium | 10 | 5 | — | 13.1 | 18 |
| Immobilized mycelium | 10 | 5 | 1 | 2.8 | 3 |
| Pretreated mycelium | 100 | 6 | 2 | 23.6 | 4 |
| NaOH-pretreated mycelium | 250 | 5 | 1 | 28.7 | 19 |
The tendency of spore biosorption implied that the spore biosorption reaction was able to adapt to a wide (3–5.3) range of pH levels (Fig. 2b). The best pH was similar to that which Idris Sargın found in his study, in which the biosorbents were Ustilago maydis immobilized chitosan microcapsules.20 It is reported that the dominant copper species in the solution of pH 3–5 were Cu2+ and CuOH+, while in a solution with a pH above 5.8, the Cu2+ ions precipitate, making the biosorption of Cu2+ ions impossible.21,22 In addition, the natural pH level of 30 mg L−1 Cu2+ was 5.3, meaning that in the actual treatment of Cu2+ waste water, it is not necessary to adjust the pH.23
From Fig. 2c, we can see that the biosorption yield of Cu2+ increased sharply in the first 30 minutes, and then increased steadily until the contact time reached 120 minutes. A further increase in contact time did not enhance the biosorption. This phenomenon may be due to the fact that, initially, all active sites on the surface of the adsorbents were vacant and the solution concentration was high. After that period, many surface active sites were occupied, so no increase in metal uptake was observed. For further experiments, therefore, the optimum contact time was determined to be 120 minutes.
Different initial concentrations of Cu2+ were investigated (Fig. 2d). The biosorption capacity of spores decreased with the increase in initial concentration until at last, a stable value was reached. This can be caused by the limitation of biosorption active sites; when the sites were occupied by Cu2+, no more Cu2+ could be biosorbed.
| Times | Biosorption (mg g−1) | Desorption (mg g−1) | Recovery rate (%) |
|---|---|---|---|
| 1 | 25.3 | 25.2 | 99.6 |
| 2 | 25.1 | 24.9 | 99.2 |
| 3 | 24.9 | 24.7 | 99.1 |
| 4 | 24.6 | 24.3 | 98.8 |
| 5 | 24.2 | 23.9 | 98.7 |
 | ||
| Fig. 3 Biosorption capacity for Cu2+ and binary metal ion mixtures with other kinds of heavy metal. | ||
3.3 Characteristics of spores before and after biosorption
Fig. 4 shows the Aspergillus niger spores before (a) and after (b) copper biosorption. As can be seen, the spores have a small diameter of about 2 μm and there are many small bumps and wrinkles on the surface of the spores, and the surface layer exhibits microcavities and porous structures, which seemed to be available for the biosorption process. After biosorption, the edges of the bumps were not as clear as before the biosorption.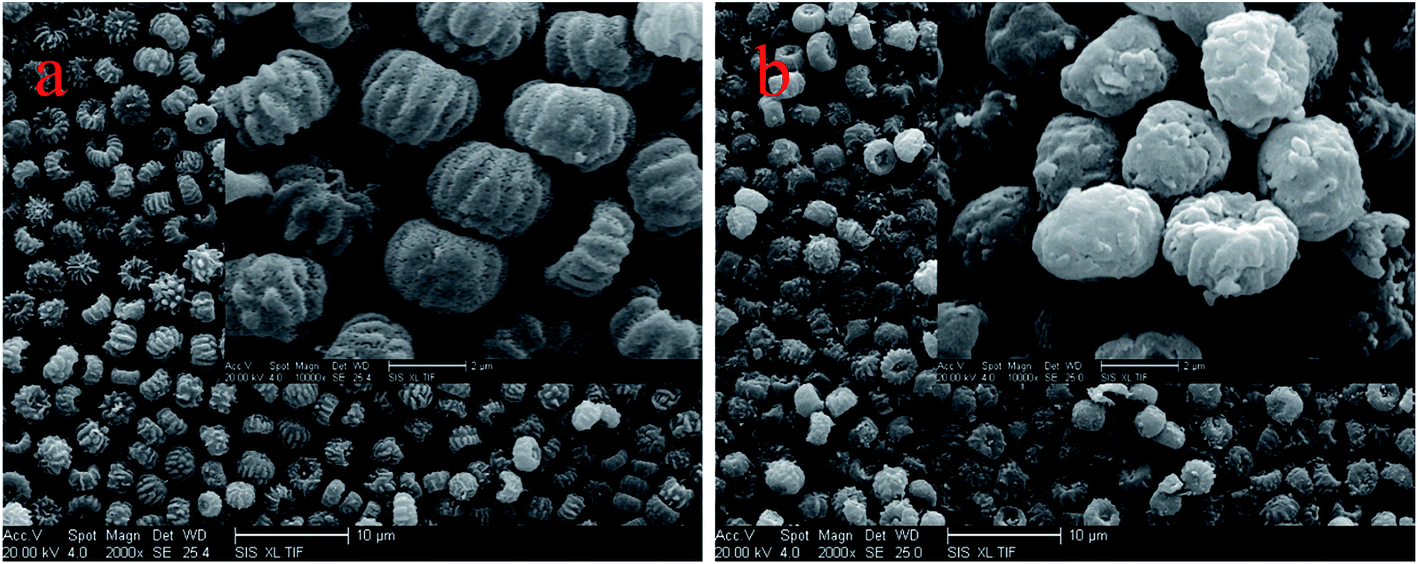 | ||
| Fig. 4 SEM images of the spores before (a) and after (b) heavy metal biosorption. | ||
According to the EDX results, shown in Fig. 5, the copper content (atomic percentage, or at%) on the cell surfaces (at% of 0 to 0.38) and the content of P (at% of 1.29 to 1.42) increased as the N content increased (at% of 10.03 to 11.23), while the C (at% of 69.05 to 68), O (at% of 19.02 to 18.52), and K (at% of 0.6 to 0.44) content decreased after Cu2+ biosorption. Undoubtedly, this kind of relative content alteration of N, P, and Cu was related to the release of C, O, and K and the adsorption of Cu2+ to the cell surface during Cu2+ biosorption. O-, N-, and P-containing functional groups on the biomass possibly contributed to Cu2+ binding onto the biomass.24 In addition, we obtained a series of data for the liquid after Cu2+ biosorption, and the amounts of Ca2+, K+, Mg2+, and Na+ were 0.67, 13.20, 2.77, and 1.32 mg g−1, respectively. The results above infer that the process involved ion exchange.24,25
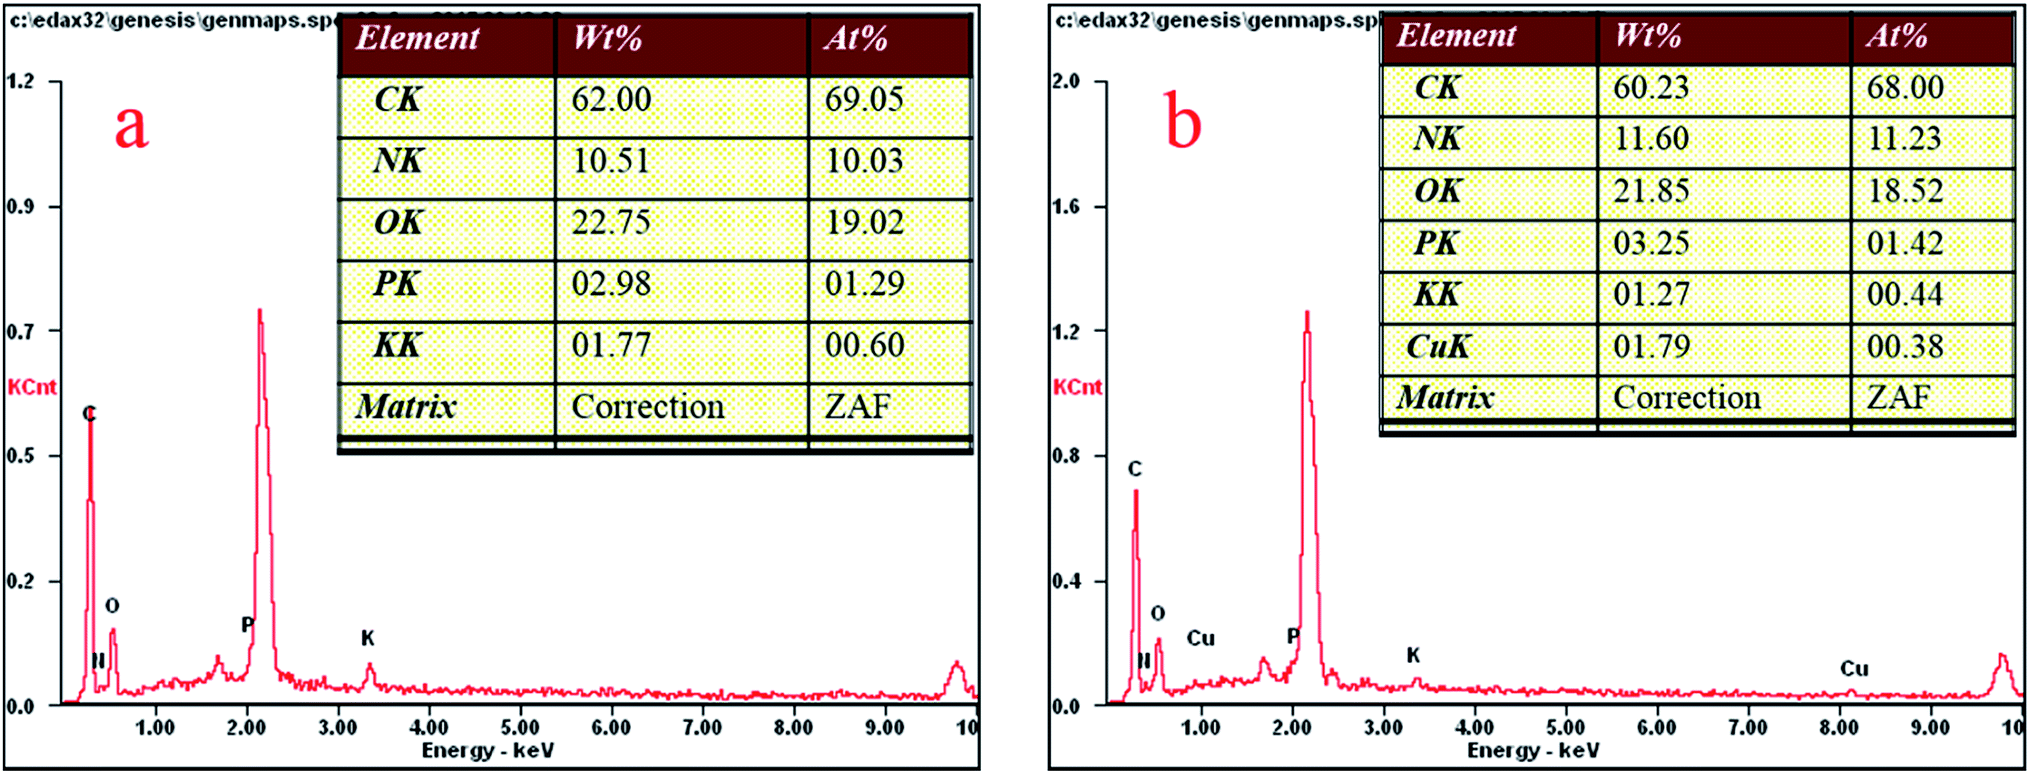 | ||
| Fig. 5 EDX analysis of the spores before (a) and after (b) heavy metal biosorption. | ||
3.4 FETEM of the spores after biosorption
The mapping of FETEM can display the distribution and condition of elements. Fig. 6a–c indicate the formation of metal deposits. In Fig. 6a, there are some light spots, which indicate the existence of Cu, and Fig. 6b and c show that Cu (red part) was combined with O (blue part), which led to the formation of Cu–O (purple part). However, there is no evidence in Fig. 6c of a compound of Cu and C. Since carbonyl and carboxyl groups (containing C, H and O) were abundant on the spores, when the biosorption happened, organic groups were involved as a whole, but Cu combined with O only. Fig. 6d–f show the elements of C, Cu and O, respectively. | ||
| Fig. 6 FETEM images of metal deposits and elements. | ||
3.5 XPS, FTIR and zeta potential analysis
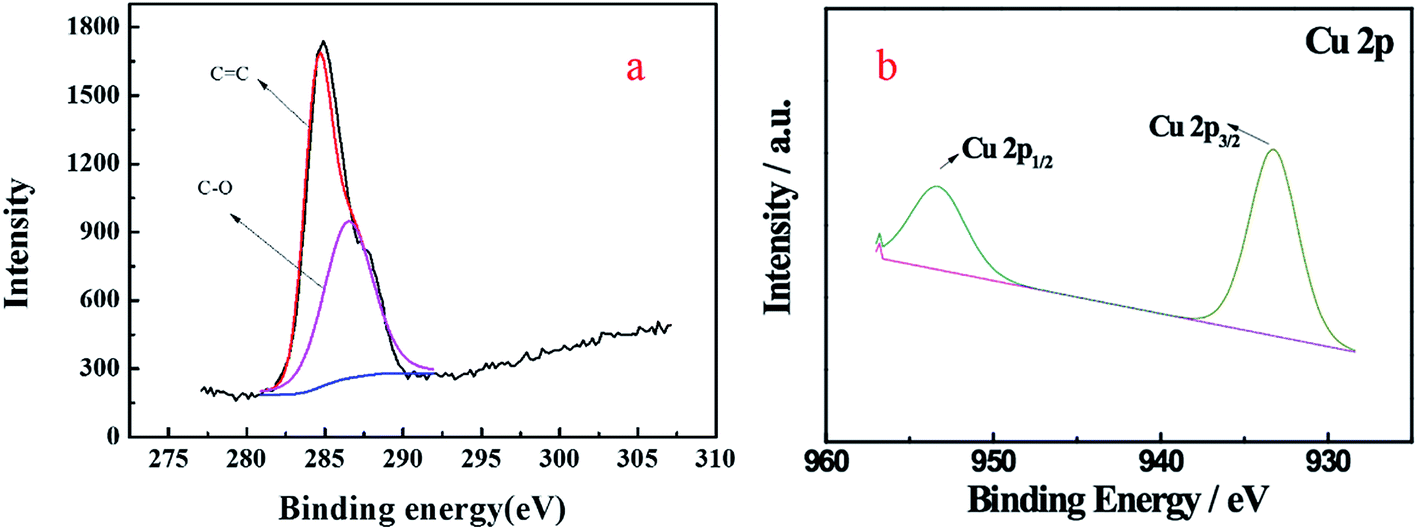
XPS analysis can provide information about the oxidation states and compositions of the superficial metals and can identify the chemical status of the main element in the samples. As Fig. 7 shows, the peaks located at binding energies of 286.5 eV and 284.5 eV can be assigned to C–O and CC bonds, respectively,26 which is in accordance with the FTIR result. The Cu 2p3/2 and Cu 2p1/2 spin–orbit splitting photoelectrons were clearly observed at binding energies of 933.4 and 953.6 eV, respectively, which was indicative of the paramagnetic chemical state of Cu2+, and these bands were assigned to Cu–O.27
 | ||
| Fig. 7 XPS spectra of Cu after spore biosorption. | ||
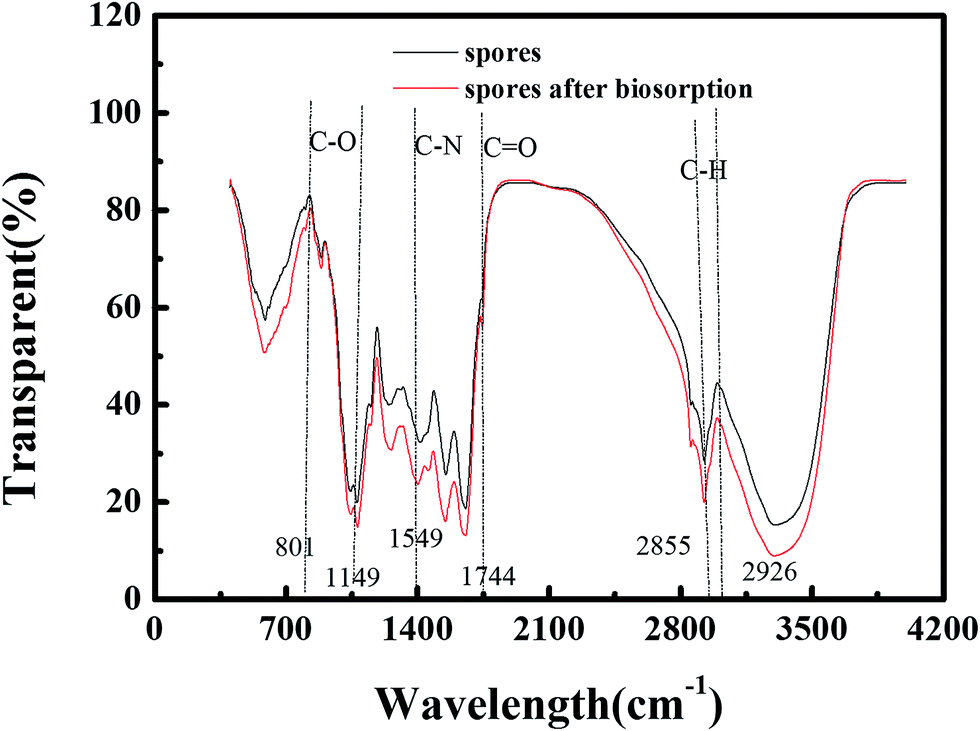
As we can see in Fig. 8, the troughs observed at 2926 cm−1 and 2855 cm−1 are indicative of a C–H group.28 The amide II band is a combination of N–H bending and C–N stretching, being centered around 1549 cm−1, and the biosorption band at 1415 cm−1 is characteristic of CC in an aromatic ring. In addition, 1246 cm−1, the amide III band, which is between 1320 and 1210 cm−1, is the C–O stretch of the carboxylic acids. 1043 and 1077 cm−1 can be assigned to phosphate functional groups such as orthophosphate (PO43−), appearing as characteristic biosorption peaks at 1100–1030 cm−1.28 1654 cm−1 corresponds to the N–H amine stretching band of the amino groups.16 801 and 885 cm−1, appearing as peaks at about 900–800 cm−1, can be assigned to C–H in aliphatic or aromatic bonds.
 | ||
| Fig. 8 FTIR spectra of spores before and after biosorption. | ||
The disappearance of the significant bands at 801 cm−1 and 1149 cm−1 could indicate the elimination of some of the compound containing C–O groups from the cell walls of the spores. The 1744 cm−1 peak located between 1700 and 1750 cm−1 appeared after biosorption. This is a carbonyl region, which means that some metal combined to carbonyl during biosorption. In addition, the fact that 1077 cm−1 changed to 1079 cm−1 means a reaction took place involving the phosphate functional groups, which is in accordance with the results of the EDX analysis (the change in P content). Also, the 1246 cm−1 peak shifting to 1258 cm−1 indicates changes in the secondary structure of proteins after denaturation or metal binding.23
The zeta potential represents the charge of the sample surface. As can be seen in Fig. 9, all of the samples were negatively charged gels and the sequence of the zeta potential absolute value was: fresh spores > spores dried at room temperature > mutant spores under UV > inactive spores. As the absolute value of the zeta potential decreased, the biosorption capacity of the samples also decreased. This phenomenon indicated that the biosorption process was related to electrostatic attraction.
 | ||
| Fig. 9 Zeta potential and Cu2+ biosorption capacity of the differently treated spores. | ||
3.6 Kinetics analysis
As can be seen in Fig. 10, the pseudo-second-order kinetic equation (R2 = 0.995) gave a slightly better fit than the intra-particle diffusion model (R2 = 0.92) and Lagergren’s first-order kinetic equation (R2 = 0.909). | ||
| Fig. 10 (a–c) Lagergren’s first order equation, the pseudo-second-order equation and the intra-particle diffusion model. | ||
Therefore, this biosorption was based on the pseudo-second-order kinetic equation premise that the sorption rate was controlled by chemical sorption,25 and the results of the spore character analysis using FTIR and FETEM confirmed this data (Table 3).
| qe exp (mg g−1) | Lagergren first order | Pseudo-second-order | Intra-particle diffusion | ||||||
|---|---|---|---|---|---|---|---|---|---|
| qe cal (mg g−1) | k1 (min) | R2 | qe cal (mg g−1) | k2 (g mg−1 min−1) | R2 | C (mg g−1) | Ki (g mg−1 min−1) | R2 | |
| 21.9 | 30.4 | 0.05 | 0.909 | 27.0 | 0.004 | 0.995 | 1.48 | 2.15 | 0.92 |
Little physical sorption was involved in this process, because the data fit with the Lagergren’s first-order kinetic equation as well (R2 > 0.9). In addition, intra-particle diffusion should be the rate-controlling step if the lines were to pass through the origin, which demonstrated that intra-particle diffusion was not the rate-controlling step.29 The dynamics of spore biosorption were in accordance with other kinds of fungus biosorbents.30
3.7 Isotherm analysis
The Freundlich model was slightly better than the Langmuir and Temkin models (Fig. 11a–c). The Freundlich model does not reveal the biosorption mechanisms, but it does generate information about the biosorption capacities of the system and predicts the behavior of the biosorption, which was a multilayer process,31 and there was a heterogeneous distribution of active sites on the spores’ surface32 (Table 4). Similar results were acquired by Jianlong, whose biosorbent was also Aspergillus niger.33 This phenomenon demonstrates that the component of Aspergillus niger spores did not affect the biosorption capacity, because the spores were derived from mycelium, therefore, the size and surface structure of the spores were the key factor in obtaining the high biosorption capacity.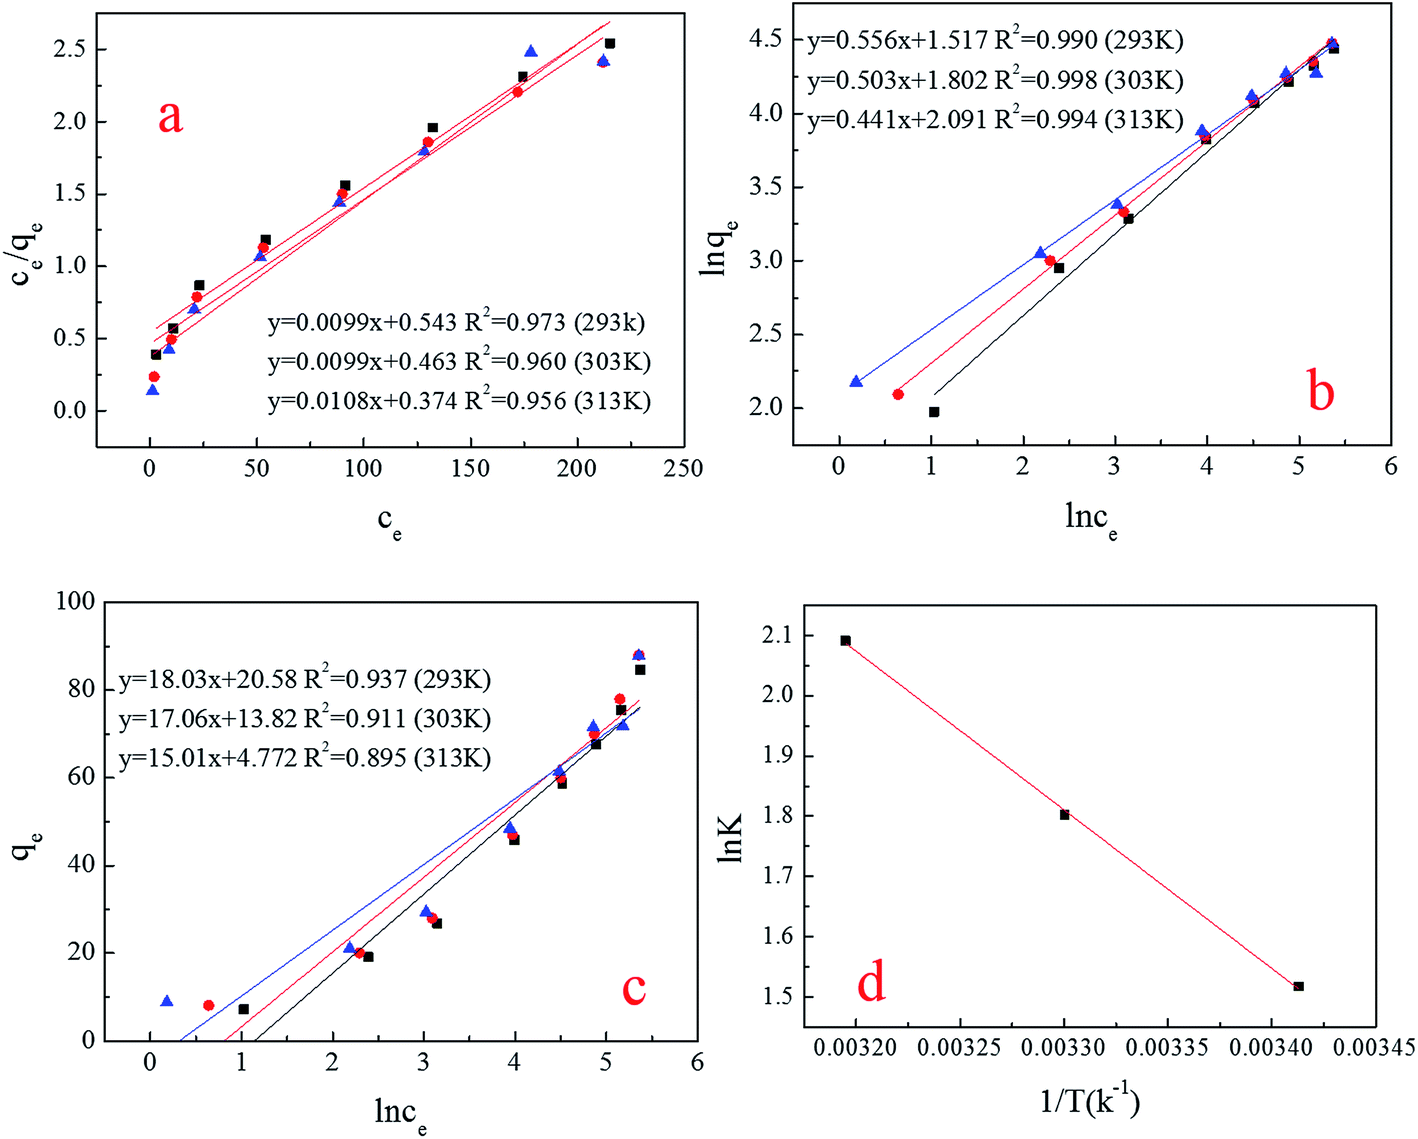 | ||
| Fig. 11 (a–c) (Simulation of isotherm) Langmuir, Freundlich and Temkin; (d) simulation of thermodynamics. | ||
| Temperature (K) | Langmuir | Freundlich | Temkin | ||||||
|---|---|---|---|---|---|---|---|---|---|
| qmax (mg g−1) | b (L mg−1) | R2 | K (L mg−1) | n | R2 | BT | KT | R2 | |
| 298 | 100 | 0.132 | 0.973 | 4.559 | 1.8 | 0.990 | 18.03 | 3.13 | 0.937 |
| 303 | 100 | 0.167 | 0.960 | 6.062 | 1.9 | 0.998 | 17.06 | 2.25 | 0.911 |
| 308 | 100 | 0.217 | 0.956 | 8.093 | 2.2 | 0.994 | 15.01 | 1.37 | 0.895 |
3.8 Thermodynamics analysis
In order to understand the impact of temperature, spontaneity and feasibility of this adsorption system with spores, it is necessary to calculate and evaluate the various thermodynamic parameters of this process.14 As shown in Table 5, the negative values of ΔG0 indicate the spontaneous nature of the adsorption process. The positive value of ΔS0 shows the increasing randomness at the solid–solution interface during the adsorption process. The positive values of ΔH0 suggest the endothermic nature of the adsorption interaction.34 In addition, in Subbaiah’s study, whose biosorbent was Trametes versicolor, a kind of fungus, similar thermodynamic regularity was found.34| ΔG0 (kJ mol−1) | ΔH0 (kJ mol−1) | ΔS0 (J mol−1 K−1) | R2 | ||
|---|---|---|---|---|---|
| 293 K | 303 K | 313 K | |||
| −3.70 | −4.54 | −5.44 | 21.86 | 0.087 | 0.998 |
4. Conclusion
(1) Spores of Aspergillus niger were used to biosorb cationic heavy metals. The maximum biosorption capacity of the spores was far higher than that of Aspergillus niger mycelium. In addition, the spores can reproduce in a large amount on agricultural waste.(2) The spore biosorption mechanism included electrostatic attraction and ion exchange, which was supported by the results of EDX analysis and complexation involved in CC, C–H, C–O and N–H. The data fitted well with the pseudo-second-order kinetic equation and the Freundlich isotherm.
(3) FETEM showed that there was a combination of Cu and O, and CuO was formed during the biosorption, as evidenced by the XPS results.
Acknowledgements
This study was financially supported by heavy metal wastewater treatment technology received from Heilongjiang Academy of Sciences (GC13C3042) and the heavy metal pollution emergency control of the National Environmental Protection Public Welfare Projects (201209048).References
- D. Sud, G. Mahajan and M. P. Kaur, Bioresour. Technol., 2008, 99, 6017–6027 CrossRef CAS PubMed.
- T. Akar and S. Tunali, Bioresour. Technol., 2006, 97, 1780–1787 CrossRef CAS PubMed.
- A. Kapoor and T. Viraraghavan, Bioresour. Technol., 1997, 61, 221–227 CrossRef CAS.
- M. Mukhopadhyay, S. B. Noronha and G. K. Suraishkumar, Bioresour. Technol., 2007, 98, 1781–1787 CrossRef CAS PubMed.
- N. L. Iskandar, N. A. I. M. Zainudin and S. G. Tan, J. Environ. Sci., 2011, 23, 824–830 CrossRef CAS.
- K. Tsekova, D. Todorova and S. Ganeva, Int. Biodeterior. Biodegrad., 2010, 64, 447–451 CrossRef CAS.
- Y. Khambhaty, K. Mody, S. Basha and B. Jha, Colloids Surf., A, 2008, 328, 40–43 CrossRef CAS.
- B.-E. Priegnitz, A. Wargenau, U. Brandt, M. Rohde, S. Dietrich, A. Kwade, R. Krull and A. Fleißner, Fungal Genet. Biol., 2012, 49, 30–38 CrossRef CAS PubMed.
- A. Wargenau, A. Fleißner, C. J. Bolten, M. Rohde, I. Kampen and A. Kwade, Res. Microbiol., 2011, 162, 1011–1017 CrossRef CAS PubMed.
- W. R. Bowen, R. W. Lovitt and C. J. Wright, Colloids Surf., A, 2000, 173, 205–210 CrossRef CAS.
- G. Guan, Z. Zhang, H. Ding, M. Li, D. Shi, M. Zhu and L. Xia, Biomass Bioenergy, 2015, 81, 224–233 CrossRef CAS.
- H. Yu, J. Pang, T. Ai and L. Liu, J. Taiwan Inst. Chem. Eng., 2016, 62, 21–30 CrossRef CAS.
- A. S. Saini and J. S. Melo, Bioresour. Technol., 2013, 149, 155–162 CrossRef CAS PubMed.
- M. O. Omorogie, J. O. Babalola, E. I. Unuabonah and J. R. Gong, Bioresour. Technol., 2012, 118, 576–579 CrossRef CAS PubMed.
- C. R. Teixeira Tarley, S. L. Costa Ferreira and M. A. Zezzi Arruda, Microchem. J., 2004, 77, 163–175 CrossRef CAS.
- S. Chen, Q. Yue, B. Gao, Q. Li and X. Xu, Chem. Eng. J., 2011, 168, 909–917 CrossRef CAS.
- J.-Y. Wang, H. Cui, C.-W. Cui and D.-F. Xing, Ecol. Eng., 2016, 95, 793–799 CrossRef.
- M. Mukhopadhyay, S. B. Noronha and G. K. Suraishkumar, Chem. Eng. J., 2008, 144, 386–390 CrossRef CAS.
- A. Y. Dursun, Biochem. Eng. J., 2006, 28, 187–195 CrossRef CAS.
- İ. Sargın, G. Arslan and M. Kaya, Carbohydr. Polym., 2016, 138, 201–209 CrossRef PubMed.
- M. Ajmal, A. Hussain Khan, S. Ahmad and A. Ahmad, Water Res., 1998, 32, 3085–3091 CrossRef CAS.
- Y. A. Yahaya, M. Mat Don and S. Bhatia, J. Hazard. Mater., 2009, 161, 189–195 CrossRef CAS PubMed.
- R. Drake, L. Shan and D. Rayson, Environ. Sci. Technol., 1996, 110–114 CrossRef.
- C. Chen, D. Wen and J. Wang, Bioresour. Technol., 2014, 156, 380–383 CrossRef CAS PubMed.
- Y. Ding, D. Jing, H. Gong, L. Zhou and X. Yang, Bioresour. Technol., 2012, 114, 20–25 CrossRef CAS PubMed.
- F. Wang, X. Lu and X.-y. Li, J. Hazard. Mater., 2016, 308, 75–83 CrossRef CAS PubMed.
- L. Ye, S. Wang, H. You, J. Yao and X. Kang, Chem. Eng. J., 2013, 226, 434–443 CrossRef CAS.
- T. Mathialagan and T. Viraraghavan, Bioresour. Technol., 2009, 100, 549–558 CrossRef CAS PubMed.
- I. Senturk, H. Buyukgungor and F. Geyikci, Desalin. Water Treat., 2015, 1–11, DOI:10.1080/19443994.2015.1102088.
- J. Huang, D. Liu, J. Lu, H. Wang, X. Wei and J. Liu, Colloids Surf., A, 2016, 492, 242–248 CrossRef CAS.
- G. M. Figueroa-Torres, M. T. Certucha-Barragán, E. Acedo-Félix, O. Monge-Amaya, F. J. Almendariz-Tapia and L. A. Gasca-Estefanía, J. Taiwan Inst. Chem. Eng., 2016, 61, 241–246 CrossRef CAS.
- L. Yu and Y.-m. Luo, J. Environ. Chem. Eng., 2014, 2, 220–229 CrossRef CAS.
- W. Jianlong, Z. Xinmin, D. Decai and Z. Ding, J. Biotechnol., 2001, 87, 273–277 CrossRef CAS PubMed.
- M. V. Subbaiah, Y. Vijaya, A. S. Reddy, G. Yuvaraja and A. Krishnaiah, Desalination, 2011, 276, 310–316 CrossRef CAS.
| This journal is © The Royal Society of Chemistry 2017 |