 Open Access Article
Creative Commons Attribution 3.0 Unported Licence
Inclusion complexes of norepinephrine with β-cyclodextrin, 18-crown-6 and cucurbit[7]uril: experimental and molecular dynamics study†
Suad K. S.
Al-Burtomani
and
FakhrEldin O.
Suliman
 *
*
Department of Chemistry, College of Science, Sultan Qaboos University, Box 36, Al-Khod 123, Oman. E-mail: fsuliman@squ.edu.om; Fax: +968-24141469; Tel: +968-24141480
First published on 3rd February 2017
Abstract
The formation of binary and ternary inclusion complexes of norepinephrine, NP, with β-cyclodextrin (βCD), cucurbit[7]uril (CB7) and 18-crown-6 (18C6) have been investigated. Fluorescence spectroscopy revealed the enhancement of emission at around 312 nm from NP in the presence of βCD. However, in the presence of CB7 and 18C6 this band was quenched and the spectra exhibited an excimer emission at longer wavelength due to aggregation of guest molecules. The stoichiometry of the inclusion complexes has been investigated by electrospray mass spectrometry (ESI-MS) revealing the presence of binary and ternary complexes of NP with the hosts studied. On the other hand, the solid complexes prepared by lyophilization were characterized by FT-IR, Raman spectroscopy and powder X-ray crystallography. Our data, taken together, clearly suggest that the three hosts form stable complexes with NP. Additionally, we performed molecular dynamics simulations on these complexes in aqueous media for 15–20 ns. The results obtained indicated that hydrophobic forces together with extensive hydrogen bonding are responsible for the stability of these complexes.
Introduction
The fascination imparted by supramolecular systems has inspired researchers to exploit new systems with applications spanning from medicine to nanotechnology. Cyclodextrins, calixarenes and crown ethers have been at the front of these endeavors. However, recently other new systems have emerged in the literature such as cucurbit[n]urils and pillararenes, together with their homologues and derivatives.1–8 These molecules have been used as selective hosts for a plethora of guests. Interestingly, the complexes formed between these hosts and their guests were mainly stabilized by weak noncovalent interactions such as van der Waals forces, hydrophobic interactions, hydrogen bonding, and ion–dipole interactions among others.9Molecular recognition by cyclodextrin (CDs), cucurbit[n]urils (CBs) and crown ethers for various guest molecules differs significantly. Cyclodextrins are naturally formed by the action of enzyme cyclodextrin glycosyltransferase on starch to form oligosaccharides with 6, 7 and 8 D-glucopyranose units to form the chiral receptors αCD, βCD and γCD (with cavity diameters of 4.7–5.3, 6.0–6.5, and 7.5–8.5 Å for α-, β-, and γ-CD, respectively).10 On the other hand, CBs are formed by condensation of glycoluril with formaldehyde units to form symmetrical achiral CB6, CB7 and CB8 molecules.1,3,4 The two openings of CD's cavities are different in size. The wider rim is lined with secondary hydroxyl groups while the narrower one carries primary hydroxyl groups. In case of CBs the two portals are identical in size and both are lined with carbonyl groups.
The presence of well-defined hydrophobic cavities in these two types of hosts has allowed guest molecules insert into them depending on the size and structure of the cavity as well as the size, shape and charge of the guest. Cyclodextrins form three dimensional truncated cones that generally prefer to form noncovalent inclusion complexes with hydrophobic molecules or the hydrophobic parts of a molecule. Cucurbit[n]urils, on the other hand, possess a cylindrical structure and similar to cyclodextrins they encapsulate molecules in their hydrophobic cavity. The carbonyl groups that line the portals of the CBs molecules furnish rich electron sites suitable for hydrogen bonding and electrostatic interactions with guest cations in a fashion similar to crown ethers. The rigid structures and the ability of these host molecules to form stable complexes with guest molecules and ions make them attractive for supramolecular assemblies. However, the major hurdle associated with CBs is their limited solubility in various solvents which hinders their potential to be fully explored.1
Crown ethers, on the other hand, are cyclic polyethers bearing mostly oxygen as electron donor atoms. However, when one or more oxygen atoms are replaced by nitrogen or sulfur atoms azacrown ethers and thiacrown ethers are obtained, respectively.11 The availability of multiple binding sites coupled to the molecule's conformational flexibility allow them to engage in complexation with cations of the alkali and alkaline earth metals, ammonium ion, amines, ionic and polar organic molecules.12,13 The stability of the host–guest species of crown ethers and various guest molecules depends on the cavity size, hydrogen bonding and solvation parameters.
It is worth noting here that amongst these three hosts, cyclodextrins are optically active compounds capable of forming diastereomeric pairs by complexation or association with racemic mixtures. Therefore, an arsenal of neutral, cationic and anionic cyclodextrins has been extensively used in chiral chromatography.14–19 However, chiral recognition of small molecules bearing a primary amine moiety near the chiral center by cyclodextrin remains a challenging problem. This is principally due to the formation of flexible complexes with the chiral host molecule. It has been reported that presence of a non-chiral crown ether, such as 18-crown-6, together with the cyclodextrin imparted enantioseparation of some amines that could otherwise not be resolved or are partially resolved by cyclodextrin alone.20–24 It is generally believed that chiral recognition in macrocyclic systems is promoted by the rigidity of the system and the bulkiness of the analytes, however, this has not yet been confirmed. Therefore, the role of the crown ethers in the chiral separation remains unraveled.
Host–guest complexation is usually investigated by a portfolio of analytical techniques, such as Fourier transform infra-red and Raman spectroscopies, NMR spectroscopy, X-ray crystallography, mass spectrometry, UV-visible and fluorescence spectrophotometry and electrochemical techniques.6,25–30 Furthermore, theoretical molecular modeling calculations, such as density functional theory calculations and molecular dynamics are usually used to shed the light on the molecular recognition mechanism and to delineate the structure of these complexes.23,31–36
Norepinephrine, NP, is a member of the catecholamine family of compounds known to possess pharmacological activities as neurotransmitters and hormones. It is used to treat cases of low blood pressure because as a stimulant of the sympathetic nervous system it increases the heart rate and blood pressure.37,38 Inclusion complexes of some catecholamines, including NP, with various guests have been reported.39,40 These studies have suggested that these molecules tend to aggregate in solution, especially at high concentrations and in the presence of host molecules. Ephedrine was reported to exhibit a strong excimer emission when present at concentrations greater than 104 M and when fitted inside the pores of aluminophosphate frameworks, attributed to the π–π stacking of the aromatic rings of the compound.41,42 Interestingly, pseudoephedrine, a stereoisomer of ephedrine, was reported to exhibit lesser tendency to form supramolecular aggregates. It has been claimed using molecular dynamic simulations that the difference in the stereochemistry of the hydroxyl group lead to conformers of different stability and consequently different aggregations.41
The most acceptable mechanism of chiral separations of small aromatic molecules carrying an aromatic amine using a mixture of cyclodextrin and crown ethers is via formation of ternary sandwich compounds.23,43,44 In this compound the primary amine is inserted into the βCD cavity and simultaneously interact through its protonated primary group with the crown ether leading to a more stable and rigid molecule.
Prompted by these ideas we embarked on investigating molecular assemblies involving small aromatic compounds bearing amine groups and hosts such as cyclodextrins, crown ether and cucurbiturils. In this work, we decided to compare the interactions of NP with three hosts viz. βCD, 18C6 and CB7 in their binary and ternary mixtures. Our aim is to study the mechanism of interaction of NP with these hosts and whether they cooperatively interact with the guest molecule to form ternary complexes or compete for it. To achieve these goals we studied these complexes in solutions as well as in the solid state using a number of spectroscopic techniques. Moreover, to have a further insight into the mechanism of interaction between NP and these hosts, we used molecular dynamic simulations to study the stability, intermolecular interactions and the mode of inclusion of NP into the nanocavities of these hosts in aqueous media.
Experimental
General
Chemicals used in this study were obtained from Sigma-Aldrich and were used without further purification. Solvents of spectroscopy or HPLC grade and ultra-pure water were used for preparation of solutions.The fluorescence measurements were obtained using LS55 fluorescence Spectrometer (PerkinElmer, USA). The excitation wavelength was set at 270 nm. The electrospray ionization mass spectra, ESI-MS, were collected using Agilent, 6460 Triple quad LC/MS, 1200 Infinity series equipped with electrospray ionization (ESI) interface and operated by MassHunter software. The gas temperature was 300 °C with flow rate of 5 L min−1. The capillary voltage was 3.5 kV and injection volume was 5.00 μl. The guest and the desired hosts (1–5 mM) were dissolved in ultrapure water and drops of HPLC grade acetonitrile and acetic acid were added before injection.
FT-IR, spectra of guest, hosts and inclusion complexes as well as physical mixtures were obtained using Agilent Cary 630 FTIR spectrometer. The Raman spectra were obtained using XploRA, Horiba Scientific, equipped with a 785 nm laser (35 mW). The laser beam was focused through a 50× objective lens. The range of vibrational frequencies was from 100 to 3500 cm−1. Five scans were accumulated for each spectrum, with acquisition time 20 s. The Raman measurements were performed at room temperature and atmospheric pressure. All samples were investigated in powder form and no further sample preparation was applied.
The XRD analyses of powder samples were recorded using Panalytical, X' Pert PRO X-Ray Diffraction equipped with copper X-ray source (45 kV, 40 mA) and an X Celerator X-ray detector. The powdered samples are analyzed over an angular range of five to seventy degrees 2θ using a sample spinner to reduce the effects of preferred orientation.
NMR spectra were obtained on Avance HD III 700 MHz spectrometer (Bruker, Karlsruhe, Germany). All chemical shifts (expressed in ppm scale) are referenced to the solvent signal. Phase sensitive two-dimensional rotating frame nuclear overhauser enhancement correlation (2D-ROESY) experiment were carried out using 180×–180× pulses for spin lock to suppress TOCSY artifacts. Solutions were prepared in D2O and drops of deuterated acetic acid were used to adjust pH of the solutions prior to measurements.
Preparation of the solid inclusion complexes
An appropriate amount of the 18C6, CB7, βCD and NP were dissolved in 20 ml water to make a concentration of 15 mM of each (few drops of HCl (1 M) were added in the case of CB[7] to assist dissolution). Mixtures of solutions of NP in presence of individual hosts were prepared to form binary complexes. Additionally, mixtures of NP with βCD in presence of 18C6 and CB7 to form ternary complexes were also prepared. The solutions were inserted into a shaker-incubator (IKA KS 4000i Control Incubating Shaker, Cole-Parmer) for 48 h at 40 °C. The inclusion complexes solutions were removed and filtered and immediately submitted to the freeze dryer (Lyo Quest, Telstar) for 72 hours. The solid inclusion complexes obtained were kept desiccated at −4 °C for further investigation.Fluorescence measurements
Sodium acetate/acetic acid buffer of pH 5.0 was used for the preparation of all aqueous solutions. Series of solutions with constant concentration of NP and different concentrations of hosts (βCD, 18-crown-6 and CB[7]) were prepared. The concentration of NP solution was maintained at 3.5 × 10⁻⁶ M while that of the host molecules viz. β-CD and 18-crown-6 were varied from 1.0 mM to 15 mM. The concentration of CB7, on the other hand, was varied from 0.01 to 0.1 mM. All experiments were carried out at room temperature.Molecular dynamic calculations
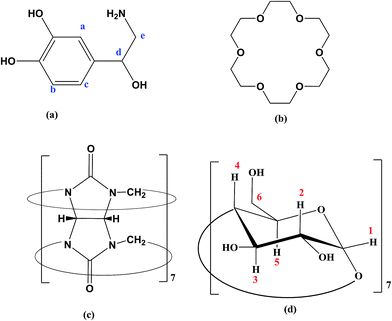
The chemical structure of hosts and the guest are shown in Scheme 1. The initial geometry of NP and 18C6 were optimized using DFT-B3LYP method using 6-31G* basis set. On the other hand, the structures of βCD and CB7 were extracted from the crystallographic parameters provided by the Structural Data Base System of the Cambridge Crystallographic Data Center and were optimized by minimizing their energy using PM7 semiempirical method using MOPAC 2012 (http://openmopac.net).45The molecular dynamics (MD) simulations were carried out using the Desmond molecular simulations package, as distributed by Schrodinger-2015 suite of programs.46,47 The OPLS_2005 all-atom force field with explicit solvent (TIP3P water model) were used throughout the calculations. Simulations were run with periodic boundary conditions, in an orthorhombic box with the solute placed in the middle at 20 Å distance from each of the boxes edges. The SHAKE algorithm was used to constrain covalent bonds between hydrogen and heavy atoms. Long-range electrostatic interactions were dealt with using the Ewald smooth particle mesh (PME) method.48 The solvated molecules were subjected to sequential restraint solvent–solute minimizations and short MD simulations on NVT-NPT ensembles (as implemented in the default relaxation protocol in Desmond) coupled to Berendsen thermostat. Finally the production run was NPT run at 300 K and 1 bar. The simulations were then analyzed by the “simulation event analysis” module in Schrodinger 2015 suit.
Results and discussion
Fluorescence study
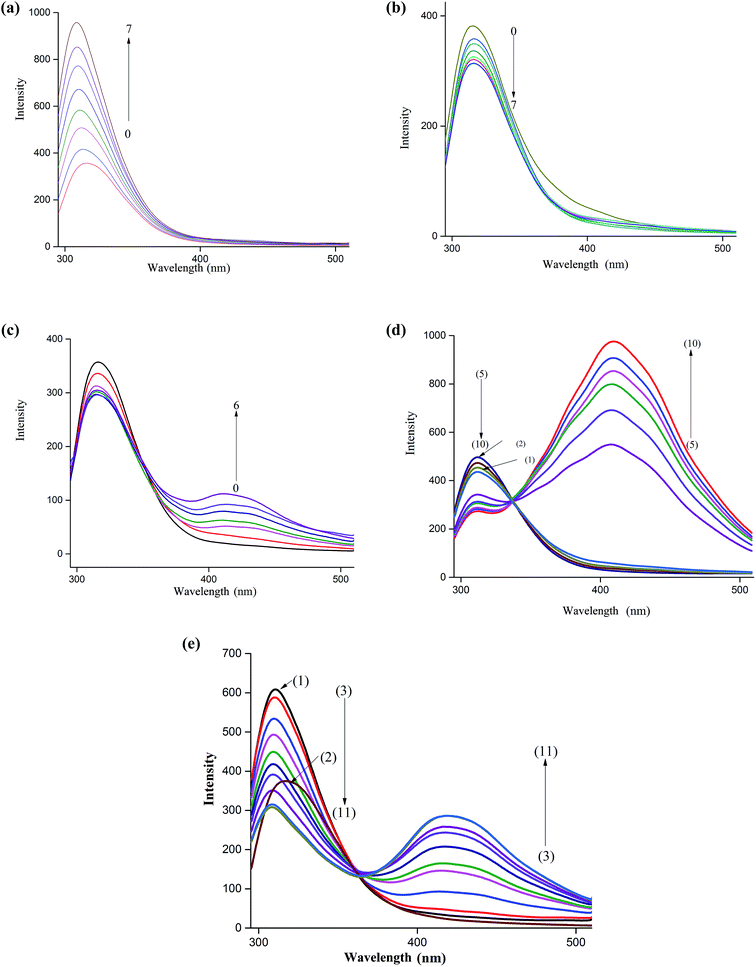
The fluorescence spectrum of NP is characterized by a peak at around 312 nm when excited at 270 nm. This band is ascribed to the locally excited state involving π–π* transition. As Fig. 1a shows, a remarkable increase in the fluorescence intensity of this band is observed upon incremental additions of βCD to an aqueous solution of NP. Moreover, the increase in fluorescence intensity is accompanied by a slight shift of the fluorescence maximum (∼5 nm) to the blue region. These results indicate that NP is experiencing an environment different from the bulk water suggesting that it enters the cavity of the host cyclodextrin. The enhancement of the fluorescence of NP upon inclusion is due to suppression of non-radiative decay pathways as rotations of the molecule around a single bond are minimized. Insertion of the catechol moiety into nanocavity of host molecules is also accompanied by hydrogen bonding interaction between the rim hydroxyl groups and the polar groups on NP.39,40We also examined the effect of addition of 18C6 to an aqueous solution of NP to investigate the influence of interaction of amine-group with the crown ether on the fluorescence behavior of this molecule. The results in Fig. 1b show that the emission spectra of NP in presence of 18C6 exhibit a different behavior. Interestingly, the intensity of the peak at 312 nm started to decrease continuously with an increase in 18C6 concentration. Additionally, a feeble band at 425 nm started to grow with the appearance of an isoemissive point at around 370 nm clearly suggesting the formation of two species. Similar results were obtained upon incremental additions of CB7 to NP aqueous solution as illustrated in Fig. 1c. In presence of CB7 the peak at 425 nm grows much higher in intensity compared to when 18C6 is added. The long wavelength band is ascribed to the excimer emission as have been reported for NP and similar molecules.39,40 This band is believed to originate from the aggregation of NP molecules induced by interaction with the host molecules. The molecular aggregation quenches the fluorescence of the monomer band and results in a new emission band at longer wavelength.
In chiral separations of primary amines by cyclodextrins it has been reported that addition of 18C6 to the mobile phase imparts improved resolutions in many instances.23,43,49 These phenomena have been explained on the basis of formation of a ternary complex between the amine, CD and 18C6. In this work we studied the effect of 18C6 on the fluorescence of NP–βCD inclusion complex by adding the crown ether to a mixture of NP (3.5 μM) and βCD (3 mM). Initially additions of 18C6 resulted in a decrease in the emission intensity of the short-wavelength band together with a slow growth of the long-wavelength band up to addition of 0.5 mM concentration of 18C6 (Fig. 1d). Interestingly, with further additions of 18C6 a remarkable enhancement of fluorescence intensity of the longer-wavelength band is observed with the appearance of vibrational details.
CB7 is a host that interacts strongly with positively charged ions. It resembles crown ethers in possessing electron rich portals capable of attracting positively charged species. Moreover, the barrel shaped molecule is characterized by possessing a hydrophobic cavity similar to cyclodextrins. The main difference between the two cavities resides in the fact that CBs possess portals that are significantly electron rich. In addition, the inner surface of CBs is also negative. Therefore, the affinity of CB7 to charged species is noticeably high compared to CDs.50 Addition of aliquots of CB7 to an aqueous solution of NP–βCD ([βCD] = 3 mM) resulted in quenching of the shorter-wavelength band accompanied by a gradual increase of the longer-wavelength band as shown in Fig. 1e. Interestingly, the shorter-wavelength band underwent further blue shift. These results are similar to those observed for NP–βCD–18C6 system.
βCD form complexes that aggregate via formation of head-to-head, head-to-tail and tail-to-tail dimers.51 These dimers are stabilized by strong hydrogen bonding that could also involve water molecules in the inter-dimer space. It has been reported that the nature of guest molecules encapsulated into the cavity of the host affects greatly the structure of CD aggregates and the ensuing crystals. For instance, small guest molecules were found to result in herring-bone packed monomer crystals, whereas moderate to large gusts crystallizes through head-to-head inclusion complexes dimers.52,53 The later phenomena is greatly enhanced by the extensive hydrogen bonding between the secondary hydroxyl-groups lining the wider CD cavity and it also involve interactions of the polar groups of the guest with each other and with the hydroxyl groups of the CD. For NP–βCD and in presence of 18C6 and CB7 the formation of head-to-head and tail-to-tail aggregates is possible. The ammonium group interacts strongly with 18C6 and is also expected to interact with CB7. Then insertion of the catechol group inside the CD cavity from the narrow side will allow head-to-head dimers to form, however, penetration of the catechol group from the wider sider of the CD may result in tail-to-tail dimer.
ESI-MS
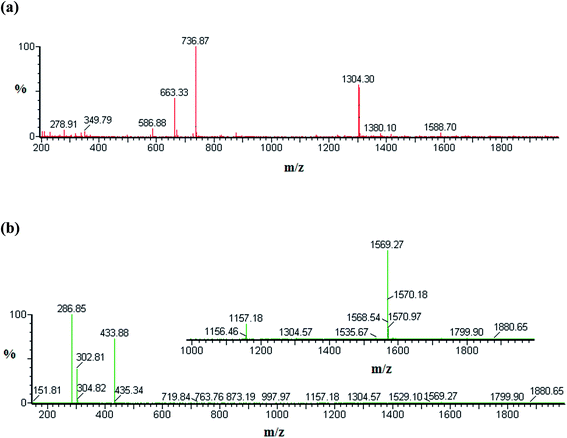
We used ESI-MS to investigate the stoichiometry of the various species involved in complexation between NP and the three hosts included in this study. The ESI-MS spectra are recorded in the positive mode and examples of them are displayed in Fig. 2 and the results are summarized in Table 1. The formation of NP–βCD complexes is clearly evident from the singly charged and doubly charged species [NP–βCD + H]+, [2NP–βCD + 2H]2+ and [NP–βCD + Na + H]2+ at m/z 1304, 737 and 663, respectively as shown in Fig. 2a. The guest molecule is represented by the singly charged ions at m/z 169.8 and 338.8 associated with the monomer [NP + H]+ and the dimer [2NP + H]+, respectively. These results indicate the possibility of dimerization of NP in solution as well as in the gas phase.| m/z | Species |
|---|---|
| NP–βCD | |
| 1304.30 | [NP − βCD + H]+ |
| 663.33 | [NP − βCD + Na + H]2+ |
| 736.87 | [2NP − βCD + 2H]2+ |
| 590.0 | [βCD + 2Na]+ |
| 338.85 | [2NP + H]2+ |
| 169.80 | [NP + H]+ |
![[thin space (1/6-em)]](https://www.rsc.org/images/entities/char_2009.gif) |
|
| NP–βCD–18C6 | |
| 1569.27 | [NP − βCD − 18C6 + H]+ |
| 1157.18 | [βCD + Na]+ |
| 877.04 | [2NP − βCD − 18C6 + 2H]2+ |
| 433.88 | [NP − 18C6 + H]+ |
| 302.81 | [18C6 + K]+ |
| 286.85 | [18C6 + Na]+ |
![[thin space (1/6-em)]](https://www.rsc.org/images/entities/char_2009.gif) |
|
| NP–βCD–CB7 | |
| 1333 | [NP − CB7 + H]+ |
| 1319 | [2NP − CB7 − βCD + 2H]2+ |
| 1163 | [CB7 + H]+ |
| 1135 | [βCD + H]+ |
| 751 | [2NP − CB7 + 2H]2+ |
The ESI-MS results of NP–βCD–18C6 are characterized by intense signals that correspond to various singly charged ion complexes of 18C6 such as [18C6 + Na]+ at m/z 286.9, and [18C6 + K]+ at m/z 302.8 (Table 1). The most striking finding in these spectra is the emergence of a singly charged species at m/z 1569.2 (Fig. 2b) attributed to the ternary complex [NP–βCD–18C6 + H]+ ion. Additionally, a doubly charged ion at m/z 877 is believed to be associated with [2NP–βCD–18C6 + 2H]2+. Furthermore, the interaction between NP and 18C6 is confirmed by the peak at m/z 433.8 for [NP–18C6 + H]+ ion.
The ESI-MS spectrum of NP–CB7 complex is presented in Fig. S1.† [NP–CB7 + H]+ ions show a signal at m/z 1333 confirming the formation of a 1![[thin space (1/6-em)]](https://www.rsc.org/images/entities/char_2009.gif) :
:![[thin space (1/6-em)]](https://www.rsc.org/images/entities/char_2009.gif) 1 inclusion complex between NP and CB7. Moreover, the interaction of dimer 2NP with CB7 is represented by a peak at m/z 751 which correspond to [2NP–CB7 + 2H]2+ ion. On the other hand, the cluster peak at m/z 1319 in Fig. S2† was found to match with the doubly charged species [2NP–CB7–βCD + 2H]2+. Hence the ESI-MS spectra clearly suggest that dimer species of NP are present either freely or complexed with the hosts. It has been argued that the presence of inclusion species in the gas phase could indicate their possible existence in the solution. The driving force for complex formation stems from the hydrophobic interactions leading to the formation of inclusion complexes in solution stabilized by the favorable thermodynamic balance of enthalpy and entropy. In ESI-MS, the release of guest molecules from the host cavity is favored as entropy and enthalpy oppose each other.54 Nevertheless, complexes between guest and host are mainly stabilized by hydrogen bonding and other weaker forces such as van der Waals forces. Hence protonated groups such as the primary amine in NP are expected to enhance the chances of preservation of inclusion complexes in the gas phase supported by a strong network of hydrogen bonding interaction compared to those in the solution. Therefore, the presence of all species presented in Table 1 suggests that these molecules are actually present in solution which is in line with the fluorescence data presented above.
1 inclusion complex between NP and CB7. Moreover, the interaction of dimer 2NP with CB7 is represented by a peak at m/z 751 which correspond to [2NP–CB7 + 2H]2+ ion. On the other hand, the cluster peak at m/z 1319 in Fig. S2† was found to match with the doubly charged species [2NP–CB7–βCD + 2H]2+. Hence the ESI-MS spectra clearly suggest that dimer species of NP are present either freely or complexed with the hosts. It has been argued that the presence of inclusion species in the gas phase could indicate their possible existence in the solution. The driving force for complex formation stems from the hydrophobic interactions leading to the formation of inclusion complexes in solution stabilized by the favorable thermodynamic balance of enthalpy and entropy. In ESI-MS, the release of guest molecules from the host cavity is favored as entropy and enthalpy oppose each other.54 Nevertheless, complexes between guest and host are mainly stabilized by hydrogen bonding and other weaker forces such as van der Waals forces. Hence protonated groups such as the primary amine in NP are expected to enhance the chances of preservation of inclusion complexes in the gas phase supported by a strong network of hydrogen bonding interaction compared to those in the solution. Therefore, the presence of all species presented in Table 1 suggests that these molecules are actually present in solution which is in line with the fluorescence data presented above.
FTIR spectroscopy
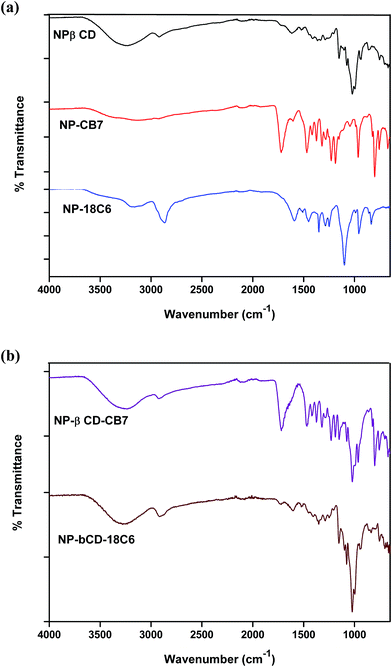
In this study binary inclusion complexes of NP with βCD, CB7 and 18C6 as well as ternary inclusion complexes of NP with βCD in presence of CB7 or 18C6 were obtained by freeze drying techniques. The FTIR spectra of pure guest and hosts are shown in Fig. S3† whereas those of binary complexes are shown in Fig. 3a. βCD is characterized by peaks at 1021, 1074 and 1151 cm−1 assigned to the C–C, C–O stretching modes and C–O–C glycosidic asymmetric vibrations.51,55Assignment of NP vibrational signals was based on literature.56 The finger-print region of 650–1260 cm−1 involves mainly bending and torsional vibrations of aromatic, –CH2 and CNH groups. The peaks at 1356 and 1590 cm−1 correspond to aromatic stretching vibrations with contributions from –CH2 and OH bending modes. By inspection of the FTIR spectra of NP and βCD one observe a large degree of overlap between the peaks of the two compounds. This indeed complicates interpretation of spectra of the inclusion complexes formed between the two compounds.
Clearly, the spectrum of NP–βCD complex resembles to a great extent the spectrum of βCD. However, few differences can be pointed out. For instance, in NP–βCD the band at 3266 cm−1 was shifted to 3248 cm−1. Most NP bands disappeared in the complex spectrum indicating that NP is deeply encapsulated into the host cavity.
The FTIR spectrum of CB7 (Fig. S3†) shows a broad and strong band at 3404 cm−1 assigned to NH-stretching vibration in addition to a band at 2933 cm−1 attributed to CH stretching vibration. The bands become broader and shifted in NP–CB7 complex is indicative of the involvement in intermolecular interactions. Moreover, the carbonyl stretching mode appears at 1713 cm−1 in CB7 is slightly shifted to 1720 cm−1 in the NP–CB7 complex. This is also an indication of formation of hydrogen bonding between the guest and the host molecules. The band at 1468 cm−1 is assigned to the C–N stretching mode. This band and all other bands below 1400 cm−1 are slightly modified by the presence of NP. In addition, it was observed that peaks pertinent to NP in this region have vanished. Again these results suggest that there are host–guest interactions between NP and CB7 that possibly lead to the formation of stable inclusion complex.
In case of NP–18C6, the spectrum of the complex also reveals that there is an interaction between NP and 18C6 regardless of the subtle differences between the spectra of host and complex. One can conclude also here that the differences in spectra mean that a complex is formed between the two compounds.
Ternary complex NP–βCD–18C6 spectrum, on the other hand, is dominated by βCD signals (Fig. 3b). Surprisingly, the main feature of this spectrum is the disappearance of the characteristic peak of 18C6 at 2862 cm−1. This peak was slightly shifted in NP–18C6 spectrum, but completely vanished in the ternary complex. A similar trend was observed when other crown ethers such as aza-18C6 were used with NP and βCD to form ternary complexes (results not shown). As in binary complexes, the peaks related to NP have completely disappeared in this complex as well. These results strongly suggest the presence of intermolecular interaction involving the three molecules.
The FTIR spectrum of NP–βCD–CB7 is also shown in Fig. 3b. It is apparent from this figure that the spectrum of NP–βCD–CB7 system contains bands that correspond to the two hosts, while those characteristic bands of NP have been diminished. For example, the signals at 1719 cm−1 and 1468 cm−1 are similar to those present in NP–CB7 spectrum. As in the above cases, the huge overlap between signals makes the identification of unique features difficult. However, the variations observed in the spectra evidently suggest that a different spectrum is obtained compared to the individual binary complexes spectrum. It is worth mentioning here that using this vibrational tool alone it is not possible to ascertain whether or not binary complexes of NP with individual host molecule are present mixed or the ternary complex is formed.
Raman spectroscopy
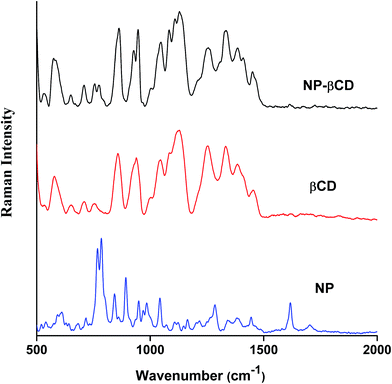
Raman spectroscopy is a complementary vibrational technique that enables investigation and characterization of inclusion complexes. The differences in vibrational frequencies position and intensity provide important clues to formation of inclusion complexes of guest molecules like NP with host molecules. The Raman spectra of NP as well as that of host βCD in neat solids are given in Fig. 4. NP Raman spectrum is characterized by sharp intense peaks in the range 500–1700 cm−1. The strong peak at 1617 cm−1 is assigned to –NH2 bending vibration. On the other hand, the band at 1283 cm−1 corresponds to CH2 stretching vibration; however, it is also believed that this peak is coupled to CO stretching vibration.57 Moreover, the strong bands at 891 and 846 cm−1 are attributed to CH2 and NH2 bending vibrations, respectively. The most significant peaks of NP are those located at 783 and 767 cm−1 originating due to catecholic ring breathing. The band at 783 cm−1 has also been reported to have contributions from CH–NH in plane bending vibrations.The Raman spectrum of NP–βCD inclusion complex prepared by freeze drying methods is also shown in Fig. 4. It is mainly dominated by βCD vibrational bands especially in the region 500–1500 cm−1. Vibrational Raman spectroscopy is known to be very sensitive to non-covalent intermolecular interactions that are usually encountered in inclusion complexes.58,59 As can be seen from Fig. 4, βCD bands are all enhanced in intensity upon complexation with NP and as well experienced slight shifts. It is also notable that all NP vibrations have vanished except for the two most prominent peaks at 783 and 767 cm−1 which were greatly reduced in intensity and shifted to 771 and 751 cm−1, respectively. Moreover, the peak at 1617 cm−1 is also reduced in intensity and shifted to 1603 cm−1. These alterations in the Raman signals of NP are in line with the formation of strong intermolecular interactions when the guest enters the cavity of the host. Additionally, the Raman bands associated with the C–O stretching modes of glycosidic linkage of βCD at 1127, 1081, 1043, 944 and 925 cm−1 have been evolved and became well separated from each other due to complexation. These bands are known to be very sensitive to the presence of guest molecules.58,59
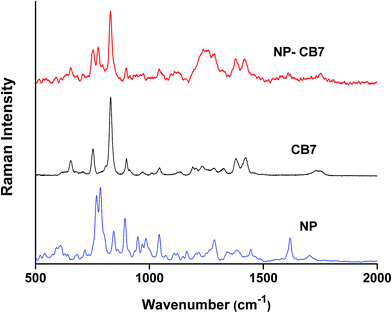
Fig. 5 shows the Raman spectra of CB7 and NP–CB7 inclusion complex prepared by freeze-drying. The bands at 830 and 897 cm−1 represent deformation of CB7 ring whereas the bands at 1377 and 1418 cm−1 are assigned to symmetric and asymmetric C–N stretching vibrations.60 The carbonyl bands appear at 1755 and 1731 cm−1. In the inclusion complex of NP–CB7 all peak positions pertinent to CB7 remained almost unchanged except for the two peaks at 1755 and 1731 cm−1 associated with the carbonyl peak which were replaced by a single peak of diminished intensity at 1744 cm−1 in the complex. Generally, CB7 peaks, unlike βCD, are all decreased in intensity compared to pure CB7. One also observes that the two peaks of NP at 783 and 767 representing the catecholic ring breathing mode appear at 774 and 750 cm−1 in the inclusion complex. This observation corroborate the assignment of these two bands in the NP–βCD complex, nonetheless one might argue that the peak at 750 cm−1 may originate from CB7 as well. The presence of the peak at 1605 cm−1 is a further confirmation of formation of inclusion complex between NP and CB7. A greater change in polarizability is associated with the breathing mode of the catecholic ring as the size of the ring changes considerably with vibrations.
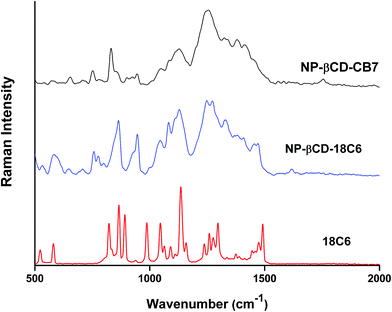
The FT-Raman spectrum of NP–βCD–18C6 freeze dried complex is shown in Fig. 6. The most prominent bands are those of βCD which were slightly shifted in position. Interestingly, the NH2 bending vibration appears in the same position as in the neat NP solid. The aromatic ring breathing bands appear at the same wavenumbers as in the binary NP–βCD complex at 773 and 755 cm−1 possibly because they are experiencing similar environment. The two bands of 18C6 at 1493 and 1472 cm−1 appear at 1469 and 1450 cm−1 in NP–βCD–18C6 inclusion complex. We also examined here the range of wavenumbers 2500–3500 cm−1 in more details. The results in Fig. 7 show that bands corresponding to 18C6 are all vanished in this region. The presence of strong intermolecular interactions might be responsible for such an observation suggesting that 18C6 is clearly involved in bonding with NP and the cyclodextrin.
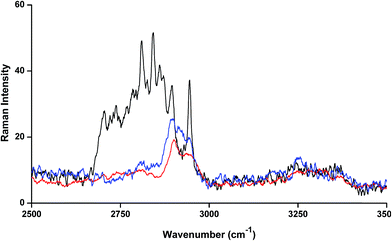 | ||
| Fig. 7 FT-Raman spectra of βCD (red line), 18C6 (black line) and NP–βCD–18C6 (blue line) freeze dried complex. | ||
Fig. 6 also shows the Raman spectrum of NP–βCD–CB7 complex which as expected contains bands related to βCD and CB7. Interestingly, the region 500–900 cm−1 is dominated by CB7 bands. The carbonyl stretching vibration is located at 1749 cm−1. Surprisingly, the catechol ring breathing bands, which were present in all spectra, have completely disappeared in this spectrum. These observations may indicate that the spectrum of NP–βCD–CB7 is not merely an overlap of binary complexes. The Raman spectrum of this species is complex due to the overlap of peaks of the components of the ternary mixture in most of the regions and this made the interpretation challenging. Nevertheless, one can conclude that there is clear indication for the formation of ternary complexes.
Powder X-ray diffraction
Powder X-ray diffraction (PXRD) is a sensitive technique usually used to investigate the crystal packing of hosts, guests and their inclusion complexes. In this work we used PXRD to look into the crystalline structures of NP, the three hosts and their respective inclusion complexes. The diffraction patterns of the pure solids of the guest and the hosts are presented in Fig. S4.† The PXRD patterns of the as-received βCD consist of distinct diffraction peaks with 2θ values near 9 and 13° in addition to other minor peaks at values of 2θ > 13°. These features are known to characterize the cage type packing structure of βCD where the cavity of each βCD is blocked by other neighboring CD molecules.51,58,59,61–63 18C6 shows characteristic signals with 2θ in the range 15–25° with the most intense peaks located at 2θ 15, 20, 24 and 25°. In case of CB7, the PXRD pattern exhibits halo structures which characterize it as a clear amorphous structure. NP is also crystalline material with characteristic peaks between 2θ ≈ 15–30°. The most intense peaks in case of NP are observed at 2θ values 15, 16, 24, 25 and 26°.The PXRD patterns of binary complexes are presented in Fig. 8. Careful examination of the patterns shown in this figure reveals the fact that these patterns are different from the starting material. They are also different from the physical mixtures obtained by mixing the starting materials in equimolar quantities in a pestle and mortar (data not shown). It worth noting here that the physical mixtures of starting materials exhibit only overlapped patterns of the original compounds. This indicates that inclusion complexes between NP and these hosts do not form by merely mixing them. The PXRD patterns of NP–βCD complex show unique 2θ values at 10.5 and 12.5° and minor diffractions at higher 2θ values. At higher 2θ values the peaks became also broader due to the possible formation of partially amorphous phase. Similar results have been reported for the interaction of βCD with various guests.51,58,59,61–63
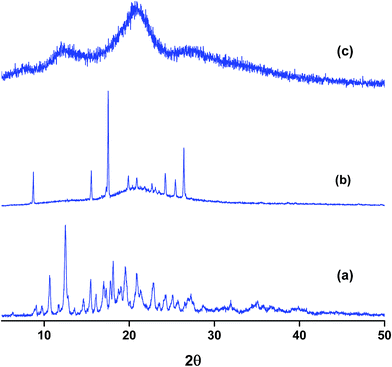
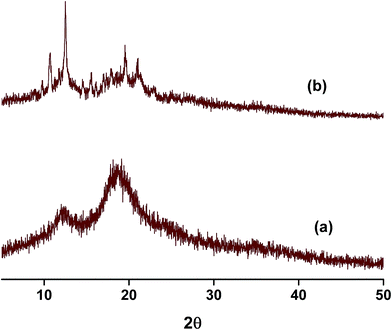
The complex between 18C6 and NP PXRD patterns are also shown in Fig. 8. These reflections are characterized by the formation of a broad halo pattern indicative of the amorphous nature of the material. However, distinct sharp peaks at 2θ values ≈ 9, 15.5, 17.5, 24.0, 25.5 and 26.5° are observed together with other minor reflections. Some of these peaks coincide with those present in the diffraction patterns of pure NP and 18C6 solids with the exception of the peak at 9° which is absent from the PXRD patterns of both compounds. The initial evaluation of these results leads to the formation of an amorphous complex with the presence of uncomplexed material. However it is worth mentioning here that recording of PXRD runs for the freeze dried NP–18C6 samples was challenging as the complex starts to absorb humidity and become wet. Therefore, further investigation of this complex is required, probably the isolation of crystals suitable for single crystal analysis might cast better understanding of the packing and interactions in these complexes.
The diffraction patterns of NP–CB7 on the other hand exhibited halo shaped signatures declaring the formation of an amorphous solid complex. Moreover, the diffraction patterns of the ternary complexes in both cases, NP–βCD–18C6 and NP–βCD–CB7 are dominated by an amorphous structure as shown in Fig. 9. Unexpectedly, NP–βCD–CB7 pattern is found to contain sharp peaks at 2θ values 10, 14.5, 19.5 and 20 on top of the halo structures suggesting the involvement of a crystalline material. These observations may be due to the simultaneous formation of more than one complex. It should be mentioned here that the four peaks observed for NP–βCD–CB7 are similar to those found in the NP–βCD complex PXRD patterns. However, the amorphous signature is different than those observed for CB7 and NP–CB7 patterns.
NMR spectroscopy
To further elucidate the interactions between NP and the three host molecules 1H-NMR spectra were obtained. The individual protons were assigned according to the chemical structures presented in Scheme 1. The 1H-NMR spectra of NP in presence of 18C6 and βCD exhibited notable shifts in some of the protons as a result of shielding of βCD inner cavity protons and deshielding of guest protons. In this work, to characterize the complexation of NP with the two hosts, 18C6 and βCD, we recorded 2D-ROESY spectra of the complexes in D2O. Fig. 10 represents a typical expanded 2D-ROESY spectrum where F1 dimension corresponds to the signals assigned to protons of βCD and 18C6, while F2 here is focused on the aromatic region of NP. Clearly, intense cross-peaks are observed for the correlation of H3, H5 and H6 of βCD with those of NP. It can be inferred from these results that protons Ha and Hc on NP are in spatial proximity to protons H3 and H5 of the cyclodextrin. Interestingly, proton Hb on NP exhibit intense cross-peaks with both H5 and H6 but not with H3. Moreover, less intense but observable cross-peaks were observed for the interaction of 18C6 with protons Ha and Hc on NP. These results are consistent with the deep encapsulation of the catecholic moiety into the hydrophobic nanocavity of βCD through the secondary hydroxyl rim. The complex is further stabilized by interaction of the ammonium group of NP with 18C6 which secure the guest into the host's cavity.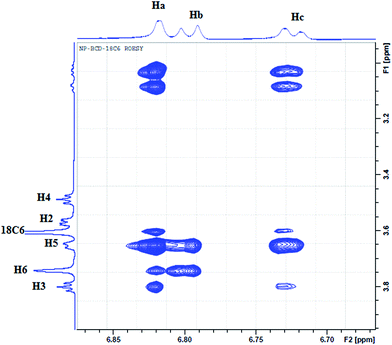 | ||
| Fig. 10 The contour plot of 2D-ROESY of NP–βCD–18C6 inclusion complex. The assignment of signals is given according to Scheme 1. | ||
Molecular dynamics
Molecular dynamic simulations were performed on NP complexes with the three hosts as well as on ternary complexes. The complexes were immersed in a box of water and calculations were performed for 15–20 ns at a pressure and temperature of 1 atm and 300 K, respectively. The average root mean square deviations (RMSDs) for all binary complexes are shown in Fig. S5.† Clearly, all complexes reach stability within short time (<1 ns). The average values obtained over trajectories after stabilization are summarized in Table 2. Evidently, these complexes are quite stable in aqueous solutions except for NP–βCD–CB7. NP–βCD–CB7 complex is formed by inserting the aromatic group into βCD cavity while leaving the side chain bearing the amine group to interact with CB7. As shown in Fig. S5c† NP forms a strong complex with βCD as evident from the stable trajectories of NP–βCD complex compared to NP–βCD–CB7 complex. Unexpectedly, we observed that CB7 starts to move away from the other two molecules following 4 ns of stability. Interestingly when we run a similar simulation with the aromatic ring of NP inserted into CB7 we observed that NP is completely taken into CB7 and βCD was pushed away. These results suggest the possible coexistence of binary and ternary complexes.| Compound | RMSD (Å) | r gyr (Å) |
|---|---|---|
| NP | 1.15 ± 0.48 | 2.75 ± 0.03 |
| 18C6 | — | 3.42 ± 0.05 |
| βCD | 1.85 ± 0.45 | 5.91 ± 0.07 |
| CB7 | 0.46 ± 0.12 | 5.49 ± 0.02 |
| NP–18C6 | 2.53 ± 0.48 | 3.99 ± 0.05 |
| NP–βCD | 1.77 ± 0.33 | 5.67 ± 0.07 |
| NP–CB7 | 0.65 ± 0.14 | 5.27 ± 0.02 |
| NP–18C6–βCD | 0.99 ± 0.23 | 5.95 ± 0.14 |
| NP–CB7–βCD | — | — |
Additionally, we monitored the radius of gyration (rgyr) of the guest, host and their corresponding inclusion complexes during the simulation time. The values obtained are summarized in Table 2. It can be observed from this table that rgyr for all complexes is close to that of the host. Moreover, the values of rgyr for the inclusion complexes are lower than the sum of the individual hosts and guest. This provides additional evidence for the stability of these complexes.
We also performed hydrogen bond analysis for all the complexes using the modules of Schrodinger software. The results collected in Fig. S6† show that a number of hydrogen bond interactions are contributing to the stability of the complexes during the simulation time. NP–βCD complex is stabilized by the presence of 1–3 hydrogen bonds (Fig. S6a†). NP size is suitable for insertion of the catechol group into the cavity of βCD via either the wider or narrower rim of the CD. Introduction of the catechol group through the wider rim, however, produced a more stable inclusion complex. Additionally, the complex formed by inserting the aromatic ring from the narrower rim shows stable trajectories for about 9 ns out of the total simulation time of 15 ns. Placing primary amine and OH groups at the entrance of the cyclodextrin allow for strong intermolecular interactions such as hydrogen bonding and dipole–ion interaction between these groups and the secondary hydroxyl groups that enfold the wider rim.
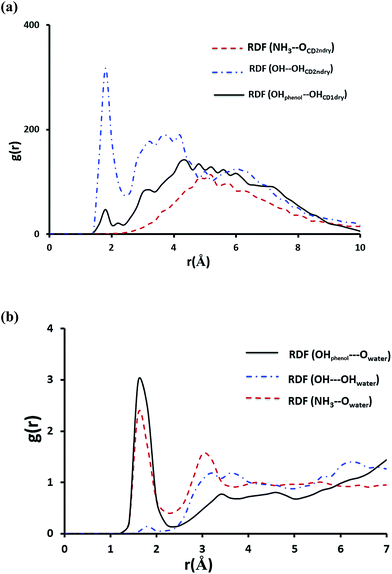
To shed more light on the interaction of NP with βCD we further obtained the radial distribution function (RDF), g(r), for the center of mass of NP relative to that of the host. The result in Fig. S7† shows a strong sharp peak at 0.2 Å clearly suggesting that NP is inserted deeply into the cavity of βCD. This position likely allows stabilization of NP inside the cavity by strong hydrogen bond interaction as shown by the strong sharp peak at ∼1.8 Å in Fig. 11a representing interaction of OH with the secondary hydroxyl groups of the CD. Also one observes a minor hydrogen-bond contribution from the phenolic OH of NP with the primary hydroxyl groups of CD. On the other hand, the protonated primary amine exhibited no noticeable interaction with the secondary hydroxyl groups of the cyclodextrin. From these results and by inspection of snapshots from the simulation it is clear that the protonated amine (highly polar group) remains solvated by water molecules outside the cavity of the cyclodextrin.
Fig. 11b shows the RDFs for the interaction of NH3+, OH and the phenolic groups with water molecules. The maximum at r ∼ 1.8 Å correspond to the first hydration shell indicating that the amino-group and the two phenolic substituents on the aromatic ring are strongly involved in hydrogen bonding with water molecules. It can be inferred from these results that NH3+ remains outside the cavity and NP catechol moiety is inserted inside the nanocavity with the two phenolic groups protruding from the narrower rim and, therefore, exposed to water molecules.
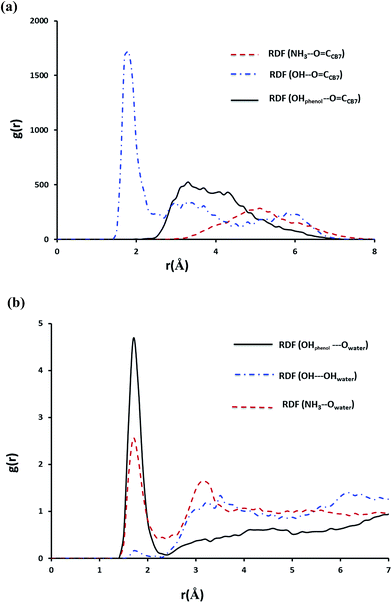
In case of the inclusion complex of NP with CB7 it was observed that one hydrogen bond prevails till the end of the simulation, however, other weaker hydrogen bond interactions are also recorded (Fig. S6a†). Let us now examine the RDFs describing hydrogen bonding of NP with CB7 and with water. The calculated RDFs are presented in Fig. 12. Obviously only the secondary OH group of NP forms a strong hydrogen bond with the C![[double bond, length as m-dash]](https://www.rsc.org/images/entities/char_e001.gif) O groups on the portal of CB7. Both NH3+ and the phenolic moieties exhibit strong interaction with the water molecules as can be inferred from Fig. 11b.
O groups on the portal of CB7. Both NH3+ and the phenolic moieties exhibit strong interaction with the water molecules as can be inferred from Fig. 11b.
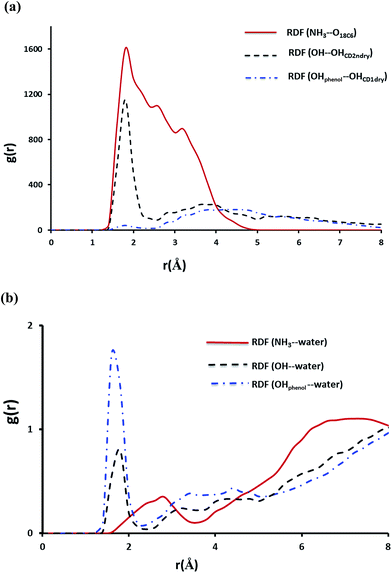
As expected for the NP–βCD–18C6 system Fig. 13 reveals the presence of hydrogen bond network as a result of interaction of NP with βCD and 18C6 simultaneously. Interestingly, βCD and 18C6 exhibited only one weak hydrogen bond that forms and break throughout the simulation time (Fig. S6b†). The distance from the center of mass of NP to that of βCD is close to that observed for NP–βCD system with the aromatic ring inside the cavity of the cyclodextrin (Fig. S8†). Here we also examined RDFs concerning the hydrogen bonding interactions in this ternary complex. As expected NH3+ group interact strongly with the crown ether oxygen atoms as represented by the strong peak at r ∼ 1.8 Å as presented in Fig. 13. Additional peaks are also observed for the amino group interaction with the crown ether at 2.5 and 3.4 Å representing weaker hydrogen bonding interactions formed during the simulation.
The hydroxyl group of NP interacts strongly with the secondary hydroxyl groups on the cyclodextrin; however, the phenolic groups exhibited a very weak interaction with the hydroxyl groups at the narrow portal of the cyclodextrin. This may originate from the interaction of 18C6 with NP which may require tilting and moving the molecule up to achieve favorable positions for maximum intermolecular interactions.
The interaction of NP with water molecules in the ternary complex is represented by Fig. 13b. As expected the phenolic groups preserved their contacts with water as shown in this figure. However, the hydroxyl group of NP exhibited strong interaction with water compared to those observed in NP–βCD and NP–CB7 binary complexes. To interpret these results we obtained snapshots for the ternary complex during the simulation times. Representative snapshots are shown in Fig. S9.† We observed that due to the strong interaction between the amino group and the crown ether oxygen atoms NP molecule is dragged up into the cavity of the CD. This in turn moves the OH to the pocket between 18C6 and βCD where water molecules can enter to form a network of hydrogen bonds involving OH, CD secondary OH groups and the crown ether. This leads to additional stabilization of this complex.
Conclusion
The fluorescence, ESI-MS, vibrational spectroscopy, 1H-NMR spectroscopy and PXRD data presented in this work reveal that NP forms stable inclusion complexes with the three hosts. The data also indicate that stable ternary complexes involving NP in presence of 18C6/βCD and CB7/βCD are formed. Molecular dynamic simulations of inclusion complexes in aqueous media have indicated that insertion of the aromatic ring into the cavity of βCD and CB7 is the most acceptable mechanism of the inclusion process. Moreover, the strong hydrogen bond interactions between hosts and the guest are responsible for the stability of these complexes. It would be tempting, however, to conclude that NP–18C6–βCD is a more stable complex compared to NP–CB7–βCD. While the inclusion of NP into the nanocavity of βCD and CB7 seems to be controlled by hydrophobic forces, hydrogen bonding and ion–dipole interactions plays significant role in stabilizing these compounds. This could be the main reason behind the tendency of these complexes to aggregate in solution.Acknowledgements
S. K. S. Al Burtomani acknowledges support from SQU. The technical support by Central Analytical and Applied Research Unit (CAARU) and Nanotechnology Center at SQU is highly appreciated.References
- E. Masson, X. Ling, R. Joseph, L. Kyeremeh-Mensah and X. Lu, RSC Adv., 2012, 2, 1213–1247 RSC.
- Z. Miskolczy and L. Szló Biczó, Phys. Chem. Chem. Phys., 2014, 16, 20147–20156 RSC.
- K. I. Assaf and W. M. Nau, Chem. Soc. Rev., 2015, 44, 394–418 RSC.
- S. J. Barrow, S. Kasera, M. J. Rowland, J. Del Barrio and O. A. Scherman, Chem. Rev., 2015, 115, 12320–12406 CrossRef CAS.
- M. N. Shewale, D. N. Lande and S. P. Gejji, J. Mol. Liq., 2016, 216, 309–317 CrossRef CAS.
- S. Li, X. Miao, I. W. Wyman, Y. Li, Y. Zheng, Y. Wang, D. H. Macartney and R. Wang, RSC Adv., 2015, 5, 56110–56115 RSC.
- X.-D. Xiao, L. Shi, L.-H. Guo, J.-W. Wang and X. Zhang, Spectrochim. Acta, Part A, 2017, 173, 6–12 CrossRef CAS.
- J. Ma, F. Shi, D. Tian and H. Li, Chem.–Eur. J., 2016, 22, 13805–13809 CrossRef CAS.
- M. V. Rekharsky and Y. Inoue, Chem. Rev., 1998, 98, 1875–1918 CrossRef CAS.
- J. Szejtli, Chem. Rev., 1998, 98, 1743–1753 CrossRef CAS.
- G. W. Gokel, W. M. Leevy and M. E. Weber, Chem. Rev., 2004, 104, 2723–2750 CrossRef CAS.
- O. P. Kryatova, I. V. Korendovych and E. V. Rybak-Akimova, Tetrahedron, 2004, 60, 4579–4588 CrossRef CAS.
- K. M. Doxsee, P. E. Francis Jr and T. J. R. Weakley, Tetrahedron, 2000, 56, 6683–6691 CrossRef CAS.
- J. Zhou, J. Tang and W. Tang, TrAC, Trends Anal. Chem., 2015, 65, 22–29 CrossRef CAS.
- L. Escuder-Gilabert, Y. Martín-Biosca, M. J. Medina-Hernández and S. Sagrado, J. Chromatogr. A, 2014, 1357, 2–23 CrossRef CAS.
- P. Řezanka, K. Navrátilová, M. Řezanka, V. Král and D. Sýkora, Electrophoresis, 2014, 35, 2701–2721 CrossRef.
- G. Gübitz and M. G. Schmid, J. Chromatogr. A, 2008, 1204, 140–156 CrossRef.
- G. K. E. Scriba, J. Sep. Sci., 2008, 31, 1991–2011 CrossRef CAS.
- I. W. Muderawan, T.-T. Ong and S.-C. Ng, J. Sep. Sci., 2006, 29, 1849–1871 CrossRef CAS.
- W. X. Huang, H. Xu, S. D. Fazio and R. V. Vivilecchia, J. Chromatogr. A, 2000, 875, 361–369 CrossRef CAS.
- T. Koide and K. Ueno, J. Chromatogr. A, 2001, 923, 229–239 CrossRef CAS.
- C. Zhang, W. X. Huang, Z. Chen and A. M. Rustum, J. Chromatogr. A, 2010, 1217, 4965–4970 CrossRef CAS.
- A. A. A. A. Elbashir and F. O. F. O. Suliman, J. Chromatogr. A, 2011, 1218, 5344–5351 CrossRef CAS.
- Q. Zhu, S. H. Heinemann, R. Schönherr and G. K. E. Scriba, J. Sep. Sci., 2014, 37, 3548–3554 CrossRef CAS.
- B. Minea, N. Marangoci, D. Peptanariu, I. Rosca, V. Nastasa, A. Corciova, C. Varganici, A. Nicolescu, A. Fifere, A. Neamtu, M. Mares, M. Barboiu and M. Pinteala, New J. Chem., 2016, 40, 1765–1776 RSC.
- S. Saha, T. Ray, S. Basak and M. N. Roy, New J. Chem., 2016, 40, 651–661 RSC.
- T. Aree and S. Jongrungruangchok, Carbohydr. Polym., 2016, 140, 362–373 CrossRef CAS.
- J. Kicuntod, W. Khuntawee and P. Wolschann, J. Mol. Graphics Modell., 2016, 63, 91–98 CrossRef CAS.
- R. B. Pellegrino Vidal, G. A. Ibañez and G. M. Escandar, RSC Adv., 2015, 5, 20914–20923 RSC.
- A. Arrais and P. Savarino, J. Inclusion Phenom. Macrocyclic Chem., 2009, 64, 73–81 CrossRef CAS.
- M. I. Sancho, S. A. Andujar, R. D. Porasso and R. D. Enriz, J. Phys. Chem. B, 2016, 120, 3000–3011 CrossRef CAS.
- I. Terekhova, R. Kumeev, G. Alper, S. Chakraborty, H. Pérez-Sánchez and E. Núñez-Delicado, RSC Adv., 2016, 6, 49567–49577 RSC.
- N. F. A. F. A. Dsugi, A. A. A. Elbashir and F. E. O. O. Suliman, Spectrochim. Acta, Part A, 2015, 151, 360–367 CrossRef CAS.
- F. O. O. Suliman, A. A. A. Elbashir and O. J. J. Schmitz, J. Inclusion Phenom. Macrocyclic Chem., 2015, 83, 119–129 CrossRef CAS.
- B. Varghese, S. N. Al-Busafi, F. O. Suliman and S. M. Z. Al-Kindy, Spectrochim. Acta, Part A, 2015, 136, 661–671 CrossRef CAS.
- S. Alavi, K. Udachin, I. Moudrakovski, R. Susilo and J. a Ripmeester, J. Chem. Eng. Data, 2011, 60, 389–397 CrossRef.
- T. D. E. Hugh and C. Hemmings, Pharmacology and Physiology for Anesthesia: Foundations and Clinical Applications, Elsevier Saunders, 2013 Search PubMed.
- D. A. Schwinn, in Cardiac Anesthesia: Principles and Clinical Practice, ed. J. G. R. Fawzy, G. Estafanous and Paul G. Barash, Lippincott Williams & Wilkins, Philadelphia, 2nd edn, 2001, p. 84 Search PubMed.
- A. Antony Muthu Prabhu, V. K. Subramanian and N. Rajendiran, Spectrochim. Acta, Part A, 2012, 96, 95–107 CrossRef CAS.
- N. Rajendiran, T. Mohandoss and J. Thulasidasan, J. Fluoresc., 2014, 24, 1003–1014 CrossRef CAS.
- B. Bernardo-Maestro, F. López-Arbeloa, J. Pérez-Pariente and L. Gómez-Hortigüela, J. Phys. Chem. C, 2015, 119, 28214–28225 CrossRef CAS.
- T. Álvaro-Muñoz, F. López-Arbeloa, J. Pérez-Pariente and L. Gómez-Hortigüela, J. Phys. Chem. C, 2014, 118, 3069–3077 CrossRef.
- X. Y. Gong and P. C. Hauser, J. Chromatogr. A, 2005, 1094, 196–199 CrossRef CAS.
- D. W. Armstrong, L. W. Chang and S. S. C. Chang, J. Chromatogr. A, 1998, 793, 115–134 CrossRef CAS.
- J. J. P. Stewart, J. Mol. Model., 2013, 19, 1–32 CrossRef CAS.
- K. J. Bowers, E. Chow, H. Xu, R. O. Dror, M. P. Eastwood, B. A. Gregersen, J. L. Klepeis, I. Kolossvary, M. A. Moraes, F. D. Sacerdoti, J. K. Salmon, Y. Shan and D. E. Shaw, in Proceedings of the ACM/IEEE conference on Supercomputing (SC '06), Tampa, Florida, 2006, p. 84 Search PubMed.
- D. E. Shaw, Desmond Molecular Dynamics System, New York, NY, 2009 Search PubMed.
- U. Essmann, L. Perera, M. Berkowitz, T. Darden, H. Lee and L. Pedersen, J. Chem. Phys., 1995, 103, 8577–8593 CrossRef CAS.
- T. Koide and K. Ueno, J. Chromatogr. A, 2001, 923, 229–239 CrossRef CAS.
- W. S. Jeon, K. Moon, S. H. Park, H. Chun, Y. H. Ko, Y. Lee, E. S. Lee, S. Samal, N. Selvapalam, M. V Rekharsky, D. Sobransingh, Y. Inoue, A. E. Kaifer, K. Kim, W. S. Jeon, K. Moon, S. H. Park and H. Chun, J. Am. Chem. Soc., 2005, 2, 12984–12989 CrossRef PubMed.
- T. Uyar, M. A. Hunt, H. S. Gracz and A. E. Tonelli, Cryst. Growth Des., 2006, 6, 1113–1119 CrossRef CAS.
- T. J. Brett, J. M. Alexander and J. J. Stezowski, J. Chem. Soc., Perkin Trans. 2, 2000, 6, 1095–1103 RSC.
- T. J. Brett, M. Alexander and J. J. Stezowski, J. Chem. Soc., Perkin Trans. 2, 2000, 6, 1105–1111 RSC.
- P. Jackson and M. I. Attalla, Rapid Commun. Mass Spectrom., 2010, 24, 3567–3577 CrossRef CAS.
- M. I. Sancho, S. Andujar, R. D. Porasso and R. D. Enriz, J. Phys. Chem. B, 2016, 120, 3000–3011 CrossRef CAS.
- S. Pande, S. Jana, A. K. Sinha, S. Sarkar, M. Basu, M. Pradhan, A. Pal, J. Chowdhury and T. Pal, J. Phys. Chem. C, 2009, 113, 6989–7002 CrossRef CAS.
- S. Pande, S. Jana, A. K. Sinha, S. Sarkar, M. Basu, M. Pradhan, A. Pal, J. Chowdhury and T. Pal, J. Phys. Chem. C, 2009, 113, 6989–7002 CrossRef CAS.
- L. Cunha-Silva and J. J. C. Teixeira-Dias, New J. Chem., 2005, 29, 1335–1341 RSC.
- L. Cunha-Silva and J. J. C. Teixeira-Dias, New J. Chem., 2004, 28, 200–206 RSC.
- Y. Chen, A. Klimczak, E. Galoppini and J. V Lockard, RSC Adv., 2013, 3, 1354–1358 RSC.
- D. Mentzafos, I. M. Mavridis, G. Le Bas and G. Tsoucaris, Acta Crystallogr., Sect. B: Struct. Crystallogr. Cryst. Chem., 1991, 47, 746–757 CrossRef.
- D. Mentzafos, I. M. Mavridis and M. B. Hursthouse, Acta Crystallogr., Sect. C: Cryst. Struct. Commun., 1996, 52, 1220–1223 CrossRef.
- F. Kayaci and T. Uyar, J. Agric. Food Chem., 2011, 59, 11772–11778 CrossRef CAS PubMed.
Footnote |
| † Electronic supplementary information (ESI) available. See DOI: 10.1039/c6ra28638k |
| This journal is © The Royal Society of Chemistry 2017 |

