 Open Access Article
Creative Commons Attribution 3.0 Unported Licence
Study on the stabilization mechanism of crude oil emulsion with an amphiphilic polymer using the β-cyclodextrin inclusion method
Yao Lu,
Wanli Kang *,
Jiatong Jiang,
Jun Chen,
Derong Xu,
Pengyi Zhang,
Liming Zhang,
Haishun Feng and
Hairong Wu*
Research Institute of Enhanced Oil Recovery, China University of Petroleum (Beijing), Beijing, P. R. China 102249. E-mail: kangwanli@cup.edu.cn; hrwu@cup.edu.cn; Tel: +86-13589332193 Tel: +86-15010260120
First published on 23rd January 2017
Abstract
To investigate the contribution of hydrophobic groups of hydrophobically modified polyacrylamide (HMPAM) to stabilizing crude oil emulsion, the β-cyclodextrin (β-CD) inclusion method based on host–guest interaction is proposed. Dynamic light scattering is employed to study the stability of O/W emulsions prepared by HMPAM and inclusion complexes. The emulsions are evaluated in terms of droplet size distribution, rheological properties and interfacial tension. It is found that the stability of emulsions stabilized by HMPAM decreases with the increase of β-CD, indicating that β-CD can effectively shield the hydrophobic groups in the emulsification process of crude oil through the formation of an inclusion complex. Consequently, the network structure composed of associated amphiphilic polymers is destroyed, resulting in released polymer molecules with none of the hydrophobic groups. Moreover, the emulsion stabilizing mechanism of HMPAM with different β-CD amounts is discussed. Based on Turbiscan Stability Index (TSI) analysis, the contribution degree of the hydrophobic group of HMPAM in stabilizing emulsions (ECh) is determined for the first time. The emulsifying ability of amphiphilic polymers is mainly attributed to the hydrophobic groups (ECh > 80%) of the amphiphilic polymers while the concentration of HMPAM is above the critical aggregation concentration (CAC). This research provides theoretical guidance for studying the emulsification and de-emulsification mechanism of emulsions stabilized by amphiphilic polymers which are widely applied in tertiary oil recovery.
1. Introduction
As the majority of oilfields in China have entered the later high water cut stage, tertiary oil recovery has become an important technique in oil and gas field development. Recent pilot tests show that the formation of a stable oil-in-water (O/W) emulsion can enhance oil recovery.1–3 The emulsified droplets of remaining oil may provide microscopic mobility control through entrapment and local permeability reduction, or be transported through formation pores thereby improving the displacement efficiency.4,5 In the flooding process, the long-term stability of crude oil emulsions is essential; however, easy de-emulsification is required in processing the produced fluids.6–8 Thus, the stabilizing mechanism of crude oil emulsions is of great significance to oil and gas field development.As a typical oil displacement agent, amphiphilic polymers display good thickening capability and surfactivity, both of which help to enable the formation of stable O/W emulsions.9–13 There are a small amount of branched hydrophobic chains on the hydrophilic main chain of the amphiphilic polymers.14,15 The presence of hydrophobic groups enables the capability for amphiphilic polymer in lowering the oil–water interfacial tension and emulsifying crude oil. Meanwhile, viscosity of the amphiphilic polymers increases significantly because of the formation of the network structure owing to intermolecular hydrophobic association among polymers.
Previous studies on the crude oil emulsion stabilized by amphiphilic polymer have mainly focused on the role of hydrophobic groups of amphiphilic polymer.16–18 One approach is to synthesize the polymers either with or without hydrophobic moieties, followed by comparison of their emulsification properties.11,18–20 Nevertheless, it is difficult to guarantee that the molecular structures of two kinds of polymer are exactly the same except for the hydrophobic modification. Another approach is to introduce an additive such as surfactants,21 which could weaken the effect of the hydrophobic groups. However, surfactants will influence the emulsion stability.22 Moreover, the degree of contribution of hydrophobic groups in amphiphilic polymers in stabilizing oil emulsion is not available in previous studies. A feasible way, which was proposed in 1994, to inhibit the effect of hydrophobic groups is using the host–guest interaction by cyclodextrin (CD).23
CDs are doughnut-shaped cyclic oligosaccharides of glucose units linked together by α-1,4 bonds. The most common CDs are composed of 6, 7 or 8 glucose units and denoted as α, β, or γ-CDs, respectively.24,25 Each CD molecule consists of a hydrophobic inner core and a hydrophilic outer shell, making it possible to include the hydrophobic moieties of the polymer and form inclusion complex.26,27 Several host–guest polymer systems based on CD modified polymer for enhanced oil recovery were proposed in recent years.28–31 Based on the host–guest interaction, CD modified acrylamide polymers can enhance the polymer–polymer association then increasing the viscosity of the system while CD monomers can inhibit the association. By hiding the hydrophobic moieties of amphiphilic polymers within the cavities of CD molecules, the amphiphilic polymer solutions are expected to virtually behave like solutions formed from their unmodified analogues.32–35
It is feasible to shield the hydrophobic groups through the host–guest interaction of CD to modulate the emulsion properties with amphiphilic polymer as well as analyze the role of hydrophobic groups in stabilizing emulsions. Hence, the inevitable difference originated from the two kinds of polymer in the aforementioned chemical synthesis method is avoided. Consequently, it is more convenient and convincing to demonstrate the contributions of hydrophobic groups in the emulsification of crude oil. Although there are reports mentioning that the special structure of CD may have emulsification effect on part of oily molecules,36,37 the emulsification phenomenon between CD aqueous solution and Changqing crude oil with complicated components has not been observed in the current study.
Herein, β-CD is employed as the host compound. By comparing the emulsifying properties of hydrophobically modified polyacrylamide (HMPAM) and inclusion system, the stabilizing mechanism of HMPAM or inclusion complex stabilized O/W emulsions was explored. Meanwhile, the role of hydrophobic groups of HMPAM in the emulsification process was discussed. The current research provides theoretical guidance in studying emulsification, migration in the formation and de-emulsification of emulsion stabilized by amphiphilic polymer.
2. Experimental
2.1 Materials
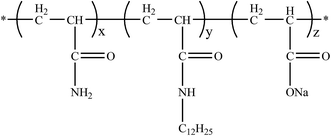
The amphiphilic polymer used in this work is HMPAM, which is provided by Shanghai Haibo Oilfield Chemicals Co., Ltd. (Shanghai, China). Its molecular weight is 570 × 104 g mol−1. The hydrophobic monomer is N-dodecylacylamide with a molar substitution of 1.5%. The degree of hydrolysis of the applied polymer is about 16%. The molecular structure of HMPAM is illustrated in Fig. 1.The experimental crude oil is supplied by Changing oilfield. Properties of the crude oil and components of the simulated formation water are given in Tables 1 and 2, respectively. As seen in Table 1, the resin and asphaltene contents are low.
| Properties | Values |
|---|---|
| Density at 30 °C (g cm−3) | 0.845 |
| Viscosity at 30 °C (mPa s) | 7.6 |
| Saturate (%) | 80.31 |
| Aromatics (%) | 15.43 |
| Resin (%) | 4.25 |
| Asphaltene (%) | 0.01 |
| Acid value (mg KOH per g) | 0.07 |
| Ions | K+/Na+ | Mg2+ | Ca2+ | Cl− | SO42− | HCO3− | CO32− | Total |
|---|---|---|---|---|---|---|---|---|
| Concentration (mg L−1) | 1519 | 27 | 29 | 994 | 7 | 2324 | 100 | 5000 |
β-CD (purity ≥ 98%) is provided by Shanghai Jingchun Biochemical Technology Co., Ltd. (Shanghai, China). It was recrystallized with distilled water prior to use. NaCl, Na2CO3, Na2SO4, NaHCO3, CaCl2 and MgCl2·6H2O, which are all analytical pure reagents, are provided by Sinopharm Chemical Reagent Co., Ltd. (Shanghai, China). Deionized water is used for the preparation of all aqueous solutions.
2.2 Measurements
The inclusion complex (IC) solutions were prepared by adding appropriate amount of β-CD to the HMPAM solution with gentle stirring for 30 min to ensure complete dissolution of β-CD. Then the solutions were stood for another 12 h at 45 °C.
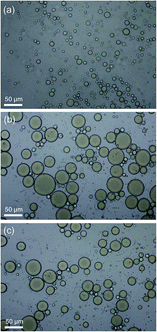
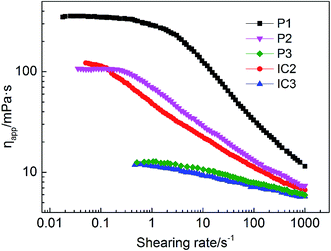
Compositions of five kinds of aqueous systems prepared for emulsification are listed in Table 3, where systems initiated with P are HMPAM solutions and systems initiated with IC are HMPAM solutions with addition of β-CD. IC2 and P2 display similar apparent viscosity within an error of 5 mPa s; the same situation has been found for IC3 and P3. These aqueous solutions were prepared to further investigate the stabilizing mechanism of emulsions.
| Sample | Composition of water phase | Viscosity (6 rpm)/mPa s |
|---|---|---|
| P1 | 1500 mg L−1 HMPAM | 433 |
| P2 | 1200 mg L−1 HMPAM | 215 |
| P3 | 750 mg L−1 HMPAM | 47 |
| IC2 | 1500 mg L−1 HMPAM + 500 mg L−1 β-CD | 217 |
| IC3 | 1500 mg L−1 HMPAM + 1000 mg L−1 β-CD | 51 |
![[thin space (1/6-em)]](https://www.rsc.org/images/entities/char_2009.gif) :
:![[thin space (1/6-em)]](https://www.rsc.org/images/entities/char_2009.gif) 9, v/v) at 45 °C using a FM-200 homogenizer (Fluko Corp., German) at a rotating speed of 3000 rpm for 5 min. The microstructure of emulsions was photographed by XSJ-2 optical microscope (Chongqing Optical Instrument Corp., China).
9, v/v) at 45 °C using a FM-200 homogenizer (Fluko Corp., German) at a rotating speed of 3000 rpm for 5 min. The microstructure of emulsions was photographed by XSJ-2 optical microscope (Chongqing Optical Instrument Corp., China).
 | (1) |
 | (2) |
The parameter termed as Turbiscan Stability Index (TSI) is employed for stability evaluation of the disperse system. The following calculating formula is applied:
 | (3) |
ECh (emulsification contribution-rate of hydrophobic groups) can be used to characterize the contribution of hydrophobic groups of amphiphilic polymers in stabilizing crude oil emulsions. The following calculating formula is applied:
 | (4) |
The viscoelastic law of emulsion system can be expressed by Maxwell model:40
 | (5) |
 | (6) |
 can be used to calculate the relaxation time which is the time period of relaxation process when the emulsion is subjected to stress.41,42
3. Results and discussion
3.1 Effect of β-CD on the stability of polymer emulsions
The bottle test method was applied to evaluate emulsification capability of formation water with 0–3000 mg L−1 β-CD for crude oil. The results are presented in Fig. 3. It can be observed that regardless how much the concentration of β-CD is, obvious phase separation appears in all prepared emulsions within 30 min and the lower water phases show high clearness. On the one hand, this could be attributing to the very low level of surface active material such as naphthenic acid, fatty acid, resin and asphaltene in the provided Changqing crude oil (see Table 1). On the other hand, due to complexities of crude oil components, β-CD in aqueous solution cannot include guest molecules from the oil phase effectively. As a result, β-CD as an emulsifier based on the mechanism of host–guest interaction and Pickering emulsion36,37 does not work in the current study. Therefore, emulsification between β-CD and crude oil may not be considered in the following experiments. | ||
| Fig. 3 Appearance of emulsions prepared with various concentrations of β-CD (mg L−1, 30 min after preparation, T = 45 °C). | ||
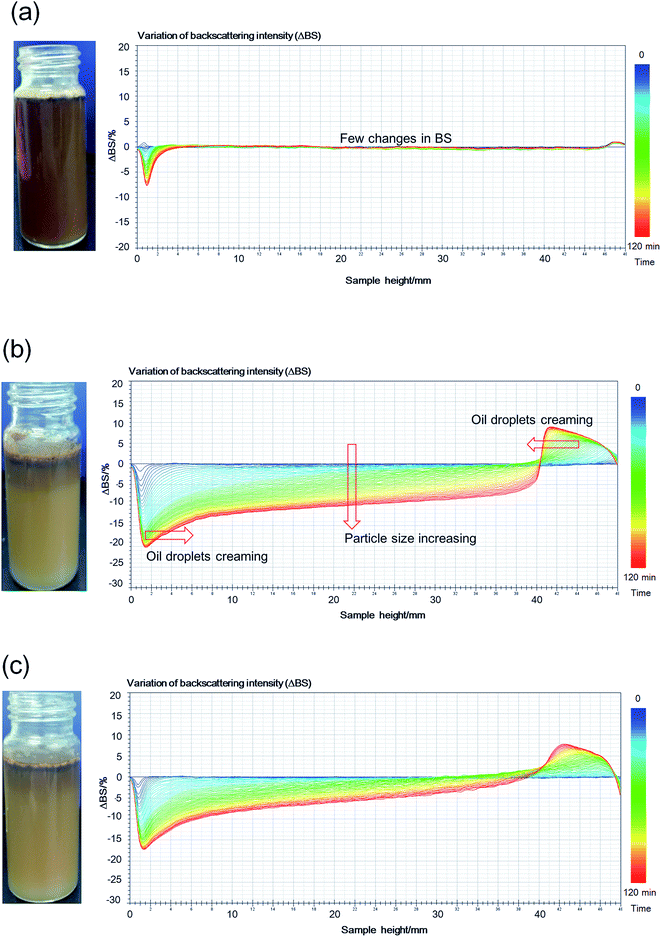 | ||
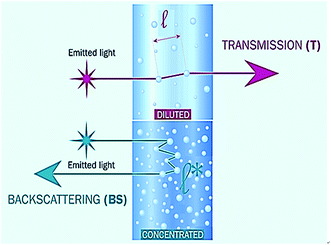
| Fig. 4 Backscattering profile and photograph (2 h after preparation) of O/W emulsions stabilized by HMPAM or IC. (a) P1, (b) IC3, (c) P3 (T = 45 °C). | ||
As shown in Fig. 4a, there are few changes in BS of P1 within a range of 10%, indicating that there is no obvious particle growth or migration in the solution. In Fig. 4b, BS of the IC3 emulsion sample decreases overall with time when the height is below 40 cm, indicating the presence of flocculation and coalescence of emulsified oil droplets. Meanwhile, the flocculation and coalescence lead to the increase of particle size. Peak width in the bottom and top of the bottle increases with time. This is most plausibly attributing to the migration of large oil droplets from the bottom to the top of the bottle owing to the density difference between oil and formation water. Migration of the large oil droplets causes the decrease of BS in the bottom of the sample owing to the decrease of oil volume fraction. Accordingly, BS in the top of the sample increases owing to the increase of oil volume fraction.43 In the destabilization process, flocculation, coalescence and creaming occur simultaneously. The larger the particle size of oil droplets is, the easier the migration is. Schematic diagram of growth and migration of emulsified oil droplets in the destabilization process is shown in Fig. 5.
 | ||
| Fig. 5 Schematic diagram of growth and migration of emulsified oil droplets in the destabilization process. | ||
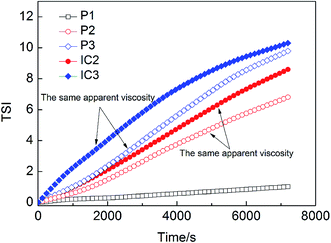
TSI values of various systems are calculated and plotted as a function of time (see Fig. 6). With the increase of β-CD concentration, the stability of emulsion stabilized by HMPAM decreases because of spontaneous inclusion association between hydrophobic groups and β-CD after shearing with the homogenizer. This result is also consistent with the BS changes (see Fig. 4a and b). The ECh value of 1500 mg L−1 HMPAM calculated according to eqn (4) is 91.60%.
In Fig. 6, TSI value of IC2 and IC3 emulsions is greater than that of P2 and P3 emulsions, respectively, indicating the lower stability of IC emulsions as compared with that of the polymer emulsions. Moreover, P3 emulsion exhibits (see Fig. 4c) similar destabilization phenomenon to IC3 emulsion (see Fig. 4b), albeit its change in BS is less than that of IC3. Two kinds of systems present similar apparent viscosity. The stability difference is most plausibly attributed to the fact that free hydrophobic groups exist in HMPAM systems while they are included completely or partially by β-CD in ICs.
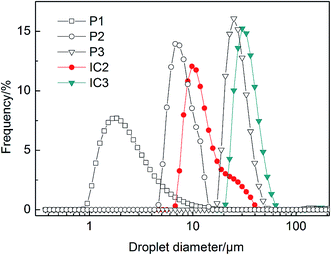
According to the Stokes equation,44,45
 | (7) |
3.2 Inclusion complexation of HMPAM and β-CD
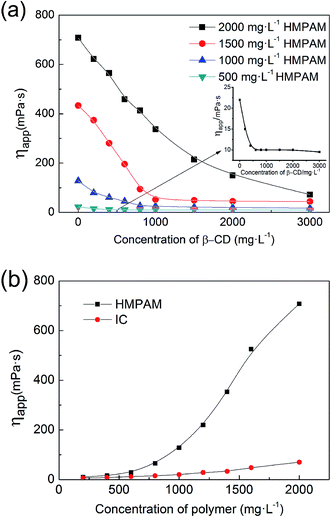 | ||
| Fig. 9 (a) Effect of concentration of β-CD on the apparent viscosity of HMPAM, (b) viscosity–concentration curves of HMPAM and IC with excessive β-CD (T = 45 °C, pH = 7, 6 rpm). | ||
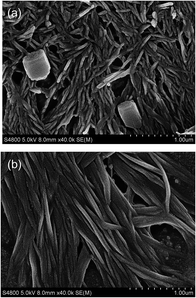
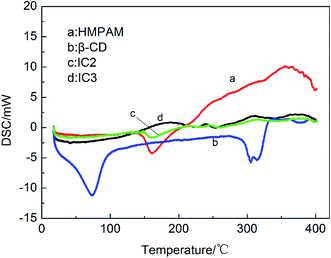
Changes in solution viscosity after the addition of β-CD indicate that there is host–guest interaction between β-CD and HMPAM molecules. However, the β-CD may interact with either the polymer main chain or the hydrophobic side chain. To determine whether there is interaction between β-CD and polymer backbone, partially hydrolyzed polyacrylamide (HPAM), with the identical backbone structure to HMPAM apart from the absence of hydrophobic side chains is used. As shown in Fig. 10, the viscosity of HPAM does not vary with the addition of β-CD, indicating that there is no host–guest interaction between β-CD and the polymer backbone.
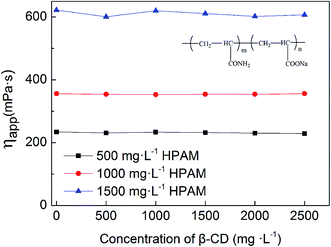 | ||
| Fig. 10 Effect of concentration of β-CD on the apparent viscosity of various concentrations of HPAM (T = 45 °C, pH = 7, 6 rpm). | ||
The decrease of HMPAM viscosity arises from high binding constant (K = 1.21 × 10⁵ L mol−1) between β-CD and hydrophobic side chain, C12.46 In the HMPAM aqueous solution with a concentration above CAC, massive hydrophobic clusters and a dense network structure form due to the intermolecular association between polymer chains (see Fig. 11a). However, addition of β-CD monomers prompts decoupling of the hydrophobic association via formation of inclusion complex with the polymer hydrophobic tails, resulting in a dramatic decrease in the viscoelastic response of the weakened network structure (see Fig. 11b). Inflection points (in Fig. 9a) suggest that the hydrophobic groups are included completely. There is also a viscosity reduction in 500 mg L−1 HMPAM (see Fig. 9a) where intramolecular association dominates the solution behavior, indicating that there is still slight amount of intermolecular association in the solution.
3.3 Rheology of emulsions
In Fig. 13, the Newtonian platform is more obvious in P2 emulsion as compared with that of IC2. This is because in P2 emulsion there are more free hydrophobic groups, which enable a higher structural viscosity as compared with IC2. However, nearly no difference has been found for shear rheology property between IC3 and P3 emulsions. In spite of similar shear rheology property, the mechanism behind differs. For the P3 emulsion, only a small amount of free hydrophobic groups are involved in the formation of the intermolecular associative structure; thereby, the strength of the intermolecular associative structure is rather low. For the IC3 emulsion, hydrophobic groups are included, making it impossible to form the intermolecular association; thus the solution behavior is more like Newtonian fluid.
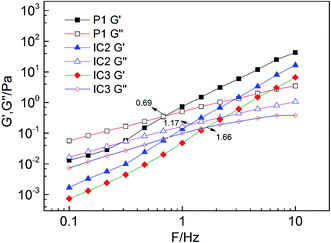
It is found that with the increase of concentration of β-CD, both G′ and G′′ decrease. This is easy to be understood since destruction of network structure of HMPAM by inclusion association causes the decrease of both viscosity and elasticity of emulsions. The relaxation time of emulsion systems is calculated according to eqn (5) and (6) and the effect of β-CD on the relaxation time is shown in Table 4. With the increase of β-CD concentration, the relaxation time decreases from 0.23 s to 0.10 s. It indicates that due to the formation of host–guest system, large-size kinematic unit of the polymer network is changed into small-size ones composed of single polymer molecules. Molecular thermal motion is strengthened and the creaming rate of emulsion increases correspondingly.
| β-CD/mg L−1 | 0 | 500 | 1000 |
|---|---|---|---|
| Frequency/Hz | 0.693 | 1.170 | 1.662 |
| τR/s | 0.230 | 0.136 | 0.096 |
3.4 The adsorption of polymers on the interfacial film
To verify the adsorption of HMPAM and interaction between β-CD and hydrophobic groups on the oil–water interfacial film, oil–water interfacial tension of polymer solutions with β-CD was measured. As shown in Fig. 15, the interfacial tension between oil and brine only with the addition of β-CD has almost no change; this further proves the poor emulsification capability of β-CD. For the HMPAM emulsions, with the increasing concentration of β-CD, interfacial tension increases at first and keeps constant when the concentration of β-CD is above 1000 mg L−1. Interfacial tensions of P2 and P3 are less than those of IC2 and IC3, respectively. The co-existence of hydrophobic and hydrophilic groups is essential for the amphiphilicity of the polymers. Polymer molecules can adsorb on the oil–water interface and decrease the interfacial tension. Inclusion of β-CD can reduce the amount of hydrophobic groups adsorbed in the oil phase, thus the interfacial activity decreases.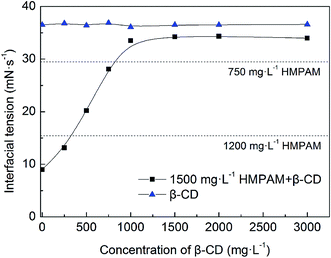 | ||
| Fig. 15 Interfacial tension between oil and HMPAM solutions containing different concentrations of β-CD (T = 45 °C). | ||
It is essential to point out that although the apparent viscosity of the dispersion medium appears to be a key factor, it is not the only factor in stabilizing O/W emulsions. In spite P3 and IC3 display the similar apparent viscosity, there is still a difference of interfacial tensions between them. Hence the emulsion stability enhancement (see Fig. 10) can be attributed to a stronger adsorption of the polymer at the interface due to hydrophobic groups instead of the viscosification of the dispersion medium. This interpretation also works for the systems of P2 and IC2.
3.5 Stabilization mechanism of emulsions with IC
On the basis of the results above, it can be concluded that HMPAM can easily adsorb on the oil–water interface, leading to the decrease both in oil–water interface tension and the average particle size of oil droplets (see Fig. 16a). Viscoelastic interfacial film can form due to the synergistic effect of molecular backbone and hydrophobic groups.50 High structural viscosity can be rendered by intermolecular association among other hydrophobic chains of HMPAM. The adsorption layer and network structure can effectively prevent droplets from moving and impacting with each other thus avoiding the formation of a bigger droplet.20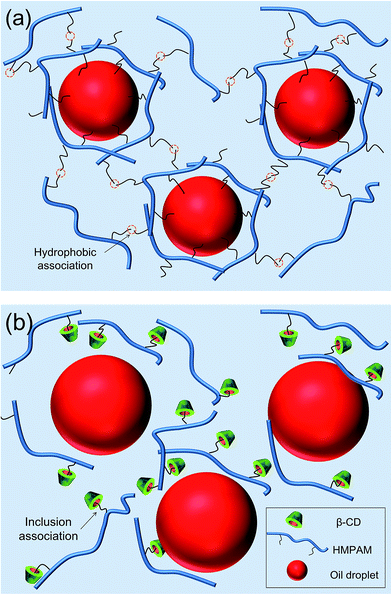 | ||
| Fig. 16 The sketches of stabilization mechanism of emulsion stabilized by (a) HMPAM and (b) HMPAM with β-CD. | ||
For the emulsion stabilized by IC, the hydrophobic groups of HMPAM will be shielded by addition of β-CD (see Fig. 16b). First, without exposed hydrophobic groups, HMPAM cannot effectively adsorb on the oil–water interface, making it easier for the droplets to impact with each other and form bigger droplets. Second, original network structure of HMPAM is destroyed. The structural viscosity largely decreases. Coalescence rate and creaming rate both increase. Correspondingly, the stability of O/W emulsion decreases.
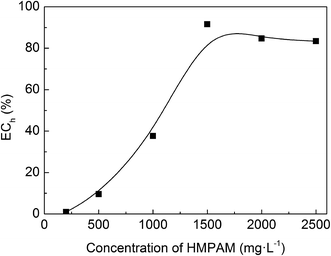
3.6 Relationship between hydrophobic groups and ECh value
The aforementioned experiments prove that the host–guest inclusion method can effectively shield the hydrophobic chain of HMPAM during the emulsification. Emulsion solutions stabilized by HMPAM with various concentrations and the inclusion systems (completely included) were prepared. Then the TSI variation within 2 hours was measured and ECh index was calculated according to the eqn (4). The effect of concentration of HMPAM is shown in Fig. 17. ECh value is relatively low at low HMPAM concentration. The ECh value increases with the increase of HMPAM concentration, and it reaches the maximum value at a concentration of 1500 mg L−1. ECh values of 2000 mg L−1 and 2500 mg L−1 HMPAM are lower than the value of 1500 mg L−1.When the concentrations of HMPAM are smaller than CAC, it is difficult to form the association network in the bulk phase. Few hydrophobic groups can adsorb on the oil–water interface. Thereby the contribution of hydrophobic groups is extremely low. However, when the polymer concentration is above CAC, there are more polymer molecules with hydrophobic groups adsorbing at the oil–water interface, leading to reduced interfacial tension. The strength of network structure also enhances as compared with that of emulsions at lower polymer concentration; this could be explained by the increase of fraction of intermolecular association in the solution with a concentration above CAC. The contribution of hydrophobic groups to the emulsion stability increases. With continuous increase of polymer concentration, high viscosity may result in the uneven emulsion under the same shear rate. In addition, the association strength might be so strong that β-CD cannot destroy the association structure completely, leading to the reduction of ECh index calculated.
4. Conclusions
The host–guest inclusion method of β-CD is confirmed to be a reliable and effective method for studying the influence of hydrophobic groups on the stability of emulsions with HMPAM. The inclusion of β-CD prevents the hydrophobic groups from participating the emulsification process of crude oil. Consequently, network structure composed of associated HMPAM is destroyed, resulting in released polymer molecules with none hydrophobic groups. The structural viscosity is decreased, and the adsorption of hydrophobic group at the oil–water interface is suppressed. TSI analysis shows that the emulsifying capability of HMPAM mainly originates from hydrophobic groups. Furthermore, the ECh value increases with the increase of concentration of the HMPAM. To conclude, the β-CD inclusion method can be employed in studying emulsification and de-emulsification mechanism of emulsions stabilized by amphiphilic polymers. The current study will provide essential insights in the application of amphiphilic polymers in tertiary oil recovery.Acknowledgements
This research was financially supported by the National Natural Science Foundation of China (No. 21273286) and Science Foundation of China University of Petroleum, Beijing (No. 2462015YJRC033).References
- G. J. Hirasaki, C. A. Miller and M. Puerto, SPE J., 2008, 16, 889–907 CrossRef.
- M. Latil, Enhanced oil recovery, Éditions Technip, 1980 Search PubMed.
- W. Pu, C. Yuan, W. Hu, T. Tan, J. Hui, S. Zhao, S. Wang and Y. Tang, RSC Adv., 2016, 6, 50640–50649 RSC.
- D. P. Schmidt, H. Soo and C. J. Radke, Soc. Pet. Eng. J., 2013, 24, 351–360 CrossRef.
- K. Wang, C. Liu and W. Zhou, RSC Adv., 2016, 6, 38437–38446 RSC.
- L. Guo, M. Han, A. Fuseni and A. AlSofi, SPE 179797, SPE EOR Conference at Oil and Gas West Asia, Muscat, Oman, 21–23 March 2016 Search PubMed.
- H. Zhou, K. I. Dismuke, N. L. Lett and G. S. Penny, SPE 151852, SPE International Symposium and Exhibition on Formation Damage Control, Lafayette, Louisiana, USA, 15–17 February 2012 Search PubMed.
- H. Lu, Y. Feng and Z. Huang, J. Appl. Polym. Sci., 2008, 110, 1837–1843 CrossRef CAS.
- K. Xie, X. G. Lu, Q. Li, W. D. Jiang and Q. Yu, SPE J., 2016, 21, 1–9 CrossRef.
- R. S. Seright, T. G. Fan, K. Wavrik, H. Wan, N. Gaillard and C. Favero, SPE Reservoir Eval. Eng., 2011, 14, 726–734 CrossRef CAS.
- E. Akiyama, T. Yamamoto, Y. Yago, H. Hotta, T. Ihara and T. Kitsuki, J. Colloid Interface Sci., 2007, 311, 438–446 CrossRef CAS PubMed.
- R. Liu, W. Pu, L. Wang, Q. Chen, Z. Li, Y. Li and B. Li, RSC Adv., 2015, 5, 69980–69989 RSC.
- E. Akiyama, A. Kashimoto, K. Fukuda, H. Hotta, T. Suzuki and T. Kitsuki, J. Colloid Interface Sci., 2005, 282, 448–457 CrossRef CAS PubMed.
- S. E. Morgan and C. L. Mccormick, Prog. Polym. Sci., 1990, 15, 103–145 CrossRef CAS.
- A. Z. Abidin, T. Puspasari and W. A. Nugroho, Procedia Chem., 2012, 4, 11–16 CrossRef CAS.
- R. Pons, P. Taylor and T. F. Tadros, Colloid Polym. Sci., 1997, 275, 769–776 CAS.
- E. C. Cho, H. J. Lim, J. Shim, J. Kim and I. S. Chang, Colloids Surf., A, 2007, 299, 160–168 CrossRef CAS.
- P. Perrin and F. Lafuma, J. Colloid Interface Sci., 1998, 197, 317–326 CrossRef CAS PubMed.
- Q. Yang, X. Xin, L. Wang, H. Lu, H. Ren, Y. Tan and G. Xu, Colloid Polym. Sci., 2014, 292, 1297–1306 CAS.
- W. Sun, D. Sun, Y. Wei, S. Liu and S. Zhang, J. Colloid Interface Sci., 2007, 311, 228–236 CrossRef CAS PubMed.
- R. J. English, J. H. Laurer, R. J. Spontak and S. A. Khan, Ind. Eng. Chem. Res., 2002, 41, 6425–6435 CrossRef CAS.
- S. Nilsson, K. Thuresson, P. Hansson and B. Lindman, J. Phys. Chem. B, 1998, 102, 7099–7105 CrossRef CAS.
- W. Lau and V. M. Shah, US 5376709, 27-12-1994.
- A. A. Klyamkin, I. N. Topchieva, V. P. Zubov, A. A. Klyamkin, I. N. Topchieva and V. P. Zubov, Colloid Polym. Sci., 1995, 273, 520–523 CAS.
- S. Mahammad, G. W. Roberts and S. A. Khan, Soft Matter, 2007, 3, 1185–1193 RSC.
- J. Wang, Z. Qiu, Y. Wang, L. Li, X. Guo, D. T. Pham, S. F. Lincoln and R. K. Prud'Homme, Beilstein J. Org. Chem., 2016, 12, 50–72 CrossRef CAS PubMed.
- N. Funasaki, S. Ishikawa and S. Neya, J. Phys. Chem. B, 2004, 108, 9593–9598 CrossRef CAS.
- C. Zou, P. Zhao, J. Ge, Y. Lei and P. Luo, Carbohydr. Polym., 2012, 87, 607–613 CrossRef CAS.
- C. Zou, P. Zhao, X. Hu, X. Yan, Y. Zhang, X. Wang, R. Song and P. Luo, Energy Fuel, 2013, 27, 2827–2834 CrossRef CAS.
- W. Pu, Y. Yang, B. Wei and C. Yuan, Ind. Eng. Chem. Res., 2016, 55, 8679–8689 CrossRef CAS.
- B. Wei, Carbohydr. Polym., 2015, 134, 398–405 CrossRef CAS PubMed.
- L. Karlson, K. Thuresson and B. Lindman, Langmuir, 2002, 18, 9028–9034 CrossRef CAS.
- L. Karlson, K. Thuresson and B. Lindman, Carbohydr. Polym., 2002, 50, 219–226 CrossRef CAS.
- A. A. Abdala, A. E. Tonelli and S. A. Khan, Macromolecules, 2003, 36, 7833–7841 CrossRef CAS.
- S. Talwar, J. Harding, K. R. Oleson and S. A. Khan, Langmuir, 2009, 25, 794–802 CrossRef CAS PubMed.
- L. Davarpanah and F. Vahabzadeh, Starch/Staerke, 2012, 64, 898–913 CrossRef CAS.
- B. G. Mathapa and V. N. Paunov, J. Mater. Chem. A, 2013, 1, 10836–10846 CAS.
- W. Kang, B. Xu, Y. Wang, Y. Li, X. Shan, F. An and J. Liu, Colloids Surf., A, 2011, 384, 555–560 CrossRef CAS.
- Y. Ji, W. Kang, L. Hu, R. Yang, L. Meng and H. Fan, J. Polym. Res., 2014, 21, 1–9 CrossRef CAS.
- T. Annable, R. Buscall, R. Ettelaie and D. Whittlestone, J. Rheol., 1993, 37, 695–726 CrossRef CAS.
- D. Graebling, R. Muller and J. F. Palierne, Macromolecules, 1993, 26, 320–329 CrossRef CAS.
- Y. Christanti and L. M. Walker, J. Rheol., 2002, 46, 733–748 CrossRef CAS.
- O. Mengual, G. Meunier, I. Cayre, K. Puech and P. Snabre, Talanta, 1999, 50, 445–456 CrossRef CAS PubMed.
- S. J. Gouldby, P. A. Gunning, D. J. Hibberd and M. M. Robins, Food Polymers, Gels and Colloids, 1991, pp. 244–261 Search PubMed.
- X. Song, P. Shi, M. Duan, S. Fang and Y. Ma, RSC Adv., 2015, 5, 62971–62981 RSC.
- H. Zhang, F. Xin, W. An, A. Hao, X. Wang, X. Zhao, Z. Liu, L. Sun, H. Zhang and F. Xin, Colloids Surf., A, 2010, 363, 78–85 CrossRef CAS.
- K. C. Tam, L. Guo, R. D. Jenkins and D. R. Bassett, Polymer, 1999, 40, 6369–6379 CrossRef CAS.
- Y. Jahani, M. Ghetmiri and M. R. Vaseghi, RSC Adv., 2015, 5, 21620–21628 RSC.
- V. Burckbuchler, A.-L. Kjøniksen, C. Galant, R. Lund, C. Amiel, K. D. Knudsen and B. Nyström, Biomacromolecules, 2006, 7, 1871–1878 CrossRef CAS PubMed.
- D. Sailaja, K. L. Suhasini, S. Kumar and K. S. Gandhi, Langmuir, 2003, 19, 4014–4026 CrossRef CAS.
| This journal is © The Royal Society of Chemistry 2017 |

