 Open Access Article
Ionic conductivity enhancement in Ti-doped Sr11Mo4O23 defective double perovskites
C. A. López a,
J. C. Pedregosaa,
M. T. Fernández-Díazb and
J. A. Alonso
 *c
*c
aINTEQUI, Universidad Nacional de San Luis, CONICET, Área de Química General e Inorgánica “Dr G. F. Puelles”-Facultad de Química, Bioquímica y Farmacia, Chacabuco y Pedernera, 5700, San Luis, Argentina
bInstitut Laue-Langevin, B. P. 156, 38042 Grenoble Cedex 9, France
cInstituto de Ciencia de Materiales de Madrid, CSIC, Cantoblanco, 28049 Madrid, Spain. E-mail: ja.alonso@icmm.csic.es
First published on 14th March 2017
Abstract
A substantially higher ionic motion can be achieved by partially replacing Mo(VI) by Ti(IV) cations in the novel Sr11Mo4−xTixO23−δ (with x = 0.0, 0.5 and 1.0) electrolyte oxides, successfully enhancing the oxygen vacancy level. These phases can be rewritten as Sr1.75□0.25(Sr)(Mo,Ti)O5.75−δ highlighting the relationship with conventional double perovskites. This original structure presents a broken corner sharing connectivity of the octahedral framework, hence leading to a complex and highly defective network. These materials have been prepared in polycrystalline form by thermal treatment up to 1300 °C. The structures were refined from X-ray and neutron powder diffraction data collected at room temperature and at 500 and 800 °C for x = 1. At high temperature this perovskite shows a phase transition to cubic symmetry and also evidences a reversible process of removal/uptake of O-atoms as observed in the undoped phase. AC-conductivity measurements from impedance spectroscopy confirm that Ti-doping increases the ionic mobility by 70%, attaining ionic conductivity values as high as 3.2 × 10⁻³ and 1.8 × 10⁻² S cm−1 at 650 and 800 °C, respectively.
Introduction
Solid oxide fuel cells (SOFC) are promising energy conversion devices that can generate electric power through electrochemical reactions between an oxidant and a fuel gas.1 The environmental and technological advantages of SOFCs are the high efficiency and their fuel flexibility at working temperatures.2 The main drawback of the conventional SOFCs is the high operation temperatures (around 1000 °C), which are mainly required to sufficiently enhance the conductivity of the solid electrolyte. For this reason, extensive research has been devoted in recent years to the study of novel materials and structures aiming to produce devices capable of working as intermediate-temperature solid oxide fuel cells (IT-SOFCs).3,4Currently, yttria-stabilized zirconia (YSZ) is widely used as SOFC electrolyte, although it is most performing at the mentioned high temperatures around 1000 °C and its ionic conductivity decreases quickly with the decrease of the working temperature.5,6 Gd/Sm doped ceria (CGO/CSO) have also been used as electrolyte materials for SOFC but the reduction of Ce4+ to Ce3+ and mixed electronic conductivity at higher temperatures poses problems in these systems.7 Many attempts have been made to improve the ionic conductivity at moderate temperatures in novel ionic conductors. In 1994, Ishihara et al.8 developed Sr- and Mg-doped lanthanum gallate (La1−xSrxGa1−yMgyO3−δ, LSGM) solid electrolyte for low and intermediate-temperature SOFC, which possesses high ionic conductivity and shows stability over a wide range of oxygen partial pressure.9
The previous example illustrates that chemical substitutions or doping with adequate cations in suitably open networks, taking into account the polarizing power and electronic configurations, can promote the oxygen vacancies creation and their mobility through the lattice in several crystalline structures. In parallel with the evaluation of the performance contributed by a particular chemical substitution, it is necessary to undertake a suitable crystallographic characterization, especially at the working temperatures. It is of paramount importance to unveil the details of the crystal structure in relation to the ionic motion, such as order–disorder transitions, lattice defects, cationic and/or anionic deficiencies, tilting of polyhedra, anisotropic thermal displacements, etc. This knowledge is essential to establish relationships between the structures and the macroscopic phenomenology, with the final aim of optimizing the properties of interest.
LSGM-type electrolytes already show that oxides with ABO3 perovskite structure may find applications in the energy conversion field due to their remarkable structural flexibility. The most common distortions are the octahedral tilting, sometimes combined with vacancies at both A sites and O sites. An exceptional example of the flexibility of the perovskite framework are the strongly defective phases with A11B4O23 stoichiometry.10–15 They are superstructures of the double perovskite A1.75□0.25B′B′′O6−δ (where A = B′ and □ = vacancy at the A sublattice); the framework is able to accommodate a rotation of 50% of the small B′′O6 octahedra by ≈45° so that the coordination number of all B′ cations is raised to eight. A few compounds are known with this structure with formulae Sr11Os4O24, Ca11Re4O24, Ba11Os4O24 and Ba11W4O24.10–14
Recently we have prepared and studied a novel Mo-containing related framework with this structure, Sr11Mo4O23; it can be better understood as a four-fold superstructure of a double perovskite with crystallographic composition Sr1.75□0.25SrMoO5.75,16,17 where Sr occupies both A and B sites. This material performs as an oxide-ion conductor, with a moderate ionic conductivity compared with the conventional electrolyte oxides, but it opens up new possibilities on where to search for novel electrolyte materials. It exhibits a reversible process of removal/uptake of O-atom content in the 400–600 °C temperature range. This change is observed by thermogravimetric analysis, by differential scanning calorimetry and thermal expansion measurements. The conductivity is strongly activated after the topotactic removal of 0.54 O atoms per formula unit.16 Also, we completed the characterization of this oxide by describing the thermal evolution of the complex crystal structure at high temperature, studied in situ by neutron powder diffraction (NPD). We found that the strongest increase in the ionic conductivity is due to delocalization oxygen anions around Mo which we have interpreted as a dynamic octahedral tilting in the defective framework.15
In this work we show how a substantially higher ionic motion can be achieved by partially replacing Mo(VI) by Ti(IV) cations in the Sr11Mo4O23 phase, successfully enhancing the oxygen vacancy level. To this aim, the perovskites Sr11Mo4−xTixO23−δ (with x = 0.0, 0.5 and 1.0) were synthesized and a complete analysis of the crystalline structure was performed from XRPD and NPD data at room and high temperature. Thermogravimetric and thermal expansion measurements were also carried out. The substantial increase of the ionic conductivity obtained from impedance spectroscopy is explained on the basis of the crystal structure features observed at high temperature as a result of Ti doping.
Experimental
Sr11Mo4−xTixO23 with x = 0.0, 0.5 and 1.0 were prepared as polycrystalline powders from citrate precursors obtained by soft chemistry procedures. Stoichiometric amounts of analytical grade Sr(NO3)2, (NH4)6Mo7O24·4H2O and TiO2 were mixed in a citric acid solution. The citrate and nitrate solutions were slowly concentrated, leading to organic resins containing a random distribution of the involved metal elements. These resins were first dried at 180 °C and then slowly decomposed at temperatures up to 600 °C. All the organic materials and nitrates were eliminated in a subsequent treatment at 800 °C in air, for 2 h, giving rise to highly reactive precursor materials. The resulting brown powders were then treated in air at 1000 °C for 24 h and fired at 1300 °C in two periods totalling 12 h and the sample was cooled in the furnace to room temperature.The initial identification and characterization of the samples was carried out by XRPD. The experimental patterns were obtained on a Rigaku D-MAX-IIIC diffractometer with KαCu (λ = 1.5418 Å) radiation; the 2θ range was 10° up to 120° with increments of 0.02° and the counting time was 5 s per step. The investigation of the crystallographic structure at room temperature (25 °C), NPD patterns, was carried out at the D2B diffractometer of ILL (Institute Laue Langevin, Grenoble, France) with a wavelength of 1.594 Å. The evolution of the crystallographic structure at high temperature was studied from NPD patterns collected at 500 and 800 °C for x = 1.0. Both XRPD and NPD diffraction patterns were analysed with the Rietveld method using the FullProf program.18,19 The coherent scattering lengths for Sr, Mo, Ti and O were, 7.02, 6.71, −3.44 and 5.805 fm, respectively.
The morphological characterization of the sintered Sr11Mo3TiO23−δ phase was performed by scanning electron microscopy (SEM) using a Hitachi TM-1000 device and the chemical analysis was also carried out by energy dispersive X-ray spectroscopy (EDX).
Thermogravimetric analysis was performed on a Shimadzu TG-50H thermal analyzer apparatus using flowing air at 50 mL min−1 from 25 °C to 1000 °C, at a heating rate of 5 °C min−1. About 18 mg of the sample was used in the experiment.
Measurements of the thermal expansion coefficient (TEC) and electrical conductivity required the use of sintered pellets of 6 mm of diameter, heated in air at 1300 °C for 12 h. The obtained density is around 90–95%. Thermal expansion of the sintered samples was performed in a dilatometer Linseis L75HX1000, between 100 and 1000 °C in air with a heating rate of 5 °C min−1.
The electrical conductivity was measured by two-probe electrochemical impedance spectroscopy (EIS) from 500 to 900 °C in dry air using a Potenciostate Galvanostat AUTOLAB PGSTAT 302 from ECO CHEMIE. The frequency range was 0.1–106 Hz. For these measurements, Pt electrodes were applied on both sides of the sintered pellets by painting with a commercial paste and firing at 1100 °C for 1 h. The impedance spectra was analyzed using the “EIS Spectrum Analyser”.20
Results and discussion
Crystallographic structure at room temperature
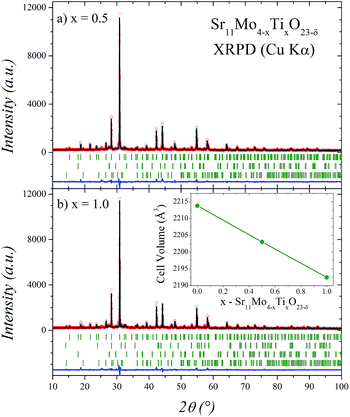
The Sr11Mo4−xTixO23−δ samples were obtained as polycrystalline yellow powders exhibiting a good crystallinity as shown in Fig. 1 for x = 0.5 and 1.0. The structural Rietveld refinement of these double perovskites was initially performed from XRPD data at RT considering the structural models described below. For x = 0.0 the refinement results (not shown) confirm that the structure is coincident and comparable with that previously reported for Sr11Mo4O23.16 The good agreement between the observed and calculated XRPD patterns after the refinement for Ti-doped phases is shown in Fig. 1. The unit-cell volume decreases linearly as a function of Ti doping, as displayed in the inset of Fig. 1(b). This plot evidences an effective Ti incorporation in the perovskite network.The structural characterization was performed from NPD data, using the structural model described for Sr11Mo4O23 in the tetragonal space group I41/a.16 The unit-cell parameters are related to the parameter of the simple cubic perovskite ABO3 (a0) as a = b ≈ 2√2a0; c ≈ 4a0. For this crystallographic model the strontium atoms are distributed at 4 different positions; molybdenum at 2 and oxygen at 6 distinct sites. Three Sr sites (Sr1, Sr2 and Sr3) correspond to A-site cations exhibiting different coordinations ranging from 12 to 8, while one Sr and two Mo sites (Sr4, Mo1 and Mo2) correspond to B-site cations. The Rietveld refinements show that the Ti cations are located at the Mo2 positions.
In both doped cases, some minor impurity phases were identified and included in the refinement: SrMoO4 (SG: I41/a) and Sr(OH)2·H2O (SG: Pmc21).21,22 Additionally, the Sr2TiO4 (SG: I4/mmm)23 impurity was identified and included in x = 1.0 phase. From the scale factors of the main and secondary phases the impurity levels in wt% with x = 0.5 are 1.5(1) and 3.6(2) for SrMoO4 and Sr(OH)2·H2O, respectively. With x = 1.0 the impurity levels are 1.5(1), 2.8(2) and 2.9(2) for SrMoO4, Sr(OH)2·H2O and Sr2TiO4, respectively. Sr(OH)2·H2O impurity arises as a consequence of the superficial hydration process as it was previously observed from thermogravimetric analysis and infrared spectroscopy in undoped phase.16 These values are not negligible, however, the presence of impurities does not significantly affect the stoichiometry of the main phase, but it rather suggests an incomplete reaction.
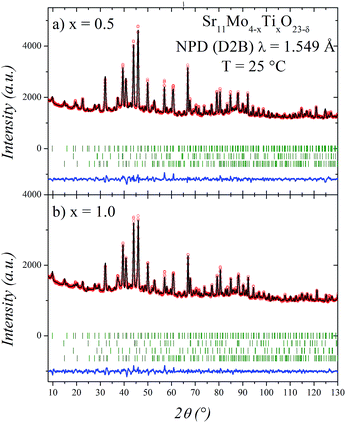
The good agreement between observed and calculated NPD profiles for x = 0.5 and 1.0 is shown in Fig. 2. The irregular background comes from the incoherent scattering of H of the Sr(OH)2·H2O impurity. The structural parameters of these phases at room temperature are listed in Tables 1 and 2. In the refinements, the displacement parameter of Mo/Ti site is restrained to 1.5 Å2 due to the opposite sign in their scattering lengths. The Ti/Mo occupancy ratios were tested and found to be close to those expected for both x values, for this reason, in the final runs they were fixed. Finally, the positions and occupancies of oxygen atoms were also refined, since these are important parameters taking into account the vacancy mechanism of the O2− diffusion of these materials. In this tetragonal structure we found that O4, O5 and O6 are the responsible of the ionic mobility through the crystal structure. This was deduced by the elevated displacement parameters observed at RT,16 but mainly due to the oxygen delocalization observed at high temperature.17 As can be seen in Tables 1 and 2, these oxygen atoms also have high displacement factors for the Ti-doped phases. These atoms coordinate the (Mo2/Ti2) site, and they show a clear decrease in the occupancy factors. After the refinement, the crystallographic formulae are:
| (Sr7)A(Sr4Mo3.5Ti0.5)BO22.4(1); |
| (Sr7)A(Sr4Mo3Ti)BO22.1(1) |
| Atom | x | y | z | Biso (Å2) | Occ | |
|---|---|---|---|---|---|---|
| a Agreement factors: Rp: 2.0%; Rwp: 2.6%; Rexp: 1.0%; χ2: 6.7; RBragg: 10.0%. | ||||||
| Sr1 | 4a | 0 | 0.25 | 0.125 | 4.7(5) | 1 |
| Sr2 | 8e | 0.5 | 0.25 | 0.605(2) | 3.0(4) | 1 |
| Sr3 | 16f | 0.230(1) | 0.975(1) | 0.876(1) | 2.0(2) | 1 |
| Sr4 | 16f | 0.210(1) | 0.244(2) | 0.525(1) | 2.7(2) | 1 |
| Mo1 | 8c | 0 | 0 | 0 | 1.0(1) | 1 |
| Mo2 | 8d | 0 | 0 | 0.5 | 1.5 | 0.75 |
| Ti2 | 8d | 0 | 0 | 0.5 | 1.5 | 0.25 |
| O1 | 16f | 0.856(1) | 0.126(1) | 0.254(1) | 1.3(2) | 1 |
| O2 | 16f | 0.626(1) | 0.140(2) | 0.243(1) | 2.2(4) | 1 |
| O3 | 16f | 0.267(2) | 0.258(2) | 0.367(1) | 3.3(3) | 1 |
| O4 | 16f | 0.834(2) | 0.171(2) | 0.658(1) | 4.0 | 0.90(2) |
| O5 | 16f | 0.866(2) | 0.091(2) | 0.511(1) | 4.0 | 1.00(2) |
| O6 | 16f | 0.317(3) | 0.173(3) | 0.664(2) | 4.0 | 0.75(2) |
| Atom | x | y | z | Biso (Å2) | Occ | |
|---|---|---|---|---|---|---|
| a Agreement factors: Rp: 1.7%; Rwp: 2.3%; Rexp: 1.3%; χ2: 3.4; RBragg: 9.5%. | ||||||
| Sr1 | 4a | 0 | 0.25 | 0.125 | 4.1(4) | 1 |
| Sr2 | 8e | 0.5 | 0.25 | 0.603(1) | 3.1(6) | 1 |
| Sr3 | 16f | 0.234(1) | 0.972(1) | 0.880(1) | 2.0(2) | 1 |
| Sr4 | 16f | 0.220(1) | 0.233(1) | 0.534(1) | 3.0(1) | 1 |
| Mo1 | 8c | 0 | 0 | 0 | 0.9(1) | 1 |
| Mo2 | 8d | 0 | 0 | 0.5 | 1.5 | 0.5 |
| Ti2 | 8d | 0 | 0 | 0.5 | 1.5 | 0.5 |
| O1 | 16f | 0.867(2) | 0.133(1) | 0.249(1) | 1.7(3) | 1 |
| O2 | 16f | 0.635(1) | 0.128(2) | 0.244(2) | 2.5(4) | 1 |
| O3 | 16f | 0.253(3) | 0.260(2) | 0.368(2) | 2.8(4) | 1 |
| O4 | 16f | 0.831(2) | 0.160(2) | 0.662(2) | 4.0 | 0.91(1) |
| O5 | 16f | 0.864(1) | 0.087(2) | 0.516(1) | 4.0 | 0.92(2) |
| O6 | 16f | 0.336(3) | 0.166(3) | 0.685(1) | 4.0 | 0.69(2) |
The stoichiometries are very close to those expected (Sr11Mo3.5Ti0.5O22.5 and Sr11Mo3TiO22) taking into account the oxygen vacancies generated by the (Mo(VI)–Ti(IV)) aliovalent substitutions. The atomic defects can be represented by the Kröger Vink notation as:
Fig. 3 shows a projection of the tetragonal crystal structure observed at RT. Mo1, Mo2 and Sr4 atoms occupy the B-positions of the perovskite subcell in an ordered manner, forming a “rock salt” type cation sublattice. Mo1 and Mo2 ions form conventional MoO6 octahedra, whereas Sr4 is coordinated by eight oxygen atoms, forming SrO8 polyhedra. The incorporation of large SrO8 polyhedra at the B sublattice implies a substantial transformation of the perovskite framework. Whereas Mo1O6 octahedra are only slightly tilted along [110], Mo2O6 octahedra exhibit a strong rotation along the same axis by ≈45°. As a result, SrO8 polyhedra are connected to MoO6 octahedra by both corner and edge sharing, see Fig. 3.
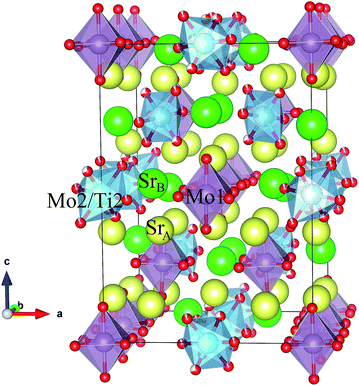 | ||
| Fig. 3 Schematic view of the tetragonal crystal structure (room temperature) showing Mo1 and Mo2/Ti2 octahedra. | ||
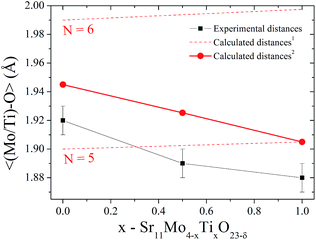
On the other hand, there is a gradual decrease in unit-cell volume as Ti-doping increases (inset of Fig. 1(b)) despite the larger ionic radius of Ti(IV) (0.605 Å) compared to Mo(VI) (0.59 Å).23 This apparent contradiction can be explained if we consider the emergence of new oxygen vacancies induced by the aliovalent substitution. These oxygen vacancies generate a coordination number lower than six, which is expected for octahedral sites. Taking into account this fact, we can calculate the expected coordination numbers for (Mo1−xTix)On sites, as: 5.5, 5.25 and 5 for x = 0, 0.5 and 1, respectively. This reduction in the coordination number is a clear fact that can explain the lower octahedral distances in the Ti doped phases. In order to visualize this effect, we compare the distances for Ti(IV) and Mo(IV) for N = 6 and 5. These ionic radii are: 0.605, 0.51, 0.59 and 0.5 Å for Ti(IV)N=6, Ti(IV)N=5, Mo(VI)N=6 and Mo(VI)N=5, respectively.24 Fig. 4 shows the refined 〈(Mo1−xTix)–O〉 distances in comparison with the same nominal calculated distances. Dashed lines indicate the theoretical distance variation with the Ti content for coordination six and five, also the red full circles indicate the expected distances taking into account the Mo/Ti ratio and their effective coordinations. Here we can observe that the tendency of experimental distances of (Mo2/Ti2)–On are coincident with the calculated values although these values are lower. From this fact we can deduce that the evolution of the crystallographic features with Ti doping is mainly ruled by the oxygen vacancies.
Crystallographic structure at high temperature
The thermal evolution of the crystal structure was evaluated by NPD for the sample with high Ti content (x = 1). For this purpose, the sample was contained in a vanadium can under high vacuum (10−6 Torr) and NPD data were collected in situ in a furnace at 500 and 800 °C. It is worth commenting that the measuring conditions, under high vacuum, are different from that of the sample collected at RT, implying certain oxygen evolution enhanced with temperature. However, the fact that as an electrolyte in SOFCs this material must withstand strongly reducing conditions in the anodic side gives an additional insight on the structural behaviour under the actual working conditions. The NPD patterns were initially refined in the same space group as the undoped phase at RT and high temperature,16,17 however, these refinements were not entirely satisfactory. For this reason we tested a more symmetrical model that was previously reported for Ba11W4O23 in the Fd![[3 with combining macron]](https://www.rsc.org/images/entities/char_0033_0304.gif) m space group.14,15 In this model the unit-cell parameter is connected with that of the simple cubic perovskite ABO3 (a0) as a = b = c ≈ 4a0. In this crystallographic model (Tables 3 and 4) the strontium atoms are distributed at 3 different positions; molybdenum at two and oxygen at four distinct sites. Two Sr atoms (Sr1 and Sr2) correspond to A-site cations, while one Sr and two Mo atoms (Sr3, Mo1 and Mo2) correspond to B-site cations in the conventional perovskite.
m space group.14,15 In this model the unit-cell parameter is connected with that of the simple cubic perovskite ABO3 (a0) as a = b = c ≈ 4a0. In this crystallographic model (Tables 3 and 4) the strontium atoms are distributed at 3 different positions; molybdenum at two and oxygen at four distinct sites. Two Sr atoms (Sr1 and Sr2) correspond to A-site cations, while one Sr and two Mo atoms (Sr3, Mo1 and Mo2) correspond to B-site cations in the conventional perovskite.
![[3 with combining macron]](https://www.rsc.org/images/entities/char_0033_0304.gif) m, Z = 8. Unit-cell parameters: a = 16.4699(2) Å, and V = 4467.6(1) Å3a
m, Z = 8. Unit-cell parameters: a = 16.4699(2) Å, and V = 4467.6(1) Å3a
| Atom | x | y | z | Biso (Å2) | Occ | |
|---|---|---|---|---|---|---|
| a Agreement factors: Rp: 2.4%; Rwp: 3.2%; Rexp: 2.0%; χ2: 2.7; RBragg: 10.8%. | ||||||
| Sr1 | 4a | 0.375 | 0.375 | 0.375 | 3.7(2) | 1 |
| Sr2 | 8e | 0.4000(2) | 0.125 | 0.125 | 3.7(1) | 1 |
| Sr3 | 16f | 0.2264(2) | 0.2264(2) | 0.2264(2) | 4.9(1) | 1 |
| Mo1 | 8c | 0.5 | 0.5 | 0.5 | 2.6(1) | 1 |
| Mo2 | 8c | 0 | 0 | 0 | 3.0 | 0.5 |
| Ti2 | 8d | 0 | 0 | 0 | 3.0 | 0.5 |
| O1 | 16f | 0.4984(2) | 0.4984(2) | 0.6165(2) | 0.968(6) | |
| 46(1) | 46(1) | 11(1) | ||||
| 15(2) | −1.4(9) | −1.4(9) | ||||
| O2 | 16f | 0.0829(4) | 0.0829(4) | −0.0094(8) | 0.404(6) | |
| 57(3) | 57(3) | 71(7) | ||||
| −3(3) | 26(3) | 26(3) | ||||
| O3 | 16f | 0 | −0.0746(6) | 0.0746(6) | 0.234(6) | |
| 69(11) | 43(5) | 43(5) | ||||
| 0.0 | 0.0 | 0.0 | ||||
| O4 | 16f | −0.011(1) | −0.011(1) | 0.1016(7) | 0.220(4) | |
| 108(9) | 108(9) | 5(5) | ||||
| −14(10) | 0.0 | 0.0 | ||||
![[3 with combining macron]](https://www.rsc.org/images/entities/char_0033_0304.gif) m, Z = 8. Unit-cell parameters: a = 16.5551(4) Å, and V = 4537.3(2) Å3a
m, Z = 8. Unit-cell parameters: a = 16.5551(4) Å, and V = 4537.3(2) Å3a
| Atom | x | y | z | Biso (Å2) | Occ | |
|---|---|---|---|---|---|---|
| a Agreement factors Rp: 2.6%; Rwp: 3.4%; Rexp: 2.0%; χ2: 3.0; RBragg: 13.7%. | ||||||
| Sr1 | 4a | 0.375 | 0.375 | 0.375 | 5.7(3) | 1 |
| Sr2 | 8e | 0.4020(2) | 0.125 | 0.125 | 5.2(1) | 1 |
| Sr3 | 16f | 0.2257(2) | 0.2257(2) | 0.2257(2) | 6.0(2) | 1 |
| Mo1 | 8c | 0.5 | 0.5 | 0.5 | 3.6(1) | 1 |
| Mo1 | 8c | 0 | 0 | 0 | 3.0 | 0.5 |
| Ti2 | 8d | 0 | 0 | 0 | 3.0 | 0.5 |
| O1 | 16f | 0.4986(2) | 0.4986(2) | 0.6161(2) | 0.930(2) | |
| 56(1) | 56(1) | 10(1) | ||||
| 13(2) | −2(1) | −2(1) | ||||
| O2 | 16f | 0.0805(3) | 0.0805(3) | −0.0178(6) | 6.0(3) | 0.420(2) |
| 83(5) | 83(5) | 118(10) | ||||
| 34(5) | 43(5) | 43(5) | ||||
| O3 | 16f | 0 | −0.0753(6) | 0.0753(6) | 5.6(4) | 0.242(4) |
| 73(9) | 95(9) | 95(9) | ||||
| 4(9) | 4(9) | 92(9) | ||||
| O4 | 16f | −0.0124(8) | −0.0124(8) | 0.1002(1) | 7.4(5) | 0.226(2) |
| 168(20) | 168(20) | 37(9) | ||||
| 84(27) | −17(12) | −17(12) | ||||
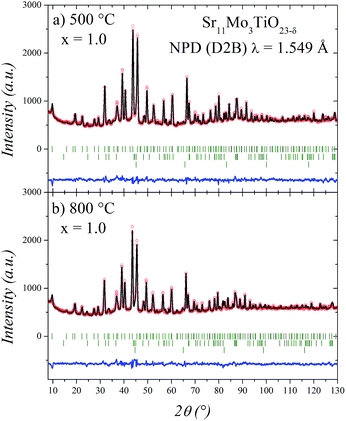
As shown in Fig. 5, the cubic model correctly fits the NPD patterns at 500 and 800 °C. In these refinements we have added Sr2TiO4 as an impurity phase. The other impurities observed at room temperature appear strongly reduced at high temperature conditions. Also, we have observed metallic iron, which probably corresponds to the furnace components.
The structural parameters of these phases at high temperature are listed in Tables 3 and 4. Fig. 6 displays a view of the cubic structure. In spite of the structural change, the arrangement of Mo octahedra and Sr polyhedra is maintained. In the room-temperature structure, defined in the tetragonal system, each Mo is coordinated to three crystallographically different oxygen atoms, but in the high-temperature cubic structure, each Mo is coordinated to one single type of oxygen atom (O1). However, as shown in Tables 3 and 4, there are three different oxygen atoms (O2, O3 and O4) with low occupancy factors coordinated to Mo2. This situation represents a delocalization of the oxygen atoms around Mo2/Ti2 cations. This oxygen delocalization behaviour is also reported in Ba11W4O23.14 This description is analogous to the dynamical octahedral tilting reported previously in Sr11Mo4O23, defined in the I41/a space group, which leads to an increase in the ionic conductivity.17
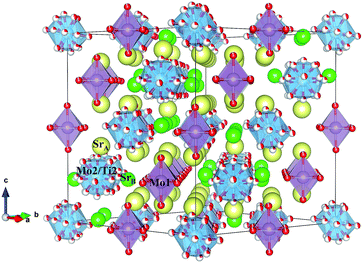 | ||
| Fig. 6 Schematic view of the cubic crystal structure (800 °C) showing Mo1 octahedra and Mo2/Ti2 polyhedra. | ||
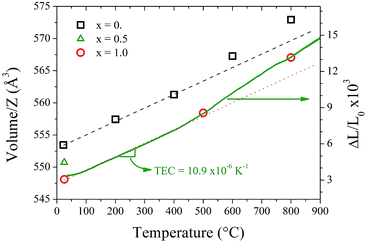
Fig. 7 shows the thermal variation of the unit-cell volume normalized by Z (formula units per unit cell) of Sr11Mo3TiO23−δ in comparison with previous reports of Sr11Mo4O23. Despite having measured only three points, it can be observed the similar behaviour produced by the loss and delocalization of oxygen atoms in the crystallographic structure that was found in Sr11Mo4O23. The undoped phase shows a linear increase (indicated with a black dashed line) up to 400 °C, however above this temperature the values are above the linear extrapolations. The thermal expansion coefficient of Sr11Mo4O23 below 400 °C is 12.4 × 10⁻⁶ K−1.17 For Ti-doped phase, we draw a red dotted line with the same slope as the black dashed line, which allows observing the mentioned increase with the same expansion coefficient. From this behaviour it is possible to deduce that the Ti doping increases the concentration of oxygen vacancies and keeps the oxygen delocalization process observed previously in Sr11Mo4O23.
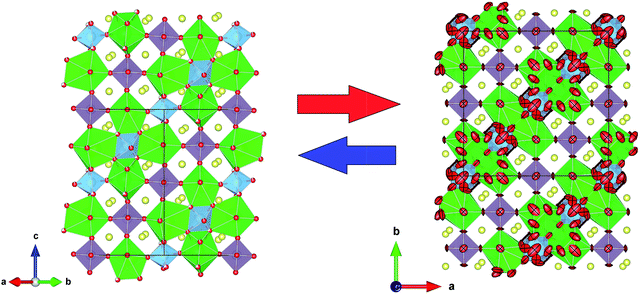
From the refinement results shown in Tables 3 and 4, we can observe that O1 atom, which coordinates the Mo1 atom, is also defective. However, in the undoped phase, there are no vacancies on this site during the reversible process of removal/uptake of oxygen atoms.17 This behaviour can be understood if we consider that Ti doping introduces a chemical pressure in the crystallographic structure that induces several changes in the charge balancing. In the same way, the Mo2 oxygens are delocalised in three different crystallographic positions, where each occupation is lower than one-third. From the sum of the occupancy factors we obtain the following stoichiometric formulas: Sr11Mo3TiO21.9(1) and Sr11Mo3TiO21.8(1) at 500 and 800 °C, respectively. Fig. 8 shows a comparison between the tetragonal (RT) and cubic (800 °C) structures where the oxygen delocalization can be observed.
Morphological characterization
Fig. 9 shows the SEM images corresponding to Sr11Mo3TiO23−δ specimen. The surface of the sample shows the high homogeneity and the absence of porosity, as corresponds to a performing electrolyte. The grain size is micro-metric, with typical size about 10–50 μm. The EDX experiments collected in the indicated dots in Fig. 9(b) show that the element ratio Sr/Mo/Ti is 11/2.8/1.2, these values are close to expected stoichiometry.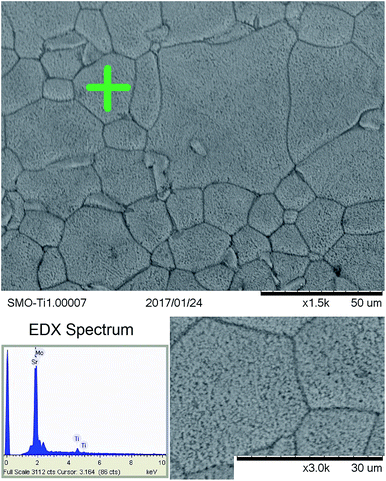 | ||
| Fig. 9 SEM images of Sr11Mo3TiO23−δ. The EDX spectrum was collected in the dot indicated with a green cross. | ||
TGA measurements
Fig. 10 illustrates the TGA curves in air for x = 0.5 and 1.0 Ti-doped samples, previously heated at 1000 °C in order to eliminate the absorbed H2O and CO2. There is a virtually reversible process between 350 and 600 °C of loss (heating run) and uptake (cooling run) of oxygen atoms. From these data, we can estimate the oxygen vacancies generated in the thermal treatment. The oxygen loss corresponds to 0.45% and 0.40% for 0.5 and 1.0, respectively. Taking into account the nominal oxygen content determined at RT, we can estimate the oxygen stoichiometry at high temperature according to the following equilibrium:| Sr11Mo4O23 ↔ Sr11Mo4O22.5 (ref. 16) |
| Sr11Mo3.5Ti0.5O22.5 ↔ Sr11Mo3.5Ti0.5O22 |
| Sr11Mo3TiO22 ↔ Sr11Mo3TiO21.6 |
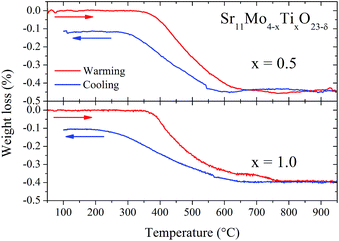 | ||
| Fig. 10 TGA curves of doped samples Sr11Mo4−xTixO23−δ with x = 0.5 (top panel) and 1.0 (bottom panel). Red lines correspond to warming and blue lines to cooling. | ||
The oxygen content at high temperature observed from TGA could be compared with than observed from NPD refinements, but this quantitative comparison is not strictly valid since the environmental conditions are different. However, both techniques consistently support the reversible process of removal/uptake of O atoms, although in qualitative form.
Thermal expansion measurements
Aiming to determine the mechanical compatibility of our material with the other cell components, thermal expansion of dense ceramics were carried out in air atmosphere. The thermal expansion was measured in sintered pellets up to the same final temperature used in the ceramic synthesis. Fig. 7 includes the ΔL/L0 curve in order to compare the thermal expansion with the thermal evolution of unit-cell volume. The measurements show no abrupt changes in the thermal expansion of Sr11Mo4−xTixO23−δ in all the temperature ranges. However, from this technique it is also possible to observe the reversible process of removal/uptake of O atoms. This process is evidenced as a subtle increase in the thermal expansion coefficient above 400 °C. Sr11Mo3TiO23−δ has a TEC of 10.9 × 10⁻⁶ K−1 below 400 °C and above this temperature the TEC increases up to 15.0 × 10⁻⁶ K−1. Although these values are slightly lower than observed in the undoped phase,16 they are in excellent agreement with those determined from NPD from the expansion of the crystallographic structure. The deviation from the linear behaviour is assigned to the reversible process of removal/uptake of oxygen atoms.Conductivity measurements
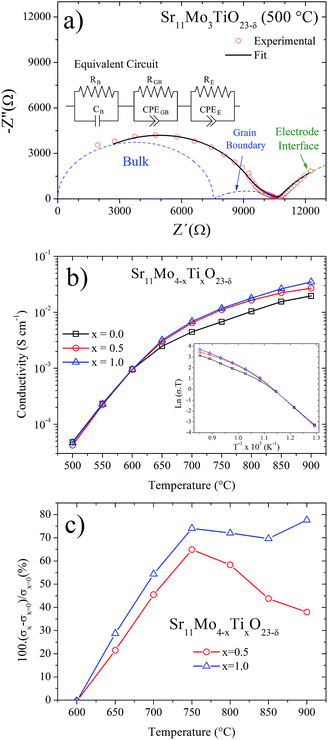
AC impedance technique was used to understand the effect of Ti doping on the ionic mobility mechanism. The measurements were carried out in dry atmosphere for Sr11Mo4−xTixO23−δ, x = 0, 0.5 and 1.0, from 500 to 900 °C with intervals of 50 °C. This technique is suitable for the evaluation of ionic-conductive solid materials,25,26 and it also provides information about electrode processes and it separates the contributions of the bulk (grain interior) and grain boundaries. From the Nyquist plot (−Z′′ vs. Z′), each arc represents a distinct process whose time constant is sufficiently separated from the others over the range of measurement frequencies.Fig. 11(a) shows the representative impedance spectrum for x = 1 sample at 500 °C. The experimental spectra were modelled using an equivalent circuit; from this fit we obtain the three different components shown in Fig. 10(a). The first and second arcs at higher frequencies (blue dashed lines) are attributed to the bulk and grain boundary contributions, respectively. On the other hand, the third contribution is assigned to the electrode interface (sample/Pt paint). At higher temperatures the time constant associated with the sample impedance is much lower than those associated with the electrode interface. Hence, impedance spectra at higher temperatures show only a single arc produced by the electrode interface.
Fig. 11(b) shows the total ionic conductivity (bulk and grain boundary) obtained from each impedance spectra fits. Both Ti-doped samples show a similar shape for the undoped phase, informed in this work and previously reported by us.16 The thermal evolution of the conductivity presents a strong increase, in the 400–600 °C temperature range, which was understood in terms of a reversible process of removal/uptake of O atoms.16 Ti-doped phases also exhibit this removal/uptake process and therefore the conductivity observed below 600 °C is coincident in the three samples. However, above this temperature the conductivities in Ti-doped phases are clearly enhanced in relation to Sr11Mo4O23. We believe this enhancement should only be assigned to ionic conductivity. The contribution of electronic conductivity is discarded because both Ti(IV)(3d0) and Mo(VI)(4d0) do not have valence electrons that could contribute to this conductivity; furthermore, reduced oxidation states for both cations (Ti(III)(3d1) and Mo(V)(4d1)) are barely stabilized in the synthesis or measuring conditions, in air atmosphere. Thus, the incorporation of Ti(IV) replacing Mo(VI) is accommodated in the crystal structure by the creation of oxygen vacancies, which promote a better oxygen diffusion.
To this respect, the Sr11Mo3TiO23−δ electrolyte presents a reasonable ionic conductivity to be used as an electrolyte in SOFC. The obtained values of 3.2 × 10⁻³, 6.9 × 10⁻³ and 1.8 × 10⁻² S cm−1 at 650, 700 and 800 °C, respectively, are lower than those described for LSGM and GDC, but they are close to those reported for YSZ at 800 °C,27,29 as shown in Fig. 12. Furthermore, if we compare our doped phases with other Mo-containing electrolytes as the LAMOX family (La2Mo2O9) we find that the conductivity values are similar.30,31 The effect of Ti doping can be quantified by defining the relative increase in ionic conductivity 100(σx − σx=0)/σx=0 as a function of temperature for x = 0.5 and x = 1.0, as shown in Fig. 11(c). This plot clearly shows that the Ti doping substantially increases the ionic conductivity beyond 600 °C in both samples. At 700 °C we observe an increase of 50%, but at 750–800 °C this increase is around 70%.
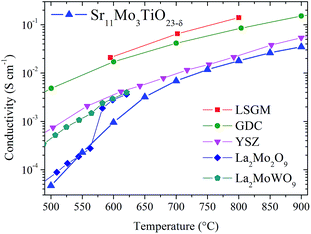 | ||
| Fig. 12 Values of conductivity of Sr11Mo3TiO23−δ in comparison with LSGM, GDC, YSZ, La2Mo2O9 and La2MoWO9.27–31 | ||
These are interesting results that supports that the observed increment in oxygen vacancies, produced by the Ti substitution for Mo, enhances the ionic mobility in the crystallographic lattice. Nevertheless, this increase is not probably the unique responsible for the increase of the conductivity. The Ti affinity by oxygen anions and the structural change also play an important role in the oxygen mobility. Moreover, we can consider the Ti effect in terms of polarizing power; the lower effective charge of Ti(IV) respect to Mo(VI) reduces the polarizing power in the octahedral site with Ti doping. A lower polarizing power would reduce the electrostatic interaction with O2− ions around to Mo/Ti site, resulting in an increased ionic mobility. On the other hand, the phase transition to the cubic system also should be considered. The more symmetrical phase allows the movement of O2− anions through the crystallographic lattice with a lower resistance. This behaviour is well known and studied in other electrolytes such as La2Mo2O9 or stabilized zirconia, where the physical properties are enhanced.31–33 The oxygen conductivity can indeed be affected by multiple factors, as shown from the established structure–property relationship.
Conclusions
The Ti incorporation in Sr11Mo4O23 constitutes an interesting way to enhance the ionic conductivity of this defective perovskite. Ti doping leads to a decrease of the unit-cell parameters that is understood in terms of an increment in the oxygen vacancies content. As observed in Sr11Mo4O23, the Ti-doped compounds present a reversible process of removal/uptake of oxygen atoms in the 350–600 °C temperature range. This behaviour was observed from thermogravimetric analysis and dilatometric measurements. From Rietveld refinements from NPD data at high temperature (500 and 800 °C) we observe a structural transition from tetragonal I41/a to cubic Fd![[3 with combining macron]](https://www.rsc.org/images/entities/char_0033_0304.gif) m. Additionally, a subtle delocalization of oxygen atoms was observed from these patterns; this behaviour was modelled by replacing an oxygen position by three new oxygen atoms with approximately one-third of the full occupation. This crystallographic situation physically represents the ionic mobility of the oxygen anions in the lattice. The total conductivity was measured from impedance spectroscopy, thus confirming that the Ti-doping enhances the ionic mobility. The observed conductivity attains maximum values of 3.2 × 10⁻³, 6.9 × 10⁻³ and 1.8 × 10⁻² S cm−1 for x = 1 at 650 °C, 700 °C and 800 °C, respectively. With respect to the undoped Sr11Mo4O23 perovskite, Ti incorporation drives an increment in the conductivity as high as 70% at 800 °C. These results allow us proposing Sr11Mo4O23-type compounds as novel, promising solid electrolytes, which demonstrate to have sufficient flexibility to incorporate new aliovalent elements. This can be an invaluable strategy in the quest of materials with enhanced ionic conductivity.
m. Additionally, a subtle delocalization of oxygen atoms was observed from these patterns; this behaviour was modelled by replacing an oxygen position by three new oxygen atoms with approximately one-third of the full occupation. This crystallographic situation physically represents the ionic mobility of the oxygen anions in the lattice. The total conductivity was measured from impedance spectroscopy, thus confirming that the Ti-doping enhances the ionic mobility. The observed conductivity attains maximum values of 3.2 × 10⁻³, 6.9 × 10⁻³ and 1.8 × 10⁻² S cm−1 for x = 1 at 650 °C, 700 °C and 800 °C, respectively. With respect to the undoped Sr11Mo4O23 perovskite, Ti incorporation drives an increment in the conductivity as high as 70% at 800 °C. These results allow us proposing Sr11Mo4O23-type compounds as novel, promising solid electrolytes, which demonstrate to have sufficient flexibility to incorporate new aliovalent elements. This can be an invaluable strategy in the quest of materials with enhanced ionic conductivity.
Acknowledgements
CAL acknowledges ANPCyT for financial support (project PICT 2014-3576). JCP thanks CONICET (Projects PIP 11220080101360-Visita Cientíca PVCE(CSIC), PIP 00912/12 and PIP 00820CO); and SECyT-UNSL (PROICO 2-1612). CAL and JCP are members of CONICET. JAA thanks the Spanish MINECO for funding the project MAT2013-41099R. We are grateful to ILL for making the neutron beamtime available.References
- E. P. Murray, T. Tsai and S. A. Barnett, Nature, 1999, 400, 649 CrossRef CAS PubMed.
- S. C. Singhal, Solid State Ionics, 2000, 135, 305 CrossRef CAS.
- J. M. Serra, V. B. Vert, O. Büchler, W. A. Meulenberg and H. P. Buchkremer, Chem. Mater., 2008, 20, 3867 CrossRef CAS.
- A. Sinha, D. N. Miller and J. T. S. Irvine, J. Mater. Chem. A, 2016, 4, 11117 CAS.
- A. B. Stambouli and E. Traversa, Renewable Sustainable Energy Rev., 2002, 6, 433 CrossRef CAS.
- K. Huang and A. Petric, J. Electrochem. Soc., 1996, 143, 1644 CrossRef.
- V. V. Kharton, F. M. B. Marques and A. Atkinson, Solid State Ionics, 2004, 174, 135 CrossRef CAS.
- T. Ishihara, M. Honda and Y. Takita, J. Am. Chem. Soc., 1994, 116, 3801 CrossRef CAS.
- M. Feng and J. B. Goodenough, Eur. J. Solid State Inorg. Chem., 1994, 31, 663 CAS.
- A. Tomaszewska and H. Müller-Buschbaum, Z. Anorg. Allg. Chem., 1993, 619, 1738 CrossRef CAS.
- W. Jeitschko, H. A. Mons, U. C. Rodewald and M. H. Möller, Z. Naturforsch., B: J. Chem. Sci., 1998, 53, 31 CAS.
- K. G. Bramnik, G. Miehe, H. Ehrenberg, H. Fuess, A. M. Abakumov, R. V. Shpanchenko, V. Y. Pomjakushin and A. M. Balagurov, J. Solid State Chem., 2000, 149, 49 CrossRef CAS.
- M. Wakeshima and Y. Hinatsu, Solid State Commun., 2005, 139, 499 CrossRef.
- S.-T. Hong, J. Solid State Chem., 2007, 180, 3039 CrossRef CAS.
- J.-S. Ha, E. Lee, S.-T. Hong and H.-I. Yoo, Solid State Ionics, 2008, 179, 1066 CrossRef CAS.
- C. A. López, J. C. Pedregosa, D. G. Lamas and J. A. Alonso, J. Appl. Crystallogr., 2014, 47, 1395 Search PubMed.
- C. A. López, J. C. Pedregosa, M. T. Fernandéz-Díaz and J. A. Alonso, J. Appl. Crystallogr., 2016, 49, 78 Search PubMed.
- H. M. Rietveld, J. Appl. Crystallogr., 1969, 2, 65 CrossRef CAS.
- J. Rodríguez-Carvajal, Phys. B, 1993, 192, 55 CrossRef.
- A. S. Bondarenko and G. A. Ragoisha, Progress in Chemometrics Research, ed. A. L. Pomerantsev, Nova Science Publishers, New York, 2005, pp. 89–102 Search PubMed.
- E. Guermen, E. Daniels and J. S. King, J. Chem. Phys., 1971, 55, 1093 CrossRef CAS.
- P. Kuske, B. Engelen, J. Henning, H. D. Lutz, H. Fuess and D. Gregson, Z. Kristallogr., 1988, 183, 319 CAS.
- C. Steudtner, E. Morán, M. Á. Alario-Franco and J. L. Martínez, J. Mater. Chem., 1997, 7, 661 RSC.
- R. D. Shannon, Acta Crystallogr., Sect. A: Cryst. Phys., Diffr., Theor. Gen. Crystallogr., 1976, 32, 751 CrossRef.
- G. B. Balaz and R. S. Glass, Solid State Ionics, 1995, 76, 155 CrossRef.
- C. R. Foschini, D. P. F. Souza, P. I. P. Filho and J. A. Varela, J. Eur. Ceram. Soc., 2001, 21, 1143 CrossRef CAS.
- K. Huang, R. S. Tichy and J. B. Goodenough, J. Am. Ceram. Soc., 1998, 81, 2565 CrossRef CAS.
- V. V. Kharton, F. M. B. Marques and A. Atkinson, Solid State Ionics, 2004, 174, 135 CrossRef CAS.
- J. F. Fergus, J. Power Sources, 2006, 162, 30 CrossRef CAS.
- P. Lacorre, F. Goutenoire, O. Bohnke, R. Retoux and Y. Laligant, Nature, 2000, 404, 856 CrossRef CAS PubMed.
- S. Pavlova, Y. Bespalko, V. Sadykov, N. Eremeev, T. Krieger, E. Sadovskaya, A. Ishchenko, A. Bobin, A. Ulihin, N. Uvarov and A. Smirnova, Solid State Ionics, 2016, 288, 103 CrossRef CAS.
- P. M. Abdalaa, D. G. Lamas, M. C. A. Fantini and A. F. Craievich, J. Alloys Compd., 2010, 495, 561 CrossRef.
- L. M. Acuña, R. O. Fuentes, M. C. A. Fantini and D. G. Lamas, J. Phys. Chem. C, 2014, 118, 11445 Search PubMed.
| This journal is © The Royal Society of Chemistry 2017 |

