DOI:
10.1039/C6RA28426D
(Paper)
RSC Adv., 2017,
7, 23182-23196
The novel iminium surfactant p-benzylidene benzyldodecyl iminium chloride as a corrosion inhibitor for plain carbon steel in 1 M HCl: electrochemical and DFT evaluation†
Received
21st December 2016
, Accepted 10th April 2017
First published on 26th April 2017
Abstract
The iminium surfactant p-benzylidene benzyldodecyl iminium chloride was synthesized, characterized and evaluated as a novel corrosion inhibitor for plain carbon steel in 1 M HCl solution at 30, 40, 50 and 60 °C using gravimetric analysis, spectrophotometric analysis of iron ions, potentiodynamic polarization, electrochemical impedance spectroscopy (EIS) and density functional theory (DFT). The evaluated compound acted as an efficient corrosion inhibitor for plain carbon steel in 1 M HCl solution. The inhibition efficiency of the compound increased with an increase in concentration and solution temperature. The iminium surfactant gets adsorbed onto the plain carbon steel surface via mixed types of adsorption with predominantly chemisorption. The adsorption of the inhibitor was found to follow the Langmuir adsorption isotherm. The surface morphology of corroded plain carbon steel in uninhibited and inhibited acid, as investigated by scanning electron microscopy (SEM) and energy dispersive X-ray analysis (EDAX), clearly showed different results. The different quantum chemical parameters were used to correlate the inhibition efficiency of the inhibitor and its molecular structure.
1. Introduction
Plain carbon steel has been designated as one of the most important and widely used constructional materials in a number of industries, which include petroleum, automotive, power and water generation, chemical processing and a variety of other industries. The importance and wide use of plain carbon steel is attributed to its low cost and excellent mechanical properties.1–3 However, plain carbon steel is susceptible to corrosion in different aggressive media particularly mineral acids such as HCl and H2SO4. Among the mineral acids, HCl is widely used in a number of industrial applications such as industrial cleaning, acid pickling, rust and scale removal, oil well acidification in oil recovery and petrochemical processes at temperatures up to 60 °C.4–6 The plain carbon steel used in contact with the HCl solution is likely to suffer extensive corrosion damage if used unprotected. One of the effective and practical means to suppress the corrosion of plain carbon steel in acidic solution is the use of inhibitors, which reduces the aggressiveness of media towards metallic materials.7 The chemical substances with both organic and inorganic origin have been used as inhibitors to protect metals from corrosive environments. Among the corrosion inhibitors, organic compounds containing hetero atoms like N, O and S, and multiple bonds are found to be very efficient in suppressing the corrosion of metals in many environments.8–10 Among the organic corrosion inhibitors, Schiff bases are very popular option due to their low toxicity, eco-friendly nature and ease of synthesis from relatively inexpensive starting-materials.11 The excellent corrosion inhibition performance of Schiff bases is attributed to the presence of different heteroatoms and π electrons along with the imine functional group in their structure.12–15 Surfactants are among the organic compounds, which can be readily synthesized with low cost and have high effectiveness and efficiency for inhibiting corrosion have effectively been used as corrosion inhibitors in acid solutions. The ability of a surfactant to adsorb physically or chemically onto the metal surface is responsible for their corrosion inhibition action.16,17 The inhibition action of the surfactants occur via adsorption of their molecules on the metal surface through polar or ionic group (hydrophilic head) attached to the metal surface and tail or hydrophobic moiety extending away from the interface toward the solution. The protection is provided by formation of an array of hydrophobic tails, leading to change in the electrochemical behavior of the metal.18
In the present study iminium surfactant named as p-benzylidene benzyldodecyl iminium [Fig. 1S(1)†] chloride was synthesized19 and checked as corrosion inhibitor of plain carbon steel in 1 M HCl by using different techniques like weight loss, potentiodynamic polarization, EIS, spectrophotometric analysis of iron ions, surface morphological studies, quantum chemical analysis and thermodynamic and activation parameters.
2. Experimental details
Plain carbon steel strips of size 2 cm × 2 cm × 0.04 cm and having composition C: 0.034%, Mn: 0.176%, P: 0.0103%, Pb: 0.059%, Al: 0.014%, V: 0.034% and Fe balance or C: 0.194%, Mn: 0.176%, P: 0.0103%, Pb: 0.059%, Al: 0.014%, V: 0.034 and Fe balance were used for weight loss measurements. The instrument used for analysis of plain carbon steel composition was Optical Emission Spectrometer. For potentiodynamic and EIS measurements metal strips with exposed surface area of 1 cm2 were used. Metal strips were polished with different grades (320–1200) of emery papers and degreased with acetone; this was followed by rinsing with double distilled and water and finally drying in warm air. 37% HCl (Merck) was used for preparing corrosive solution.
2.1. Determination of critical micelle concentration by conductivity measurement
The critical micelle concentration (CMC) of iminium surfactant at 30 ± 1 °C was determined employing electrical conductivity method. Double distilled water was used to prepare the solutions of all the surfactants. The conductivity measurements were carried out using ELICO CM 183EC-TDS Analyzer having a cell constant of 1.03 cm−1. The conductivity of blank medium was measured first and then, known volumes of the inhibitor solution were added to the blank medium with a pipette and thoroughly mixed, followed by measurement of conductance. Similar process was repeated after every addition. The CMC values for the surfactant were determined as the cross point of the two straight lines by plotting the values of specific electrical conductivity (k) against the iminium surfactant concentration, C.
2.2. Gravimetric analysis
In the gravimetric analysis, the polished and accurately weighed plain carbon steel coupons were immersed in 250 ml beakers containing 200 ml of test solutions maintained at 30–60 °C using a thermo stated water bath. After 6 h of immersion the coupons were taken out from the test solution, the corrosion products were mechanically removed from the surface using a bristle brush, dried and loss in weight was recorded by accurate reweighing. The experiments were performed on triplicate coupons and the average corrosion rate was recorded. The corrosion rate (CR) was determined using the equation:| |
 | (1) |
where, W is weight loss in mg; ρ is the density of specimen in g cm−3; A is the area of specimen in square inch and t is exposure time in h. The inhibition efficiency (% IE) of the inhibitor was evaluated using the following equation:| |
 | (2) |
where, CRo and CRi are the corrosion rates of plain carbon steel in absence and presence of iminium surfactant, respectively.
2.3. Spectrophotometric analysis of iron ions
The results of gravimetric analysis of was also confirmed by estimating total iron ions (Fe2+/Fe3+) entered into the test solution during the course of immersion.20 The analysis was performed spectrophotometrically using Elico-SL-169 UV-visible spectrophotometer. The corrosion rate was calculated using the following relationship:| |
 | (3) |
where, m is the mass of corroded plain carbon steel (calculated from the total iron content determined in the test solution); s is the area of the test specimen in m2; and t is the exposure time in h. The % IE of the inhibitor was calculated using eqn (2).
2.4. Electrochemical measurements
The electrochemical measurements (potentiodynamic polarization and EIS) were carried out on Autolab Potentiostat/Galvanostat, model 128N with inbuilt impedance analyzer FRA2. The experiments were carried out using a three electrode 1L corrosion cell from Autolab with Ag/AgCl electrode (saturated KCl) as reference electrode, Pt wire as counter electrode and plain carbon steel specimens with exposed surface area of 1 cm2 as working electrode. Prior to the commencement of electrochemical experiments the plain carbon steel specimens (working electrodes) were immersed in the test solution and the rest potential was continuously monitored until no noticeable change in rest potential was obtained, this confirmed the establishment of steady state potential. Stabilization period of 1 h was enough to establish steady state open circuit potential (OCP). The potentiodynamic polarization measurements were performed at a scan rate of 0.0005 V s−1 in the potential range of 0.250 V below the corrosion potential to 0.250 V above the corrosion potential. The linear Tafel segments of the anodic and cathodic curves were extrapolated to obtain corrosion potential (Ecorr) and corrosion current densities (Icorr). The obtained Icorr values were used to calculate IE as per the following relationship:| |
 | (4) |
where, Iocorr and Icorr are corrosion current densities in the absence and presence of p-benzylidene benzyldodecyl iminium chloride.
EIS measurements were implemented at open circuit potential within frequency range of 10−2 Hz to 104 Hz with 10 mV perturbation. All the potential were recorded with respect to AgCl. The specimen was allowed to stabilize in the electrolyte for 30 min prior to the experiment. All the electrochemical experiments were done at room temperature (30 ± 1 °C) in aerated and unstirred conditions.
2.5. Quantum chemical calculations
All the quantum chemical calculations were carried out on the p-benzylidenebenzyldodecyl iminium chloride molecule invacuo using Grimme's dispersion corrected DFT/B3LYP-D3 functional (Becke three-parameter hybrid functional combined with Lee–Yang–Parr correlation functional)21 as implemented in Gaussian 09 software.22 The triple zeta Pople's type basis set with diffuse and polarization functions, 6-311++G(d,p), was incorporated in DFT/B3LYP-D3 calculations. The functionals B3LYP have been chosen for the present calculations due to low computational cost and high accuracy. The dispersion correction (D3) was used because the present molecule involves N+ and Cl− ions. The present molecule exists in zwitterion form with a positive and a negative electrical charge on nitrogen and chlorine atom respectively but with a net charge of zero at different locations within a molecule. The molecular geometry of the p-benzylidenebenzyldodecyl iminium chloride was fully optimized in the ground electronic state under tight convergence criterion and subsequently IR frequencies were computed at optimized geometry. The real values of frequency confirm that the computed geometry corresponds to minima on the potential energy surface. The minimum self-consistent field energy, energy Eigen values of frontier molecular orbitals (highest occupied molecular orbital; HOMO and lowest unoccupied molecular orbital; LUMO) HOMO–LUMO energy gap, atomic charges (using natural population analysis) and field independent dipole moment were determined by optimization at B3LYP-D3/6-311++G(d,p) level of theory. The HOMO, LUMO and molecular electrostatic potential (MEP) surfaces were been generated using GaussView 5 program.23 Global chemical reactivity descriptors based on HOMO–LUMO energy Eigen values and donor–acceptor interactions by natural bond orbital (NBO) calculations were also presented at same level of theory. The donor–acceptor interactions were defined by the stabilization energy (E(2)) which measures the strength of the interaction between donor and acceptor molecular orbitals. The E(2), second order stabilization energy is associated with delocalization of the electrons from donor to acceptor NBO. The high value of dipole moment, HOMO energy, electrophilicity descriptor and low value of HOMO–LUMO energy gap show the high corrosion inhibition efficiency of the p-benzylidenebenzyldodecyl iminium chloride. Moreover, the local reactivity indices i.e. condensed Fukui functions (f−: electrophilic attack, f+: nucleophilic attack) for the present surfactant that could be important to understand the interaction with the surface and the corrosion properties have been also computed using the natural population analysis on the system with N, N + 1 and N − 1 electrons.
2.6. Surface morphological studies
Scanning electron microscopy (SEM) and energy dispersive X-ray (EDAX) analysis. The surface morphological study of plain carbon steel coupons immersed in uninhibited and iminium inhibited hydrochloric acid solution was evaluated using, scanning electron microscopy (SEM) (Model: JEOL JSM- 6510LV) with an Energy dispersive X-ray (EDAX) (INCA, Oxford) attachment. To capture the pictographs of the corroded plain carbon steel surface, freshly polished coupons were immersed in uninhibited and inhibited acid solutions for 6 h. After completion of immersion the coupons were taken out, thoroughly washed with double distilled water, dried and then subjected to SEM and EDAX analysis.
3. Results and discussion
3.1. Characterization of synthesized inhibitor
1H-NMR spectrum. The 1H-NMR spectrum of the synthesized iminium surfactant is shown in the Fig. 1. The pertinent details are as follows:
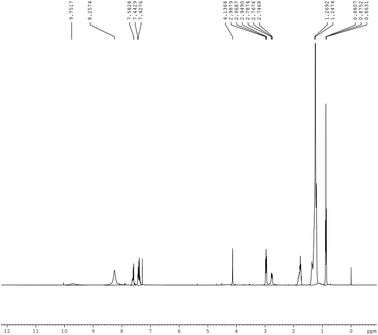 |
| | Fig. 1 1H-NMR spectrum of iminium surfactant. | |
Iminium compound. 1H-NMR: δ = 0.8631–0.8807 ppm (t, 3H, –CH3), δ = 1.2474–1.2692 ppm (m, 18H, –(CH2)9CH3), δ = 1.7360 ppm (m, 2H, –CH2CH2N+), δ = 2.5468 ppm (s, 2H, –CH2Ph), δ = 2.9490–2.9879 (t, 2H, –CH2CH2N+), δ = 4.1368 (s, 3H, –OCH3), δ = 7.4276 (5H, –CH2–Ph), δ = 7.6828 (4H, Ph-OCH3), δ = 8.2674 (s, 1H, +N![[double bond, length as m-dash]](https://www.rsc.org/images/entities/char_e001.gif) CH–Ph).
CH–Ph).The spectrum of the surfactant is consistent with the reported spectrum of the compound.19
3.2. Determination of critical micelle concentration of surfactant in 1 M HCl
The electrical conductivity method was employed to determine the critical micelle concentration (CMC) of the iminium surfactant. Measured values of specific electrical conductivity, k were plotted as a function of surfactant concentration, C (Fig. 2). The cross point of the two straight lines was taken as CMC value. The CMC of the iminium surfactant was determined to be 4.8 × 10⁻³ M.
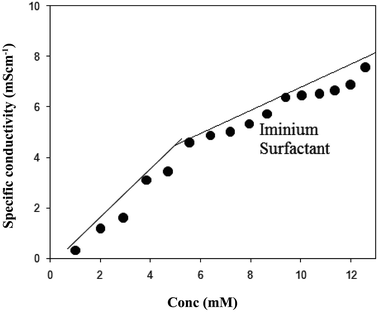 |
| | Fig. 2 The plot of specific conductivity vs. concentration of the synthesized iminium surfactant at 30 °C. | |
3.3. Gravimetric analysis
The corrosion of plain carbon steel in 1 M HCl in the absence and presence of different concentrations of iminium surfactant was studied at temperature 30, 40, 50 and 60 °C. The calculated value of corrosion rates and % IE at different concentrations and temperatures obtained after 6 h of immersion have been shown in Table 1. From the table it is clearly seen that the corrosion rates are reduced in presence of iminium surfactant as compared to the free acid solution and depends upon both surfactant concentration and temperature. The IE increases with increasing surfactant concentration and temperature showing a maximum increase in IE of 98.48% at surfactant concentration of 5 × 10⁻⁴ M (well below the CMC of the compound) at 60 °C. The inhibition of plain carbon steel corrosion in the presence of iminium surfactant could be attributed to the adsorption of the compound onto plain carbon steel surface, which blocks the metal and thus do not permit the corrosion process to take place. The increased IE with increasing surfactant concentration indicates that more surfactant molecules are adsorbed on the steel surface leading to the formation of a protective film over the surface of metal.24 It is an established fact that in polar organic compounds the polar units present in the compound act as reaction center and facilitate the adsorption process forming a charge transfer complex bond between their polar atoms and the metal. The extent of adsorption and hence the effectiveness of the compound is largely determined on the basis of the size, orientation, shape and electronic charge on the molecule.25–27 The inhibition efficiency of an organic corrosion inhibitors mostly depends on their chemical structure, size and carbon chain length of the organic molecule; aromaticity in compound and/or conjugated bonding; nature, type and number of bonding atoms or groups in the molecule (either π or σ); charges generated on the metal surface; ability for a layer to be single or multiple to form compact or cross-linked, capability to form a complex with the atom of metal within the metal lattice; type of the electrolyte solution like adequate solubility in the environment.28 Considering the present case, based on the presence of π-electrons of phenyl group, double bond and electronegative nitrogen atom in its structure (Fig. 3), the cationic Schiff base based surfactant may reasonably justify its high inhibition efficiency and use as an effective corrosion inhibitor. The π-electrons in the molecule not only can locate the unoccupied orbital of the transition metal, but also can accept the electrons of the d orbital of the transition metal to form feedback metal–inhibitor bond. Considering the effect of temperature on inhibition behavior of the surfactant, the IE also increases with increase in temperature. This effect shows the capability of surfactant to inhibit corrosion of steel at low and relatively high temperatures. The surfactant is chemically adsorbed onto the plain carbon steel surface, which is more favored at higher temperature due to lesser kinetic energy barrier.
Table 1 Calculated values of corrosion rate (mpy), inhibition efficiency (% IE) and degree of surface coverage for plain carbon steel in 1 M HCl in absence and presence of the iminium surfactant at 30–60 °C from weight loss measurements
| Surfactant |
Corrosion rate (mpy) |
Inhibition efficiency (% IE) |
Degree of surface coverage |
| 30 °C |
40 °C |
50 °C |
60 °C |
30 °C |
40 °C |
50 °C |
60 °C |
30 °C |
40 °C |
50 °C |
60 °C |
| Blank |
|
|
|
|
|
|
|
|
|
|
|
|
![[thin space (1/6-em)]](https://www.rsc.org/images/entities/char_2009.gif) |
| Iminium surfactant |
| 5 × 10⁻⁶ |
269.09 |
291.33 |
511.92 |
706.11 |
57.92 |
68.95 |
82.22 |
88.92 |
0.58 |
0.69 |
0.82 |
0.89 |
| 1 × 10⁻⁵ |
214.41 |
185.87 |
255.17 |
319.45 |
66.47 |
80.19 |
91.14 |
94.99 |
0.67 |
0.80 |
0.91 |
0.95 |
| 5 × 10⁻⁵ |
112.48 |
105.27 |
161.50 |
277.86 |
82.41 |
88.78 |
94.39 |
95.64 |
0.82 |
0.89 |
0.94 |
0.96 |
| 1 × 10⁻⁴ |
58.77 |
50.91 |
114.30 |
133.19 |
90.81 |
94.57 |
96.03 |
97.91 |
0.91 |
0.95 |
0.96 |
0.98 |
| 5 × 10⁻⁴ |
37.54 |
39.44 |
90.44 |
96.87 |
94.13 |
95.80 |
96.85 |
98.48 |
0.94 |
0.96 |
0.97 |
0.99 |
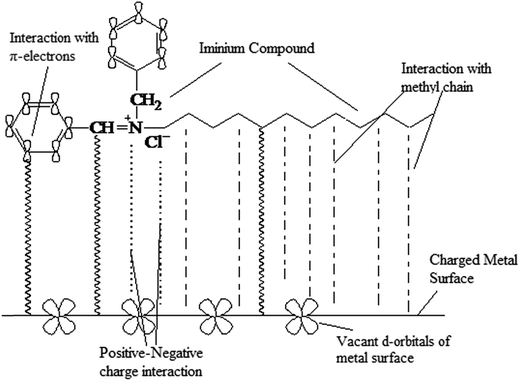 |
| | Fig. 3 The adsorption sites of iminium surfactant which adhere with metal surface. | |
3.4. Solution analysis of iron ion
The corrosion rate of plain carbon steel in 1 M HCl in absence and presence of iminium surfactant at 30–60 °C was also measured by determining the total iron ions entered into the test solution during the course of immersion. The values of corrosion rate and % IE are shown in Table 2. The % IE as obtained by solvent analysis is consistent with % IE determined by weight loss measurements.
Table 2 Calculated values of corrosion rate (g m−2 h−1) and inhibition efficiency (% IE) for plain carbon steel in 1 M HCl in absence and presence of iminium surfactant at 30–60 °C from solvent analysis of iron ions into test solution
| Surfactant concentration (M) |
Corrosion rate (g m−2 h−1) |
Inhibition efficiency (% IE) |
| 30 °C |
40 °C |
50 °C |
60 °C |
30 °C |
40 °C |
50 °C |
60 °C |
| Blank |
1.76 |
2.10 |
3.77 |
7.23 |
— |
— |
— |
— |
![[thin space (1/6-em)]](https://www.rsc.org/images/entities/char_2009.gif) |
| Iminium surfactant |
| 5 × 10⁻⁶ |
0.80 |
0.76 |
0.78 |
1.26 |
54.55 |
63.81 |
79.31 |
82.57 |
| 1 × 10⁻⁵ |
0.68 |
0.53 |
0.51 |
0.84 |
61.36 |
74.76 |
86.47 |
88.38 |
| 5 × 10⁻⁵ |
0.36 |
0.34 |
0.41 |
0.59 |
79.55 |
83.81 |
89.12 |
91.84 |
| 1 × 10⁻⁴ |
0.27 |
0.22 |
0.33 |
0.54 |
84.66 |
89.52 |
91.25 |
92.53 |
| 5 × 10⁻⁴ |
0.15 |
0.14 |
0.24 |
0.36 |
91.48 |
93.33 |
93.63 |
95.06 |
3.5. Adsorption isotherm
The inhibitive action of an organic inhibitor compound in an aggressive acid media is considered due to its adsorption at the metal/solution interface. The adsorption of an organic adsorbate at a metal/solution interface can be regarded as a substitution adsorption process between the organic molecules in the aqueous solution, Org(sol) and the water molecules on the metal surface H2O(ads).| | |
Org(sol) + xH2O(ads) ↔ Org(ads) + xH2O(sol)
| (5) |
where x is the size ratio representing the number of water molecules replaced by an organic adsorbate molecule.
For organic compounds that have ability to absorb strongly on metal surface, the surface coverage (θ) can be evaluated from IE. The relationship between IE and the bulk concentration of the inhibitor at constant temperature, which is known as isotherm, gives an insight into the adsorption process. The values of degree of surface coverage (θ) for various inhibitor concentrations in 1 M HCl was calculated from gravimetric analysis. Attempts were made to fit θ values to different adsorption isotherms, Langmuir, Temkin, Freundlich and Frumkin isotherm but best fitted results were obtained from Langmuir adsorption isotherm. The characteristic plot of Langmuir adsorption isotherm was made, which is C/θ vs. C given by equation:
| |
 | (6) |
where,
θ is the degree of surface coverage,
K is the adsorptive equilibrium constant of the adsorption process and
C is the inhibitor concentration in mol L
−1. The plots of
C/
θ versus C for plain carbon steel corrosion in 1 M HCl at temperatures 30–60 °C are shown in
Fig. 4. The obtained plots are linear with correlation coefficient 1 or higher than 0.999. The intercept permits the calculation of equilibrium constant
K. The high values of
K, which denotes interaction between inhibitor and steel surface, indicate that the inhibitor molecules are strongly adsorbed on the steel surface and in turn provide better inhibition efficiency to the inhibitor. Values of
K also seem to increase with increasing temperature favoring chemical adsorption onto the plain carbon steel. The values of regression coefficient
R2 are given in
Fig. 4 and
K are summed up in
Table 3.
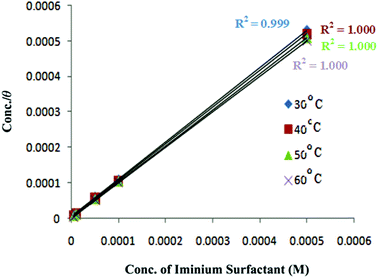 |
| | Fig. 4 Langmuir adsorption isotherm plots for iminium surfactant adsorbed on plain carbon steel surface in 1 M HCl at different temperatures. | |
Table 3 Value of K at different temperatures from Langmuir adsorption isotherm of iminium surfactant
| Surfactant (M) K × 103 |
Temperature |
| 30 °C |
40 °C |
50 °C |
60° |
| Iminium surfactant |
| 5 × 10⁻⁶ |
276.19 |
445.16 |
911.11 |
1618.18 |
| 1 × 10⁻⁵ |
203.03 |
400.00 |
1011.11 |
1900.00 |
| 5 × 10⁻⁵ |
91.11 |
161.82 |
313.33 |
480.00 |
| 1 × 10⁻⁴ |
101.11 |
190.00 |
240.00 |
490.00 |
| 5 × 10⁻⁴ |
31.33 |
48.00 |
64.67 |
198.00 |
3.6. Effect of temperature
In the present study the corrosion of plain carbon steel in 1 M HCl was investigated in the temperature range of 30–60 °C in absence and presence of surfactant inhibitor. A graph is plotted for logarithm of corrosion rate (log![[thin space (1/6-em)]](https://www.rsc.org/images/entities/char_2009.gif) CR) vs. reciprocal of absolute temperature (1/T), which is shown in Fig. 5. By applying Arrhenius equation linear plot was obtained:
CR) vs. reciprocal of absolute temperature (1/T), which is shown in Fig. 5. By applying Arrhenius equation linear plot was obtained:| |
 | (7) |
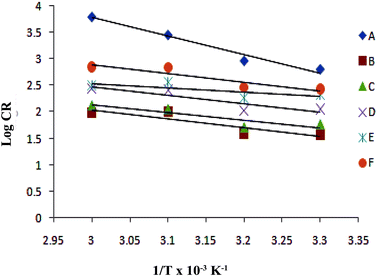 |
| | Fig. 5 Adsorption isotherm plot of log![[thin space (1/6-em)]](https://www.rsc.org/images/entities/char_2009.gif) CR vs. 1/T for the adsorption of iminium surfactant, (A) blank, (B) 5 × 10⁻⁴ M, (C) 1 × 10⁻⁴ M, (D) 5 × 10⁻⁵ M, (E) 1 × 10⁻⁵ M, (F) 5 × 10⁻⁶ M. CR vs. 1/T for the adsorption of iminium surfactant, (A) blank, (B) 5 × 10⁻⁴ M, (C) 1 × 10⁻⁴ M, (D) 5 × 10⁻⁵ M, (E) 1 × 10⁻⁵ M, (F) 5 × 10⁻⁶ M. | |
The values of Ea obtained from the graph are given in Table 4. A change in the value of Ea in presence of additives may be due to the modification of the mechanism of the corrosion process in presence of adsorbed inhibitor molecules. In general, higher values of Ea in presence of additives support physical adsorption mechanism whereas an unchanged or lower value of Ea for inhibited systems compared to the blank is indicative of chemisorption mechanism. In the present investigation the values of Ea in presence of inhibitor is lower compared to the blank and hence supports chemical adsorption mechanism. The enthalpy of adsorption, ΔH and entropy of adsorption, ΔS for corrosion of plain carbon steel in 1 M HCl in presence of inhibitor was obtained by equation:
| |
 | (8) |
Table 4 Calculated values of kinetic/thermodynamic parameters for plain carbon steel in 1 M HCl in the absence and presence of iminium surfactant from weight loss measurement
| Surfactant (iminium) |
Ea (kJ mol−1) |
ΔH (kJ mol−1) |
ΔS (kJ mol−1 K−1) |
Q (kJ mol−1) |
−ΔGads (kJ mol−1) |
| 30 °C |
40 °C |
50 °C |
60 °C |
| Blank |
64.39 |
64.14 |
18.20 |
— |
— |
— |
— |
— |
| 5 × 10⁻⁶ |
26.94 |
25.66 |
−115.45 |
62.06 |
41.68 |
44.29 |
47.64 |
50.70 |
| 1 × 10⁻⁵ |
11.15 |
11.11 |
−165.70 |
63.57 |
40.90 |
44.02 |
47.92 |
51.15 |
| 5 × 10⁻⁵ |
25.12 |
22.98 |
−139.94 |
46.91 |
38.89 |
41.66 |
44.77 |
47.34 |
| 1 × 10⁻⁴ |
23.18 |
24.89 |
−131.37 |
40.98 |
39.15 |
42.08 |
44.05 |
47.39 |
| 5 × 10⁻⁴ |
26.40 |
30.44 |
−116.24 |
48.44 |
36.20 |
38.50 |
40.53 |
44.89 |
The plot of log(CR/T) vs. 1/T for blank and the inhibitor is shown in Fig. 6. The slope  and intercept
  of the linear plot, gives the values of ΔH and ΔS, respectively and are presented in Table 4. From the given data it is observed that values of ΔH decreases in presence of inhibited solution compared to uninhibited solution. This confirms the process of chemisorptions. The shift of value of ΔS from positive to negative for uninhibited to inhibited medium indicates increase in the system order. Another plot of
  versus 1/T for the inhibitor was made (Fig. 7). From the slope
  of the plot, heat of adsorption, Qads was obtained and the values are given in Table 4. The calculated values of Qads are positive predicting the adsorption of inhibitor on plain carbon steel to be endothermic. The free energy of adsorption, (ΔGads) at different temperatures was calculated from the following equation:
| |
ΔGads = −RT![[thin space (1/6-em)]](https://www.rsc.org/images/entities/char_2009.gif) ln(55.5 K) ln(55.5 K)
| (9) |
where,
R is the universal gas constant,
T the absolute temperature and the value of 55.5 is the concentration of water in mol L
−1 in the solution. The values of Δ
Gads (
Table 4) are negative indicating spontaneous adsorption of inhibitor on the plain carbon steel surface. Furthermore, the negative values of Δ
Gads also show the strong interaction of the inhibitor molecules on to the plain carbon steel surface. It is an established fact that values of Δ
Gads around −20 kJ mol
−1 or less indicates physisorption whereas the values of Δ
Gads around −40 kJ mol
−1 or more are considered as chemisorptions.
29,30 In the present study the values of Δ
Gads are in the range of −36.20 to −51.15 kJ mol
−1 which are specifically suggests chemisorptions adsorption of given compound over the plain carbon steel.
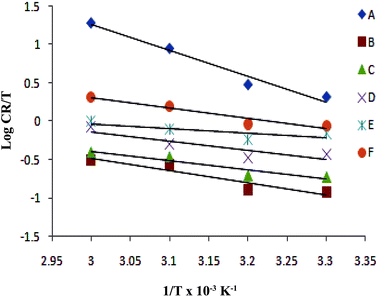 |
| | Fig. 6 Adsorption isotherm plot of log![[thin space (1/6-em)]](https://www.rsc.org/images/entities/char_2009.gif) CR/T vs. 1/T for the adsorption of iminium surfactant, (A) blank, (B) 5 × 10⁻⁴ M, (C) 1 × 10⁻⁴ M, (D) 5 × 10⁻⁵ M, (E) 1 × 10⁻⁵ M, (F) 5 × 10⁻⁶ M. CR/T vs. 1/T for the adsorption of iminium surfactant, (A) blank, (B) 5 × 10⁻⁴ M, (C) 1 × 10⁻⁴ M, (D) 5 × 10⁻⁵ M, (E) 1 × 10⁻⁵ M, (F) 5 × 10⁻⁶ M. | |
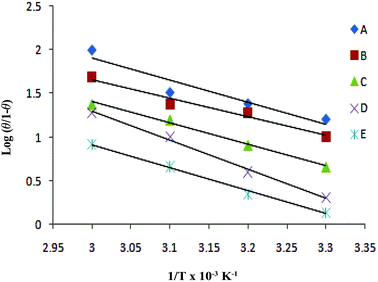 |
| | Fig. 7 Adsorption isotherm plot of log(θ/1 − θ) vs. 1/T for the adsorption of iminium surfactant, (A) 5 × 10⁻⁴ M, (B) 1 × 10⁻⁴ M, (C) 5 × 10⁻⁵ M, (D) 1 × 10⁻⁵ M, (E) 5 × 10⁻⁶ M. | |
3.7. Potentiodynamic polarization measurements
The potentiodynamic polarization curves for the corrosion of plain carbon steel in 1 M HCl in absence and presence of different concentration of iminium surfactant at 30 °C are presented in Fig. 8. It is clearly evident from the curves that values of current density decreases with the presence of iminium compound indicating that the compound was adsorbed on the steel surface and caused corrosion inhibition. Potentiodynamic parameter as deduced from these curves, e.g., corrosion potential (Ecorr), corrosion current density (icorr), the anodic Tafel slope (βa), the cathodic Tafel slope (βc), polarization resistance, corrosion rate and % IE are shown in Table 5. The value of icorr continuously decreases in presence of increasing inhibitor concentration. The maximum IE of 90.63% was observed at a concentration of 5 × 10⁻⁴ M of iminium compound indicating that a higher coverage of surfactant on steel surface is obtained in the solution with highest concentration of inhibitor. There is a change in the values of both βa and βc indicating that the corrosion of steel in presence of inhibitor is under both anodic and cathodic control. So inhibitor acts as mixed type. The magnitude of the shift in Ecorr in presence of iminium compound (less than 85 mV) suggests that it acts as a mixed inhibitor and affects both anodic and cathodic reaction.31 In presence of iminium surfactant the values of Ecorr shifts to more negative values indicating that compound should predominantly control the cathodic reaction. The iminium surfactant addition to the acid solution resulted in an increase in Rp values indicating effective inhibition by the compound. The increased Rp values with increase in inhibitor concentration suggested that further polarization of the plain carbon steel was resisted by adsorption of inhibitor molecules, which were present in the acid solution, at metal/solution interface. The values of IE as obtained by potentiodynamic polarization studies are highly consistent with the results of the weight loss measurements and solvent analysis of iron ions.
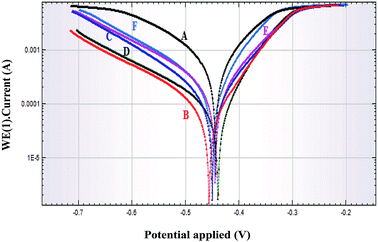 |
| | Fig. 8 Potentiodynamic polarization curves for plain carbon steel in 1 M HCl in absence and presence of different concentrations of iminium surfactant, (A) blank, (B) 5 × 10⁻⁴ M, (C) 1 × 10⁻⁴ M, (D) 5 × 10⁻⁵ M, (E) 1 × 10⁻⁵ M, (F) 5 × 10⁻⁶ M. | |
Table 5 Potentiodynamic polarization parameters for corrosion of plain carbon steel in 1 M HCl in the absence and presence of different concentration of iminium surfactant 30 °C
| Surfactant concentration (M) |
Ecorr (mV) |
Icorr (μA cm−2) |
βa (mV dec−1) |
βc (mV dec−1) |
Polarisation resistance (Ω) |
CR (mmpy) |
% IE |
| Blank |
−444.42 |
922.52 |
219.04 |
143.70 |
40.85 |
10.72 |
|
![[thin space (1/6-em)]](https://www.rsc.org/images/entities/char_2009.gif) |
| Iminium surfactant |
| 5 × 10⁻⁴ |
−451.79 |
86.45 |
84.95 |
169.93 |
292.10 |
1.01 |
90.63 |
| 1 × 10⁻⁴ |
−450.44 |
127.94 |
94.92 |
144.98 |
194.72 |
1.49 |
86.13 |
| 5 × 10⁻⁵ |
−439.74 |
149.30 |
241.20 |
88.24 |
187.93 |
1.74 |
83.82 |
| 1 × 10⁻⁵ |
−444.94 |
272.65 |
204.47 |
117.25 |
118.70 |
3.17 |
70.45 |
| 5 × 10⁻⁶ |
−450.65 |
408.03 |
235.42 |
110.57 |
80.08 |
4.74 |
55.77 |
3.8. Electrochemical impedance spectroscopy (EIS) measurements
The mode of inhibition and the kinetics of electrochemical processes taking place at the plain carbon steel/HCl interface modified by the presence of iminium compound was further evaluated by EIS technique. Fig. 9 and 10 show Bode and Nyquist plots, respectively for plain carbon steel corrosion in 1 M HCl solution in absence and presence of various concentrations of the iminium surfactant at 30 °C. The impedance diagrams obtained in absence and with varying concentrations of iminium compound are almost identical implying that addition of inhibitor does not cause any significant change in the mechanism of the corrosion reaction but inhibits the corrosion by increasing the surface coverage by the adsorbed inhibitor film.33 Nyquist plots exhibit a single depressed capacitive semicircle for both absence and presence of inhibitor containing solutions. There is an increase in the diameter of capacitive loop in presence of inhibitor, the diameter of the capacitive loop increases with increasing inhibitor concentration. This suggest that inhibition of steel corrosion is achieved by controlling charge transfer process.10,32 The depressed semicircles under real axis may be accounted to roughness and inhomogeneity of electrode surface.33 A simple Randel's equivalent circuit, comprising a parallel connection between the charge transfer resistance (Rct) and the double layer capacitance (Cdl) and these impedance elements connected in series with the electrolyte resistance Rs, as depicted in Fig. 11 was used to model EIS results. The EIS parameters as derived from Nyquist plots are listed in Table 6. It is evident from Table 6 that in presence of varying concentrations of iminium compound in the HCl solution the values of Rct increases and Cdl decreases compared to the uninhibited HCl solution. A higher value of Rct in presence of inhibitor is indicative of a slower corroding system, which is due to the reduction in the active surface required for corrosion reaction. The increase in the values of Rct with increasing inhibitor concentrations is indicative of the considerable metal surface coverage without altering the mechanism of corrosion. The decrease in Cdl in presence of inhibitor is attributed to the decrease in local dielectric constant and/or an increase in the thickness of the electrical double layer. This is suggestive of the fact that inhibitor molecules acted by adsorption at the metal/solution interface by replacing the water molecules with inhibitor molecules leading to the formation of a protective film on the electrode surface.34
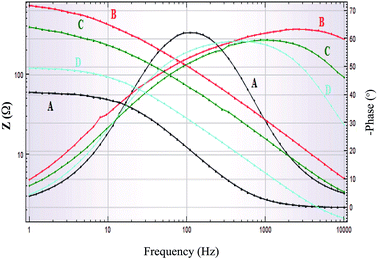 |
| | Fig. 9 Bode plot of plain carbon steel immersed in 1 M HCl in absence and presence of different concentrations of iminium surfactant, (A) blank, (B) 5 × 10⁻⁴ M, (C) 5 × 10⁻⁵ M, (D) 5 × 10⁻⁶ M. | |
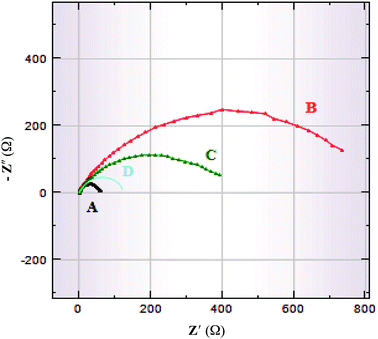 |
| | Fig. 10 Nyquist plots for plain carbon steel immersed in 1 M HCl in absence and presence of different concentrations of iminium surfactant, (A) blank, (B) 5 × 10⁻⁴ M, (C) 5 × 10⁻⁵ M, (D) 5 × 10⁻⁶ M. | |
 |
| | Fig. 11 Randel's equivalent circuit. | |
Table 6 EIS parameters for corrosion of plain carbon steel in 1 M HCl in the absence and presence of different concentrations of iminium surfactant at 30 °C
| Surfactant concentration (M) |
Rs (Ω) |
Rct (Ω) |
Cdl (μF) |
% IE |
| Blank |
2.44 |
56.18 |
149.22 |
— |
![[thin space (1/6-em)]](https://www.rsc.org/images/entities/char_2009.gif) |
| Iminium surfactant |
| 5 × 10⁻⁴ |
3.55 |
841.99 |
25.69 |
93.33 |
| 5 × 10⁻⁵ |
5.42 |
428.93 |
37.58 |
86.90 |
| 5 × 10⁻⁶ |
2.38 |
126.22 |
78.36 |
55.49 |
Bode plots (Fig. 10), which showed the existence of one time constant (single maximum) at any concentration of inhibitor is combination of Bode impedance plot where impedance vs. frequency is plotted and Bode phase plot where phase angle vs. frequency is plotted. In impedance vs. frequency plots an increase in inhibitor concentrations resulted in an increase in the values of absolute impedance at low frequencies. This is suggestive of the increase in the protective properties of inhibitor with increasing concentration. The phase angle at high frequencies provides a general idea about the inhibitory action of the inhibitors. If the value of phase angle is more negative, than the electrochemical behavior will be more capacitive. In Bode phase angle vs. frequency plots an increase in the inhibitor concentration in acid solution results in more negative values of phase angle at high frequencies. This is indicative of superior inhibitive behavior of inhibitor at high concentration.
The IE from EIS data was evaluated by comparing the values of Rct in absence and presence of inhibitor. The IE value increases with increasing inhibitor concentrations. Furthermore, the values of inhibition efficiency obtained from weight loss measurements, solvent analysis of metal ion, potentiodynamic polarization measurements and EIS measurements are in good agreement. The Nyquist and Bode plots are not perfect semi-circle, may be due to presence of impurities which causes little deviations in the curves.
3.9. Quantum chemical calculations
Quantum chemical methods (ab initio and DFT) provide insight into the mechanism of inhibition action of corrosion compounds and therefore these methods are widely used in corrosion studies.35–42 In the present study, various molecular quantities like molecular energy, atomic charges, dipole moment, frontier molecular orbital energies, donor–acceptor stabilization energy, global and local reactivity descriptors are used to characterize the inhibition property of p-benzylidenebenzyldodecyl iminium chloride in vacuo. The calculations of these parameters require accurate ground state molecular structure which was obtained by geometry optimization technique and shown in Fig. 12 with numbering scheme. The optimized structure shows the linear chain of dodecyl fragment in the present molecule. Some important theoretical molecular quantities are depicted in Table 7. The donor–acceptor stabilization energy values are presented in Table 8.
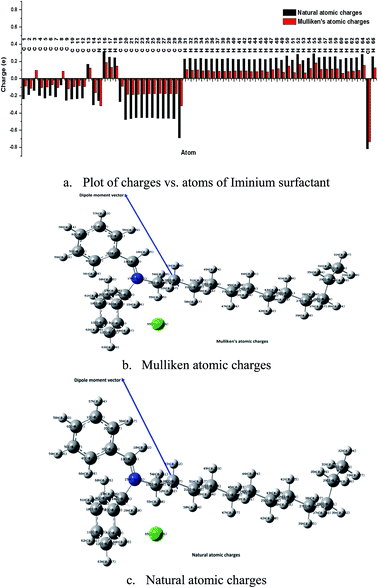 |
| | Fig. 12 Mulliken and natural atomic charges on each atom of iminium surfactant. | |
Table 7 Some important theoretical parameters for p-benzylidenebenzyldodecyl iminium chloride compound in vacuoa
| Parameters |
B3LYP-D3/6-311++G(d,p) |
| Notations and abbreviation used: HOMO – Highest Occupied Molecular Orbital, LUMO – Lowest Unoccupied Molecular Orbital, TNC – total negative charge on atoms in molecule ΔN – fraction of electron transferred from inhibiter to iron metal surface. |
| SCF minimum energy (kcal mol−1) |
−959452.0575 |
![[thin space (1/6-em)]](https://www.rsc.org/images/entities/char_2009.gif) |
| Field independent dipole moment (Debye) |
| μx |
−9.1288 |
| μy |
9.1335 |
| μz |
−5.8344 |
| μ |
14.1703 |
![[thin space (1/6-em)]](https://www.rsc.org/images/entities/char_2009.gif) |
| Frontier molecular orbital energies (eV) |
| ELUMO+1 |
−1.78 |
| ELUMO |
−3.46 |
| EHOMO |
−5.13 |
| EHOMO−1 |
−5.18 |
| GAP = ELUMO − EHOMO |
1.67 |
![[thin space (1/6-em)]](https://www.rsc.org/images/entities/char_2009.gif) |
| Global reactivity descriptors |
| Ionization potential, I (eV) |
5.13 |
| Electron affinity, A (eV) |
3.46 |
| Electronegativity, χ |
4.30 |
| Chemical potential, μ |
−4.30 |
| Electrophilicity, ω |
11.05 |
| Hardness, η |
0.84 |
| Softness, S |
0.60 |
| ΔN |
1.61 |
| TNC |
−11.573 |
Table 8 Important donor–accepter interactions based on second order perturbation theory analysis of Fock matrix in NBO basisa
| Donor NBO |
Acceptor NBO |
E(2) (kcal mol−1) |
| NBO – Natural Bond Orbital, E(2) – second order stabilization energy associated with delocalization of the electrons from donor to acceptor NBO. |
| πC1–C6 |
π*C2–C3 |
24.1 |
| πC1–C6 |
π*C4–C5 |
18.4 |
| πC2–C3 |
π*C1–C6 |
17.5 |
| πC2–C3 |
π*C4–C5 |
18.9 |
| πC2–C3 |
π*C13–N15 |
27.3 |
| πC4–C5 |
π*C1–C6 |
20.6 |
| πC4–C5 |
π*C2–C3 |
18.7 |
| πC7–C12 |
π*C8–C9 |
21.9 |
| πC7–C12 |
π*C10–C11 |
21.8 |
| πC8–C9 |
π*C7–C12 |
18.5 |
| πC8–C9 |
π*C10–C11 |
19.5 |
| πC10–C11 |
π*C7–C12 |
18.6 |
| πC10–C11 |
π*C8–C9 |
20.8 |
| LP(1)Cl56 |
σ*C14–H16 |
2.6 |
| LP(3)Cl56 |
σ*C7–H64 |
1.4 |
| LP(3)Cl56 |
σ*C20–H52 |
2.0 |
| LP(4)Cl56 |
σ*C14–H16 |
21.8 |
The atomic charge (local electron density) in the molecule is a useful quantity that helps in explaining electrostatic interactions and molecular polarity. This also play important role in defining local reactivity descriptors like Fukui's indices.42 The natural atomic charges were computed for the present inhibitor and the results are shown in Fig. 12. Natural charges distributed over the atoms in molecule as well as comparison of the natural charges of atoms in neutral, cation and anion molecular geometry are presented in Fig. 1S and 2S (ESI†). As it is well known that more negative charge on the atom in molecule is more reactive toward the interaction with the metal surface.43,44 The highest negative charge corresponds to the preferable site of nucleophilic attack while highest positive charge as preferable site of electrophilic attack. All the hydrogen atoms in molecule are appeared with the positive charge. The natural charges on carbon atoms are predicted with negative values except C13 as this is connected to electronegative atom N15 through double bond. The strong negative charges are predicted for C20–C28, C58, C59 (in carbon chain) and Cl56 atoms. Therefore, these atoms of the carbon chain and Cl56 atoms possess the strong negative atomic charges indicating that the molecule under study can efficiently inhibit the corrosion of the metal surface through adsorption on its surface via their active sites (C and Cl).44 The more negative charge of atoms in molecule indicates the more easily the unoccupied orbital of the atoms of metal surface will receive the electrons from the investigated molecule. The atoms N and O in heterocycle azole derivatives, phenazine and its derivatives are appeared as electron rich centers and therefore have the strongest ability of bonding to the metal surface.45 Thus, the atomic charge in molecule is one of the key properties associated with corrosion inhibition.46 The total negative charge (TNC) of the present molecule is predicted with large value −11.6 e which shows the presence of potential adsorption centers, Table 7. This value is found large as compared with other inhibitors reported elsewhere.47–51 The TNC value of present molecule is found less as compared to non-ionic surfactants of the TRITON-X series.52 In order to define inhibition performance of the present compound the dipole moment, frontier molecular orbital energies, HOMO–LUMO gap and various chemical reactivity descriptors have been also computed (Table 7) and discussed. The HOMO and LUMO of the chemical compound are very essential in defining its reactivity. The HOMO–LUMO spatial diagram with HOMO–LUMO gap is shown in Fig. 13 which explains charge transfer within molecule. The HOMO is delocalized over N, Cl atoms and aromatic rings while LUMO is spread totally over the one of aromatic ring and partially on another ring, N and few C atoms. Fig. 13 shows the total charge transfer from Cl atom upon HOMO to LUMO excitation. The high and low energy Eigen values of HOMO and LUMO show the tendency to donate electrons and ability to accept electrons respectively. The high value of dipole moment (14.2 Debye), HOMO energy and low value of HOMO–LUMO gap (1.67 eV) of the present compound may be responsible for high corrosion inhibition efficiency.53 The high dipole moment and low HOMO–LUMO gap show the better corrosion inhibition efficiency of the investigated molecule in vacuo than others neutral species like phenanthroline derivatives,54 phenazine and its derivatives,50 heterocyclic azole derivatives, thiosemicarbazides,55 imidazol,30 benzimidazol, and pyridine derivatives,51 ethoxylated-[2-(2-{2-[2-(2-benzenesulfonylamino-ethylamino)-ethylamino]-ethylamino}-ethylamino)-ethyl]-4-alkylbenzenesulfonamide,52 antipyrine Schiff bases and non-ionic surfactants of the TRITON-X series.56 The high dipole moment value defines the high polarity of the compound which assists electrostatic interaction between inhibitor and metal and also contributes to their better adsorption on metal surface. The equations used for the calculations of global reactivity descriptors like ionization potential, electron affinity, electronegativity, chemical potential, electrophilicity, chemical hardness and softness based on HOMO–LUMO energy Eigen values at DFT(B3LYP-D3)/6-311++G(d,p) method can be found in various literatures.37,38,40–44 A hard molecule has large HOMO–LUMO gap and therefore less reactive while soft molecules are more reactive because of low HOMO–LUMO gap. The global electrophilicity quantity defines the ability of the chemical species to accept electrons. In the present case the compound with high value of electrophilicity index (11.05) is the strong electrophile as comparative to some other inhibitors reported in literatures50,51,56 and hence has the high inhibition efficiency.
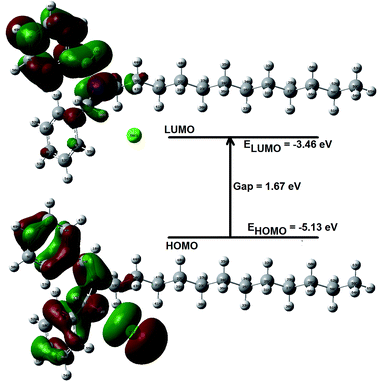 |
| | Fig. 13 HOMO–LUMO spatial diagram for iminium compound. | |
The inhibition efficiency has been also defined by the parameter ΔN which is the fraction of electron transferred from inhibiter molecule to the iron metal surface. The high value of ΔN (1.61) is found for the p-benzylidenebenzyldodecyl iminium chloride that shows its high inhibition efficiency.41,57 As per Lukovits's study, if the ΔN value is less than of 3.6, the inhibition efficiency increased with increasing electron donating ability of inhibitor at the metal surface.
The local reactivity indices like condensed Fukui's functions (f− and f+) have been computed using natural atomic charges to study the electrophilic and nucleophilic regions in the investigated molecule. These descriptors define the atom wise reactive sites in inhibitor likely to interact with metal surface in the form of electrophilic and nucleophilic reactions. The condensed Fukui functions for the inhibitor are depicted in Table 9. The maximum value of f+ index relates to reactivity pertaining to a nucleophilic attack whereas the maximum of f− index indicates the favored site for adsorption of electrophilic agents. In the present molecule, the atoms C13 and N15 have the large f− index while the atom Cl has the maximum f+ index value. Therefore the atoms C13/N15 and Cl in inhibitor are the preferred sites for an electrophilic and nucleophilic attack respectively.
Table 9 Condensed Fukui function values for p-benzylidenebenzyldodecyl iminium chloride compound in vacuo
| Atom |
f− |
f+ |
Atom |
f− |
f+ |
Atom |
f− |
f+ |
| C1 |
0.026 |
0.151 |
C23 |
1 × 10⁻⁴ |
0.296 |
H45 |
0.003 |
−0.144 |
| C2 |
0.071 |
0.131 |
C24 |
0 |
0.296 |
H46 |
0.004 |
−0.142 |
| C3 |
0.096 |
0.036 |
C25 |
−2 × 10⁻⁴ |
0.295 |
H47 |
0.003 |
−0.149 |
| C4 |
0.104 |
0.137 |
C26 |
−7 × 10⁻⁵ |
0.296 |
H48 |
−3 × 10⁻⁴ |
−0.151 |
| C5 |
0.007 |
0.149 |
C27 |
−1 × 10⁻⁴ |
0.296 |
H49 |
−0.004 |
−0.15 |
| C6 |
0.169 |
0.139 |
C28 |
−1 × 10⁻⁵ |
0.298 |
H50 |
5 × 10⁻⁴ |
−0.15 |
| C7 |
0.004 |
0.208 |
H29 |
−3 × 10⁻⁵ |
−0.148 |
H51 |
0.002 |
−0.151 |
| C8 |
0.007 |
0.032 |
H30 |
1 × 10⁻⁴ |
−0.148 |
H52 |
1 × 10⁻⁴ |
−0.152 |
| C9 |
5 × 10⁻⁴ |
0.148 |
H31 |
2 × 10⁻⁴ |
−0.148 |
H53 |
−5 × 10⁻⁴ |
−0.15 |
| C10 |
0.001 |
0.191 |
H32 |
−1 × 10⁻⁵ |
−0.148 |
H54 |
−4 × 10⁻⁵ |
−0.149 |
| C11 |
0.001 |
0.152 |
H33 |
2 × 10⁻⁴ |
−0.148 |
H55 |
9 × 10⁻⁴ |
−0.152 |
| C12 |
9 × 10⁻⁴ |
0.174 |
H34 |
−1 × 10⁻⁴ |
−0.148 |
Cl56 |
0.042 |
1.286 |
| C13 |
0.251 |
−0.131 |
H35 |
−2 × 10⁻⁴ |
−0.148 |
H57 |
0.004 |
−0.148 |
| C14 |
−0.031 |
0.229 |
H36 |
3 × 10⁻⁴ |
−0.148 |
C58 |
−2 × 10⁻⁵ |
0.292 |
| N15 |
0.203 |
0.017 |
H37 |
−5 × 10⁻⁴ |
−0.148 |
C59 |
−1 × 10⁻⁴ |
0.457 |
| H16 |
0.01 |
−0.161 |
H38 |
3 × 10⁻⁴ |
−0.147 |
H60 |
0 |
−0.148 |
| H17 |
0.003 |
−0.146 |
H39 |
−5 × 10⁻⁴ |
−0.147 |
H61 |
8 × 10⁻⁵ |
−0.147 |
| H18 |
−0.002 |
−0.13 |
H40 |
−5 × 10⁻⁴ |
−0.149 |
H62 |
0 |
−0.147 |
| C19 |
0.008 |
0.159 |
H41 |
6 × 10⁻⁴ |
−0.15 |
H63 |
6 × 10⁻⁵ |
−0.152 |
| C20 |
0.008 |
0.317 |
H42 |
−7 × 10⁻⁴ |
−0.15 |
H64 |
9 × 10⁻⁵ |
−0.152 |
| C21 |
0.002 |
0.303 |
H43 |
0.003 |
−0.156 |
H65 |
−2 × 10⁻⁴ |
−0.156 |
| C22 |
0.003 |
0.297 |
H44 |
8 × 10⁻⁴ |
−0.15 |
H66 |
9 × 10⁻⁵ |
−0.147 |
The molecular electrostatic potential (MEP) has been used to define the electrophilic and nucleophilic sites of the molecule which helps in understanding the corrosion process. The MEP plot for the p-benzylidenebenzyldodecyl iminium chloride is shown in Fig. 14 with colour range from deepest red to deepest blue. The electrostatic potential values are in the order of red < yellow < green < blue. The regions with deepest blue colour are the preferred sites to interact with electron rich site of other chemical species like metal while the deepest red part (e.g., Cl56) is the preferred sites that may interact with electron deficient site of metal surface.
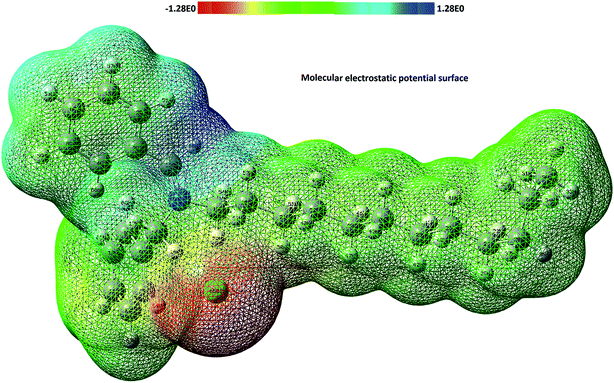 |
| | Fig. 14 Molecular electrostatic potential map for iminium compound. | |
The donor–acceptor interaction energy, E(2), between some important donor and acceptor orbitals, determined by second order perturbation theory, are tabulated in Table 8. The delocalization of electrons takes place when the donor (filled) orbital interacts with acceptor (virtual) one. In Table 8, first 13 values of E(2) corresponding to the respective donor–acceptor explains the delocalization of electrons in two aromatic rings of the compound. The high value of stabilization energy, E(2), between orbitals n(LPCl56)–σ*C14–H16, measure the strength of electrostatic interaction between them.
3.10. Surface morphological studies
The SEM images (Fig. 15A–C) were obtained to establish the fact that corrosion inhibition of plain carbon steel in 1 M HCl is due to the formation of a protective film by the adsorbed iminium surfactant molecules. The SEM photomicrographs of the polished plain carbon steel surface and steel surface exposed to 1 M HCl in absence and presence of iminium surfactant has been depicted in Fig. 15(A–C). Fig. 15(A) shows the surface morphology of the sample before immersion in 1 M HCl solution. Except the marks of the scratches, which had arisen during polishing with emery papers the surface shows a characteristic freshly polished plain carbon steel surface which is free from any noticeable defects such as cracks and pits. Fig. 15(B) shows the SEM photomicrograph of plain carbon steel surface obtained after immersion in uninhibited 1 M HCl. A damaged and heterogeneous surface is observed as a result of severe corrosion of plain carbon steel by the aggressive acid solution. Fig. 15(C) shows the photomicrograph of the plain carbon steel surface immersed for the same period of time in 1 M HCl containing 5 × 10⁻⁴ M of iminium surfactant. The surface heterogeneity is considerably decreased in the presence of inhibitor; the surface clearly resembles with the surface of the plain carbon steel before immersion in acid solution. The decrease in the surface heterogeneity would have been caused by the deposition of the surfactant molecules on the plain carbon steel surface which protected the steel surface from the attack of corrosive medium. The scratches formed during the polishing were adequately covered well by the surfactant molecules.
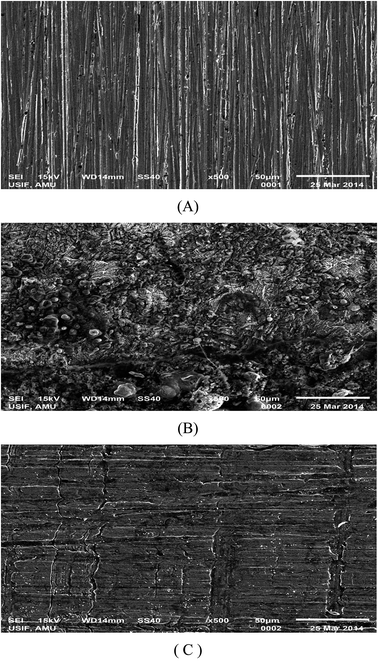 |
| | Fig. 15 SEM photomicrographs of plain carbon steel samples, (A) polished, (B) dipped in 1 M HCl, (C) dipped in iminium surfactant inhibited 1 M HCl. | |
The EDAX spectrum (Fig. 16(A–C)) of the polished plain carbon steel surface and steel surface exposed to 1 M HCl in absence and presence of iminium surfactant were obtained and the results are shown in Fig. 16(A–C). The EDAX spectrum was recorded in order to determine the content of iron and other elements on the steel surface in absence and presence of inhibitor. Fig. 16(A) represents the EDAX profile of polished plain carbon steel, which revealed that the surface was free from any corrosion product in the absence of immersion in acid solution. In case of plain carbon steel exposed to 1 M HCl the iron content on the surface was appreciably reduced in comparison to the polished plain carbon steel due to formation of corrosion products; presence of chlorine and oxygen was also revealed on the surface [Fig. 16(B)]. Fig. 16(C) shows EDAX profile of plain carbon steel specimen immersed for the same period of time in 1 M HCl containing 5 × 10⁻⁴ M of iminium surfactant. The spectrum showed higher concentration of iron presumably due to lowering in the extent of corrosion in presence of inhibitor but did not show the presence of chlorine. This indicates that iminium compound adequately protected the plain carbon steel from corrosive attack of HCl.
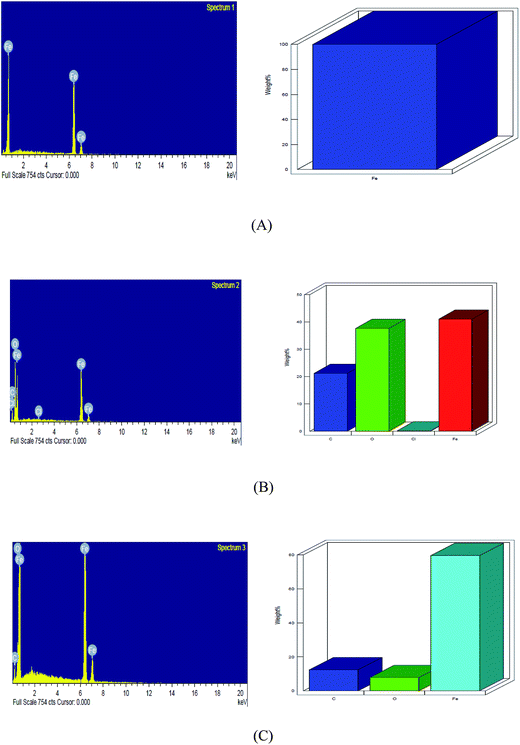 |
| | Fig. 16 EDAX spectrum and plot of weight% vs. element of (A) polished (B) dipped in 1 M HCl, (C) dipped in iminium surfactant inhibited 1 M HCl. | |
4. Conclusions
The results of gravimetric analysis, solution analysis of Fe ions, electrochemical measurements and quantum chemical calculation revealed that the studied surfactant acts as good inhibitor for plain carbon steel corrosion in 1 M HCl. Corrosion inhibition effect was found to increases with increasing inhibitor concentration and solution temperature. The adsorption of surfactant on plain carbon steel in HCl is spontaneous, essentially chemisorption and follows Langmuir adsorption isotherm. The value of activation energy, Ea in presence of inhibitor is lower compared to the blank and hence supports chemical adsorption mechanism. Iminium surfactant is mixed-type inhibitor according to results obtained from potentiodynamic polarization measurements as it controls both cathodic and anodic processes. EIS results confirmed the formation of a protective layer on the plain carbon steel surface in presence of iminium surfactant. The SEM photomicrographs and results of EDAX studies further confirm the protection of plain carbon steel in 1 M HCl solution by the iminium surfactant. The data obtained from computational investigation were correlated with the experimentally obtained inhibition efficiency. Experimental results are in conformity with the theoretical results.
Acknowledgements
The author Dr Sheerin Masroor thankfully acknowledges the financial assistance from UGC, New Delhi in the form of Maulana Azad National Fellowship.
References
- Z. Tao, S. Zhang, W. Li and B. Hou, Corros. Sci., 2009, 51, 2588 CrossRef CAS.
- P. Kalaiselvi, S. Chellammal, S. Palanichamy and G. Subramanian, Mater. Chem. Phys., 2010, 120, 643 CrossRef CAS.
- M. A. Hegazy, A. Y. El-Etre, M. El-Shafaie and K. M. Berry, J. Mol. Liq., 2016, 214, 347 CrossRef CAS.
- M. Finsgar and J. Jackson, Corros. Sci., 2014, 86, 17 CrossRef CAS.
- A. Popova, E. Sokolova, S. Raicheva and M. Christov, Corros. Sci., 2003, 45, 33 CrossRef.
- D. Daoud, T. Douadi, S. Issaadi and S. Chafaa, Corros. Sci., 2014, 79, 50 CrossRef CAS.
- H. Kaesche, Corrosion of Metal: Physiochemical Principles and Current Problems, Springer, 2003 Search PubMed.
- L. Herrage, B. Hammouti, S. Elkadiri, A. Aounti, C. Jama, H. Vezin and F. Bentiss, Corros. Sci., 2010, 52, 3042 CrossRef.
- K. R. Ansari, M. A. Quraishi and A. Singh, Corros. Sci., 2014, 79, 5 CrossRef CAS.
- H. Hamani, T. Douadi, M. El-Naoimi, S. Issaadi, D. Daoud and S. Chafaa, Corros. Sci., 2014, 88, 234 CrossRef CAS.
- D. Sinha, A. K. Tiwari, S. Singh, G. Shukla, P. Mishra, H. Chandra and A. K. Mishra, Eur. J. Med. Chem., 2008, 43, 160 CrossRef CAS PubMed.
- A. Aytac, U. Ozmen and M. Kabasakaloǧlu, Mater. Chem. Phys., 2005, 89, 176 CrossRef CAS.
- J. Aljourani, K. Raeissi and M. A. Golozar, Corros. Sci., 2009, 51, 1836 CrossRef CAS.
- M. Palomar-Pardavé, M. Romero-Romo, H. Herrera- Hernández, M. A. Abreu-Quijano, N. V. Likhanova, J. Uruchurtu and J. M. Juárez-García, Corros. Sci., 2012, 54, 231 CrossRef.
- Y. Zhou, S. Xu, L. Guo, S. Zhang, H. Lu, Y. Gong and F. Gao, Corros. Sci., 2015, 5, 14804 CAS.
- M. L. Free, Corros. Sci., 2002, 44, 2865 CrossRef CAS.
- M. A. Amin, M. A. Ahmed, H. A. Arid, F. Kandemirli, M. Saracoglu, T. Arslan and M. A. Basaran, Corros. Sci., 2011, 53, 1895 CrossRef CAS.
- X.-H. Li, S.-D. Deng, H. Fu and G.-N. Mu, J. Appl. Electrochem., 2009, 39, 1125 CrossRef CAS.
- I. Aiad, M. M. El-Sukkary, A. El-Deeb, M. Y. El-Awady and S. M. Shaban, J. Surfactants Deterg., 2012, 15, 359 CrossRef CAS.
- M. Mobin and N. Tanveer, J. Coat. Technol. Res., 2012, 9, 27 CrossRef CAS.
- C. Lee, W. Yang and R. G. Parr, Phys. Rev. B: Condens. Matter Mater. Phys., 1988, 37, 785 CrossRef CAS.
- M. J. Frisch, et al., Gaussian 09, Revision D.01, Gaussian Inc, Wallingford CT, 2009 Search PubMed.
- R. Dennington, T. Keith and J. Millam, GaussView, Ver. 5, Semichem Inc., Shawnee Mission KS, 2009 Search PubMed.
- V. S. Rao and L. K. Singhal, J. Mater. Sci., 2009, 44, 2327 CrossRef.
- M. Ehteshamzadeh, T. Shahrabi and M. G. Hosseini, Appl. Surf. Sci., 2006, 252, 2949 CrossRef.
- K. C. Emregul and O. Atakol, Mater. Chem. Phys., 2003, 82, 188 CrossRef CAS.
- S. L. Li, Y. G. Wang, S. H. Chen, R. Yu, S. B. Lei, H. Y. Ma and D. X. Liu, Corros. Sci., 1999, 41, 1769 CrossRef CAS.
- B. Sanyal, Prog. Org. Coat., 1981, 9, 165 CrossRef CAS.
- W. H. Li, Q. He, S. T. Zhang, C. L. Pei and B. R. Hou, J. Appl. Electrochem., 2008, 38, 289 CrossRef CAS.
- R. Solmaz, G. Kardas, B. Yazici and M. Erbil, Colloids Surf., A, 2008, 312, 7 CrossRef CAS.
- H. M. AEl-Lateef, Corros. Sci., 2015, 92, 104 CrossRef.
- M. Lebrini, F. Bentiss, H. Vezin and M. Lagrene, Corros. Sci., 2016, 48, 1279 CrossRef.
- R. Solmaz, Corros. Sci., 2014, 79, 169 CrossRef CAS.
- X. Li, S. Deng and S. H. Fu, Corros. Sci., 2012, 55, 280 CrossRef CAS.
- M. M. Kabanda, L. C. Murulana, M. Ozcan, F. Karadag, I. Dehri, I. B. Obozt and E. E. Ebenso, Int. J. Electrochem. Sci., 2012, 7, 5035 CAS.
- B. D. Mert, M. E. Mert, G. Kardaş and B. Yazıcı, Corros. Sci., 2011, 53, 4265 CrossRef CAS.
- G. Gece, Corros. Sci., 2008, 50, 2981 CrossRef CAS.
- P. O. Ameh, P. U. Koha and N. O. Eddy, Chem. Sci. J., 2015, 6, 3 RSC.
- S. Kumar, D. Sharma, P. Yadav and M. Yadav, Ind. Eng. Chem. Res., 2013, 52, 14019 CrossRef CAS.
- M. Yadav, D. Behera, S. Sumit and R. R. Sinha, Indian J. Chem. Technol., 2014, 21, 262 Search PubMed.
- B. M. Mistry, N. S. Patels, S. Sahoos and S. Jauhari, Bull. Mater. Sci., 2012, 35, 459 CrossRef CAS.
- M. Abdallah, A. M. El Defrawy, I. A. Zaafarany, M. Sobhi, A. H. M. Elwahy and M. R. Shaaban, Int. J. Electrochem. Sci., 2014, 9, 2186 Search PubMed.
- G. Bereket, C. Öğretir and A. Yurt, J. Mol. Struct.: THEOCHEM, 2001, 571, 139 CrossRef CAS.
- G. Bereket, E. Hür and C. Öğretir, J. Mol. Struct.: THEOCHEM, 2002, 578, 79 CrossRef CAS.
- M. M. Kabanda, L. C. Murulana and E. E. Ebenso, Int. J. Electrochem. Sci., 2012, 7, 7179 CAS.
- R. L. Camacho-Mendoza, E. Gutiérrez-Moreno, E. Guzmán-Percástegui, E. Aquino-Torres, J. Cruz-Borbolla, J. A. Rodríguez-Ávila, J. G. Alvarado-Rodríguez, O. Olvera-Neria, P. Thangarasu and J. L. Medina-Franco, J. Chem. Inf. Model., 2015, 55, 2391 CrossRef CAS PubMed.
- R. M. Issa, M. K. Awad and F. M. Atlam, Mater. Corros., 2010, 61, 709 CAS.
- E. E. Ebenso, M. M. Kabanda, T. Arslan, M. Saracoglu, F. Kandemirli, L. C. Murulana, A. K. Singh, S. K. Shukla, B. Hammouti, K. F. Khaled, M. A. Quraishi, I. B. Obot and N. O. Eddy, Int. J. Electrochem. Sci., 2012, 7, 5643 CAS.
- A. Jmiai, H. Bourzi, B. EL Ibrahimi, S. EL Issami, L. Bazzi and M. Hilali, Int. J. Eng. Sci. Res. Technol., 2016, 5, 235 Search PubMed.
- S. Karthikeyan, P. A. Jeeva and S. Narayanan, Int. J. ChemTech Res., 2013, 5, 1897 CAS.
- F. Shojaie, Jordan J. Chem., 2015, 10, 161 CrossRef.
- M. A. Amin, M. A. Ahmed, H. A. Arida, F. Kandemirli, M. Saracoglu, T. Arslan and M. A. Basarang, Corros. Sci., 2011, 53, 1895 CrossRef CAS.
- M. Yadav, S. Kumar, I. Bahadur and D. Ramjugernath, Int. J. Electrochem. Sci., 2014, 9, 3928 Search PubMed.
- N. O. Obi-Egbedi, I. B. Obot, M. I. El-Khaiary, S. A. Umoren and E. E. Ebenso, Int. J. Electrochem. Sci., 2011, 6, 5649 CAS.
- E. E. Ebenso, D. A. Isabirye and N. O. Eddy, Int. J. Mol. Sci., 2010, 11, 2473 CrossRef CAS PubMed.
- M. E. Belghiti, Y. Karzazi, S. Tighadouini, A. Dafali, C. Jama, I. Warad, B. Hammouti and S. Radi, J. Mater. Environ. Sci., 2016, 7, 956 Search PubMed.
- I. Lukovits, E. Kálmán and F. Zucchi, Corrosion, 2001, 57, 3 CrossRef CAS.
Footnote |
| † Electronic supplementary information (ESI) available. See DOI: 10.1039/c6ra28426d |
|
| This journal is © The Royal Society of Chemistry 2017 |
Click here to see how this site uses Cookies. View our privacy policy here.  Open Access Article
 *a,
Mohd. Mobina,
Mohammad Jane Alamb and
Shabbir Ahmadb


![[double bond, length as m-dash]](https://www.rsc.org/images/entities/char_e001.gif) CH–Ph).
CH–Ph).
![[thin space (1/6-em)]](https://www.rsc.org/images/entities/char_2009.gif)
![[thin space (1/6-em)]](https://www.rsc.org/images/entities/char_2009.gif)


![[thin space (1/6-em)]](https://www.rsc.org/images/entities/char_2009.gif) CR) vs. reciprocal of absolute temperature (1/T), which is shown in Fig. 5. By applying Arrhenius equation linear plot was obtained:
CR) vs. reciprocal of absolute temperature (1/T), which is shown in Fig. 5. By applying Arrhenius equation linear plot was obtained:

![[thin space (1/6-em)]](https://www.rsc.org/images/entities/char_2009.gif) CR vs. 1/T for the adsorption of iminium surfactant, (A) blank, (B) 5 × 10⁻⁴ M, (C) 1 × 10⁻⁴ M, (D) 5 × 10⁻⁵ M, (E) 1 × 10⁻⁵ M, (F) 5 × 10⁻⁶ M.
CR vs. 1/T for the adsorption of iminium surfactant, (A) blank, (B) 5 × 10⁻⁴ M, (C) 1 × 10⁻⁴ M, (D) 5 × 10⁻⁵ M, (E) 1 × 10⁻⁵ M, (F) 5 × 10⁻⁶ M.
 and intercept
  of the linear plot, gives the values of ΔH and ΔS, respectively and are presented in Table 4. From the given data it is observed that values of ΔH decreases in presence of inhibited solution compared to uninhibited solution. This confirms the process of chemisorptions. The shift of value of ΔS from positive to negative for uninhibited to inhibited medium indicates increase in the system order. Another plot of
  versus 1/T for the inhibitor was made (Fig. 7). From the slope
  of the plot, heat of adsorption, Qads was obtained and the values are given in Table 4. The calculated values of Qads are positive predicting the adsorption of inhibitor on plain carbon steel to be endothermic. The free energy of adsorption, (ΔGads) at different temperatures was calculated from the following equation:
![[thin space (1/6-em)]](https://www.rsc.org/images/entities/char_2009.gif) ln(55.5 K)
ln(55.5 K)

![[thin space (1/6-em)]](https://www.rsc.org/images/entities/char_2009.gif) CR/T vs. 1/T for the adsorption of iminium surfactant, (A) blank, (B) 5 × 10⁻⁴ M, (C) 1 × 10⁻⁴ M, (D) 5 × 10⁻⁵ M, (E) 1 × 10⁻⁵ M, (F) 5 × 10⁻⁶ M.
CR/T vs. 1/T for the adsorption of iminium surfactant, (A) blank, (B) 5 × 10⁻⁴ M, (C) 1 × 10⁻⁴ M, (D) 5 × 10⁻⁵ M, (E) 1 × 10⁻⁵ M, (F) 5 × 10⁻⁶ M.
![[thin space (1/6-em)]](https://www.rsc.org/images/entities/char_2009.gif)


![[thin space (1/6-em)]](https://www.rsc.org/images/entities/char_2009.gif)
![[thin space (1/6-em)]](https://www.rsc.org/images/entities/char_2009.gif)
![[thin space (1/6-em)]](https://www.rsc.org/images/entities/char_2009.gif)
![[thin space (1/6-em)]](https://www.rsc.org/images/entities/char_2009.gif)


