
 Open Access Article
 This Open Access Article is licensed under a
 Creative Commons Attribution 3.0 Unported Licence
Structure–activity relationships of Cu–ZrO2 catalysts for CO2 hydrogenation to methanol: interaction effects and reaction mechanism†
Yu Hao Wangab,
Wen Gui Gao *ab,
Hua Wangab,
Yan E. Zhengab,
Wei Naab and
Kong Zhai Liab
*ab,
Hua Wangab,
Yan E. Zhengab,
Wei Naab and
Kong Zhai Liab
aState Key Laboratory of Complex Nonferrous Metal Resources Clean Utilization, Kunming University of Science and Technology, Kunming 650093, China. E-mail: gao_wengui@126.com
bFaculty of Metallurgical and Energy Engineering, Kunming University of Science and Technology, Kunming 650093, China
First published on 27th January 2017
Abstract
A series of Cu–ZrO2 (CZ) catalysts with different surface area, copper surface area (SCu), oxygen vacancy concentration, and interaction between Cu and ZrO2 features were synthesized. The factors that could affect catalytic activity of CO2 hydrogenation to methanol were investigated. The interaction between Cu and ZrO2 is crucial for determining the catalytic activity. The catalyst possessing the strongest interaction between Cu and ZrO2, exhibited the optimum catalytic activity. The evolution of carbonaceous species and pyridine adsorption over CZ catalysts were investigated using in situ DRIFT spectroscopy. It is found that the hydrogenation of formate species is a rate-limiting step and H spillover plays an important role. The hydrogenation of formate species and H spillover are strongly dependent on the interaction. These results provide a new way of understanding the activity dependence and reaction mechanism of CO2 hydrogenation to methanol over CZ catalysts.
Introduction
Catalytic hydrogenation of carbon dioxide (CO2), one of the most important prototype reactions in heterogeneous catalysis, has attracted considerable attention due to its extensive application in environmental and energy areas (such as CO2 emission control, chemical transformation of CO2 into methanol, dimethyl ether, urea and hydrocarbons).1 Currently, the synthesis of methanol from CO2 hydrogenation has been intensively studied. Methanol is a key material for C1 chemistry and can be directly utilized as a fuel or further converted into many industrial chemicals,2 such as acetic acid, formaldehyde and dimethyl terephthalate. In addition, methanol is considered a promising and environmentally benign fuel for diesel engines and could be a mobile source of hydrogen to supply cells in the hydrogenation-steam reforming cycle.3 Steam reforming of methanol can be easily performed by in situ, which eliminates the inconvenience of hydrogen transport.4Currently, methanol is produced at industrial scale by feeding syngas (CO + H2) containing minor amounts (<5%) of CO2 over Cu–ZnO–Al2O3 catalysts operating at 220–300 °C and 5–10 MPa.5 However, the Cu–ZnO–Al2O3 catalysts exhibit poor catalytic performance for the CO2 hydrogenation6 due to the negative effect of water in the presence of the hydrophilic alumina carrier.5 Zirconia-supported copper catalysts, which exhibit interesting catalytic behaviour for CO2 hydrogenation, have been well documented.5,6
Despite extensive studies of methanol synthesis over CZ catalysts, the nature of the activity dependence on these materials remains unclear. Burch et al.7 proposed that metallic Cu is the active site because the activity is proportional to the Cu surface area. However, some researchers have suggested that a synergy between copper and the oxide components in the catalysts plays an important role in the activity.8 In addition, structural aspects of the catalysts, such as lattice strain,9 and crystal phase of the support,10 have also been hypothesized to play an important role in the activity. Rhodes and Bell11 reported that Cu/ZrO2 catalysts prepared with monoclinic ZrO2 (m-ZrO2) exhibited a higher activity and methanol selectivity than catalysts with the same Cu surface density deposited on tetragonal ZrO2 (t-ZrO2). The origin of these differences may be due to the presence of a higher concentration of anionic defects on m-ZrO2 than that on t-ZrO2.11,12 However, Köppel et al.13 suggested that the presence of t-ZrO2 promoted methanol formation from CO and CO2. A high-copper/zirconia interfacial area has also been considered key for obtaining highly active and selective copper catalysts with improved stability.14 Therefore, the true roles of the SCu, support effects and structure in CZ catalysts for CO2 hydrogenation are not fully understood. Although it was reported that the formation of a copper-oxide interface is essential for high catalytic activity in the synthesis of methanol from CO2 hydrogenation,15 there is still a lack of clear recognition of how the interaction between Cu and oxide to influence the catalytic activity. In situ technology is fundamental to investigate the catalytic mechanism. Therefore, it is necessary to investigate the detailed spectroscopic of how these factors influence the reactivity of CO2 hydrogenation over CZ catalysts under real reaction condition (3 MPa, 220 °C).
The effect of catalyst features on the catalytic behaviours may be magnified over CZ catalysts obtained under different conditions, which would make the catalytic processes be able to respond to nuances in the physicochemical properties of catalysts. Therefore, it is reasonable to believe that the various CZ catalysts would be ideal candidates to thoroughly investigate the relationship between their textural properties and catalytic activity. In this study, the CZ catalysts were prepared by the co-precipitation method under various calcination temperatures. These catalysts present different characteristics in surface area, SCu, oxygen vacancy concentration and the interaction between Cu and ZrO2. Investigations on the physicochemical properties of these catalysts were performed, which were associated with their catalytic activity for CO2 hydrogenation to methanol. Particularly, the nature of the CO/CO2/pyridine adsorption and CO2 hydrogenation over the CZ catalysts using in situ infrared technology were also studied. The results showed that the interaction between Cu and ZrO2 was much more critical for CO2 hydrogenation to methanol than surface area, SCu and oxygen vacancy concentrations. For the reaction mechanism, the hydrogenation of formate species was the rate-limiting step and the H spillover from Cu to the metal oxides, which was controlled by the interaction, played an important role. These results will bring new insights into the determinant factors and reaction mechanism for CO2 hydrogenation to methanol over CZ catalysts.
Experimental
Catalyst preparation
First, analytical-grade Cu(NO3)2·3H2O and Zr(NO3)4·5H2O, which purchased from Aladdin Reagent Company, were dissolved in deionized water to form a transparent solution (0.5 mol L−1), in which the molar ratio of Cu2+ and Zr4+ is consistent with (CuO)0.5 (ZrO2)0.5. And then, NH3·H2O (2.5 wt%) and the nitrate solution were added slowly to 200 mL of deionized water, simultaneously. The solutions were stirred at 70 °C and the pH of the slurry was carefully maintained at 6.5. Then, the slurry was aged at the same temperature for 1 h. The precursor was filtered and exhaustively washed with deionized water. Finally, the precursor was dried in an oven at 100 °C for 12 h and further calcined under static air at 350, 450, 550, and 650 °C for 6 h. The obtained samples that were calcined at different temperature are labelled as CZ-350, CZ-450, CZ-550 and CZ-650, respectively.Physical and chemical characterizations
The composition of catalysts was determined by ICP-OES (Optima2100DV, Perkin Elmer).The specific surface area of the catalysts was calculated according to the BET method using the N2 adsorption isotherm at −196 °C obtained on a Quantachrome Autosorb-iQ instrument.
The crystal phases of the prepared catalysts were identified using a powder X-ray diffractometer (Rigaku D/max-R) with Cu Kα radiation (λ = 0.15406 nm). The X-ray tube was operated at 40 kV and 40 mA. The XRD patterns were recorded for 2θ values ranging from 20° to 60° at a scanning rate of 5° min−1. The reduction of samples were carried out in a pipe furnace. The calcined Cu/ZrO2 oxides were heated in 10% H2/Ar (50 mL min−1) from RT to 300 °C with 2 °C min−1 and maintained at 300 °C for 1 h, thereafter, the samples were cooled to RT. Next, the detection of reduced samples were carried out immediately.
The Raman spectra of the catalysts were recorded on a Renishaw Invia Raman imaging microscope. The exciting wavelength was 514.5 nm from an Ar ion laser with a power of ca. 10 mW on the samples. The scanning range ranged from 100 to 1000 cm−1.
The X-ray photoelectron spectroscopy (XPS) experiments were carried out on a PHI 5000 Versaprobe II system equipped with a monochromatic Al Kα X-ray source. The spectra were recorded after purging the samples at ambient temperature under vacuum (residual pressure < 10−7 Pa). An electron flood gun compensated the sample charging during the measurement. The electron take-off angle was 45° with respect to the sample surface, and the analyser was operated in constant pass energy mode (46.95 eV). The C 1s signal at 284.8 eV was used as an internal standard for calibration of the XPS signals.
H2 temperature-programmed reaction (H2-TPR) was performed on a ChemBET Pulsar & TPR/TPD apparatus (Quantachrome Instruments) with a thermal conductivity detector (TCD). 50 mg of catalysts were used along with a heating rate of 10 °C min−1. After a standard cleaning pre-treatment, the TPR was carried out in a flow of 10% H2/Ar (20 mL min−1) up to 400 °C.
The metallic copper surface area (SCu) was measured using a nitrous oxide decomposition method followed by H2-TPR.16 The catalysts (50 mg) were first reduced with 10% H2/Ar at 300 °C for 1 h followed by purging with He for 30 min and cooling to 60 °C. Next, a flow of 10% N2O/He gas was fed into the reactor for 1 h. TPR was subsequently performed under a 10% H2/Ar flow to 300 °C with a ramp rate of 10 °C min−1. The copper surface area was calculated from the amount of H2 consumed during the TPR step by assuming that the copper crystallites are spherical.
| SCu (m2 gcat−1) = [200 (mol H2) × (SF) × (NA)]/(SDCu) |
Diffuse reflectance infrared Fourier transform spectroscopy (DRIFTS) analysis was used to evaluate the adsorbed species on the catalyst under reaction conditions. The infrared spectra were recorded by an FTIR spectrometer (vertex 70, Bruker, Germany) equipped with a liquid N2 cooled mercury-cadmium-telluride (MCT) detector. A Pike Technologies HC-900 DRIFTS cell with a nominal cell volume of 6 cm3 was used. The scans were collected from 4000 to 600 cm−1 at a resolution of 4 cm−1. The catalyst samples were placed in a DRIFTS cell equipped with ZnSe windows. In an effort to remove any residual surface species prior to testing, each sample was calcined in a 10% O2/He mixture flowing at 60 cm3 min−1. The sample was heated from room temperature to 300 °C at 10 °C min−1 and maintained at 300 °C for 2 h. Then, the sample was cooled to 50 °C, swept with He, and reduced in a 10% H2/He mixture at a flow rate of 60 cm3 min−1 while increasing the temperature at a rate of 10 °C min−1 to 300 °C. The flow of 10% H2/He was maintained at 300 °C for 1 h prior to switching to a 100% H2 flow for an additional 2 h. The sample was flushed with He for 1 h prior to sample testing.
In the CO adsorption experiments, the pre-treated sample was exposed to CO for 30 min, and then swept with He for 30 min at 50 °C under atmosphere pressure and a total rate of 60 cm3 min−1.
In the CO2 adsorption experiments, the pre-treated sample was exposed to CO2 under atmosphere pressure at 220 °C at a total rate of 60 cm3 min−1.
In the CO2 hydrogenation experiments, the pre-treated sample was exposed to 25% CO2/H2 under a pressure of 3 MPa at 220 °C and a total rate of 60 cm3 min−1.
In the pyridine adsorption experiments, a 10% H2/He flowed into the pyridine saturator, exposing the catalyst surface to the mixed gases (gaseous pyridine, hydrogen and helium) under atmosphere pressure at 150 °C and a total rate of 60 cm3 min−1.
Activity test
The activity and selectivity measurements for CO2 hydrogenation to methanol were performed in a high-pressure fixed-bed flow stainless steel reactor. 1.0 g of catalyst that was diluted with quartz sand (both in 20–40 mesh) was packed into the stainless steel tubular reactor. Prior to the catalytic measurements, the catalyst was reduced in a stream of 10% H2/N2 at 300 °C for 6 h under atmospheric pressure. Then, the temperature in the catalyst bed was cooled to 50 °C, and the reductive gas was replaced by the reaction gas, which consisted of 24.4% CO2 and 75.6% H2. In addition, the pressure was increased to 3.0 MPa, the GHSV was set to 3600 h−1, and the temperature was increased to a reaction temperature of 220 °C. The reaction was conducted under these conditions for approximately 16 h. The reactants and products flowing out in the reactors were passed through the gas/liquid separator connected to a heat exchanger (0 °C) and then weighed and analysed by GC (Agilent Technologies 6890A) equipped with a FID (HP-PLOT/Q capillary column). The uncondensed gases and light hydrocarbons (CO2, CO, DME and C1–C6) were analysed online at different time intervals in a GC (Agilent Technologies 6890A) equipped with a TCD for quantification of CO, CO2, CH4 and N2 and a FID for analysis of the hydrocarbons. In addition, HP-PLOT/Q capillary and HP-MOLESIEVE capillary columns were used in series to achieve separation. The CO2 conversion and CH3OH selectivity were obtained from the GC data.Results and discussion
Structural properties and catalytic performance of catalysts
X-ray diffraction patterns of the CZ and reduced CZ samples were shown in Fig. 1. The diffraction peaks of CuO phase (JCPDS 80-1268) were observed at 2θ of 35.6° and 38.8° for all the samples. As the calcination temperature increased from 350 to 650 °C, the diffraction peaks of CuO became more intense and sharper, owing to the continuous enhancement of the crystallite size of CuO phase. In Fig. 1a, the diffraction peaks of ZrO2 were barely visible for the catalysts calcined at 350 and 450 °C, representing either an amorphous nature (a-ZrO2) or a poorer crystallization of ZrO2. As the calcination temperature increased to 550 °C, the diffraction peaks of tetragonal phase of ZrO2 (t-ZrO2) were observed at 2θ of 30.5° (t-ZrO2 JCPDS 88-1007). As the calcination temperature increased from 550 to 650 °C, the diffraction peaks of monoclinic phase of ZrO2 (m-ZrO2) appeared at 2θ of 28.2° and 31.5°, respectively (m-ZrO2 JCPDS 83-0940).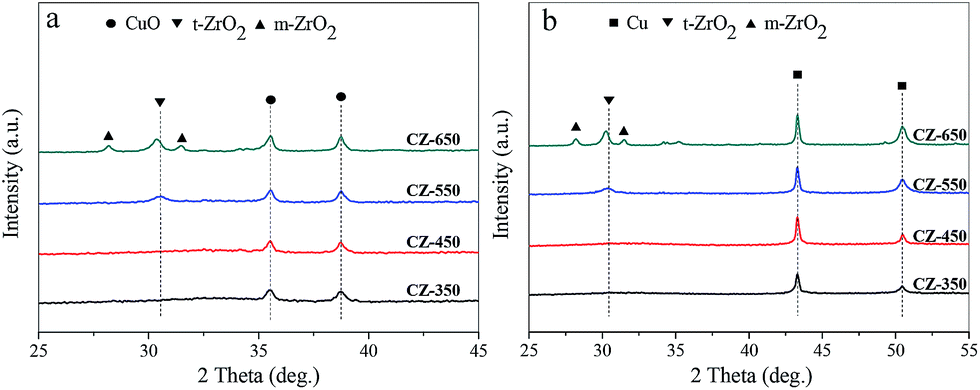 | ||
| Fig. 1 X-ray powder diffraction patterns of the (a) fresh CZ and (b) reduced CZ samples: (●) CuO, (■) Cu, (▼) t-ZrO2 and (▲) m-ZrO2. | ||
Fig. 1b showed the X-ray diffraction patterns of the reduced CZ. Compared with the fresh samples, the reduced samples exhibited a similar variation trend. The diffraction peaks of Cu were observed at 43.3° and 50.5°.
It is important to note that the t-ZrO2 peak at 30.5° shifted to a lower angle with the increase of calcination temperature in Fig. 1a. Similarly, the t-ZrO2 peak in Fig. 1b shifted from 30.5° to 30.3° with the calcination temperature increased from 550 to 650 °C. This phenomenon can be attributed to a substantial incorporation of Cu2+/Cu0 into ZrO2 upon calcination at 550 °C, and then with the increase of calcination temperature, the transformation of t-ZrO2 into m-ZrO2 was observed. Therefore, the shift of the t-ZrO2 peak from high angle to low angle may be due to phase segregation of Cu2+/Cu0 accompanied by ZrO2 phase transformation.17
Fig. 2 shows the Cu 2p and Zr 3d XPS patterns of reduced CZ samples. The XPS parameters are summarized in Table 1. As shown in Fig. 2a, all the samples exhibited Cu 2p3/2 and Cu 2p1/2 main peaks with BEs values at approximately 932.7 and 952.5 eV, respectively, with a spin–orbit coupling energy of 19.8 eV. A shake-up satellite peak at approximately 942 eV was not detected, which suggests the absence of Cu2+ species.18 However, the Cu+ or Cu0 species are hardly distinguished because of completely filled 3d shells. Analysis of the Cu L3VV Auger peak is presented in Fig. S1,† this result shows that the Cu nanoparticles are reduced to the metallic state after each pretreatment.19 Fig. 2b shows the Zr 3d spectra of reduced CZ samples, with a spin–orbit coupling energy of 2.4 eV. Decomposition of the spectra produces peaks attributed to the existence of two kinds of zirconium species, labelled as ZrI with low BE and ZrII with higher BE. As shown in the fitting to these curves, the lower BE values of Zr species are oxygen coordinatively unsaturated Zr sites such as Zr3+ centers on ZrO2 surface, accompanied with the formation of oxygen vacancies in the ZrO2 lattice.20 The results of Table 1 indicate that the oxygen vacancies concentration increased from CZ-350 to CZ-650. Simultaneously, the BE values for Zr shifted towards the lower binding energy. The position shifted towards the lower binding energy might be associated with the holes created by oxygen vacancies in the ZrO2 lattice.21
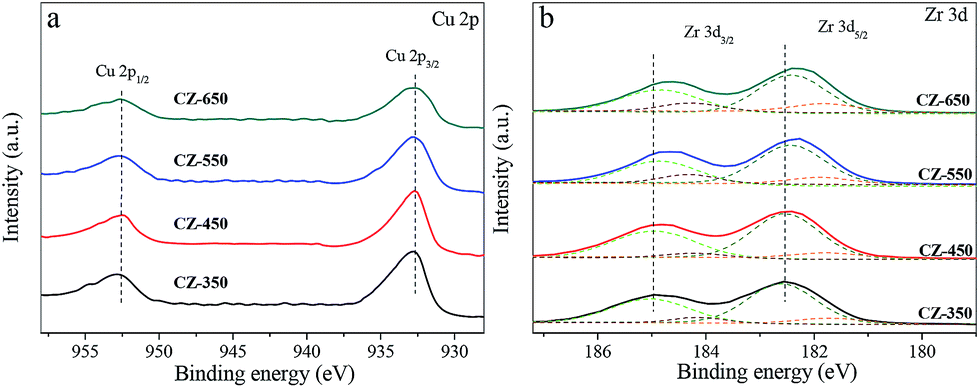 | ||
| Fig. 2 Cu 2p (a) and Zr 3d (b) XPS spectra of reduced CZ samples. | ||
| Catalysts | Cu 2p3/2 (eV) | Zr 3d5/2 (eV) | |
|---|---|---|---|
| ZrI | ZrII | ||
| CZ-350 | 932.6 | 181.5(5) | 182.6(95) |
| CZ-450 | 932.6 | 181.5(5) | 182.6(95) |
| CZ-550 | 932.6 | 181.4(8) | 182.4(92) |
| CZ-650 | 932.7 | 181.3(13) | 182.4(87) |
Raman spectroscopy is an effective technique to study the surface characteristics of the catalysts. The Raman spectra of various CZ samples are shown in Fig. 3. The bands located at 270, 320, and 607 cm−1 may be due to the vibrations of the Cu–O bonds in the CuO lattice.17,22 The bands located at 142 and 460 cm−1 are assigned to t-ZrO2, and the bands at 173, 184, 372 and 475 cm−1 are characteristic of m-ZrO2.23
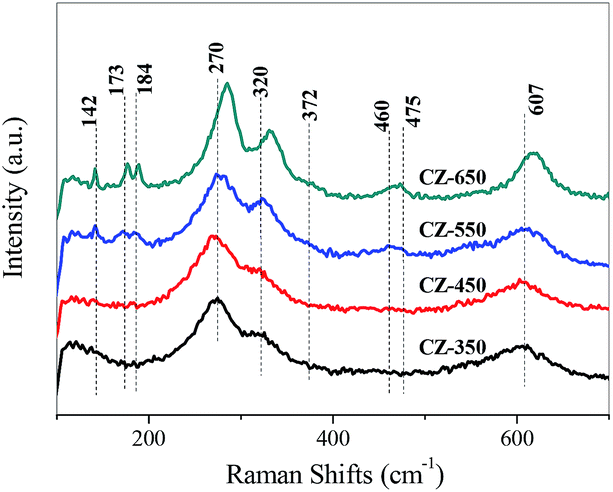 | ||
| Fig. 3 Raman spectra of various CZ samples. | ||
As the calcination temperature was 350 °C, only the bands corresponding to CuO were detected, indicating that the ZrO2 was amorphous.22 As the calcination temperature increased from 550 to 650 °C, the bands of t-ZrO2 and m-ZrO2 were detected and gradually increased. This can be ascribed to that the elevating of calcination temperature made the a-ZrO2 firstly converted to t-ZrO2 and then m-ZrO2.17,22
The bands of CuO became sharper and more intense as the calcination temperature increased, indicating an increase in the CuO crystalline size. Simultaneously, the bands of CuO shifted to higher frequency from the CZ-350 to the CZ-650. The bands of the CuO samples calcined at different temperature are shown in Fig. S2,† the apparent shift of the CuO band was not observed. These results can be ascribed to that the incorporation of Cu2+ into ZrO2 at lower calcination temperatures and segregated from ZrO2 at higher calcination temperatures.23 This result is in good agreement with the XRD results.
The physicochemical and catalytic properties of the CZ catalysts are presented in Table 2. All samples, the surface content Cu and O hardly changed, and the Zr surface content decreased slightly. Moreover, the values of metal Cu surface area, which was measured using the N2O decomposition method, indicated the catalyst calcined at 350 °C possessed the greater copper dispersion than other samples. Furthermore, the mean crystallite size of CuO increased from 10.9 nm in CZ-350 to 20.1 nm in CZ-650. After reduction, the mean crystallite size of Cu in all CZ catalysts increased. With the calcination temperature increased, the conversion of CO2 decreased monotonously, and the CH3OH selectivity reached to the highest value when calcined at 550 °C. The CZ-450 exhibited the optimal catalytic activity due to the highest CH3OH productivity.
| Catalysts | Average Cub (wt%) | Cuc (wt%) | Zrc (wt%) | Oc (wt%) | SBET (m2 g−1) | SCud (m2 g−1) | dCuOe (nm) | dCue (nm) | CO2 conversion (%) | CH3OH selectivity (%) | CH3OH productivity (10−7 mol s−1 g−1) |
|---|---|---|---|---|---|---|---|---|---|---|---|
a Reaction conditions: T = 220 °C, CO2![[thin space (1/6-em)]](https://www.rsc.org/images/entities/char_2009.gif) :H2 = 1:3, P = 3.0 MPa, GHSV = 3600 h−1.b Determined by ICP.c Determined by XPS.d Determined by N2O chemisorption measurements.e Determined by Scherrer's equation. :H2 = 1:3, P = 3.0 MPa, GHSV = 3600 h−1.b Determined by ICP.c Determined by XPS.d Determined by N2O chemisorption measurements.e Determined by Scherrer's equation. |
|||||||||||
| CZ-350 | 31.4 | 32.1 | 45.1 | 22.8 | 56.8 | 6.1 | 10.9 | 12.2 | 4.6 | 41.3 | 3.34 |
| CZ-450 | 31.7 | 32.3 | 44.3 | 23.4 | 48.4 | 5.5 | 13.2 | 15.4 | 4.2 | 53.9 | 3.92 |
| CZ-550 | 31.6 | 33.2 | 43.7 | 23.1 | 41.9 | 4.7 | 15.1 | 18.7 | 2.3 | 56.4 | 2.41 |
| CZ-650 | 31.9 | 33.7 | 42.8 | 23.5 | 34.3 | 3.3 | 20.1 | 23.9 | 1.1 | 32.9 | 1.03 |
The reducibility of catalysts
To investigate the reduction behaviour of the catalysts, H2-TPR measurements of the copper species in various CZ catalysts were carried out, and the results are shown in Fig. 4. All the samples exhibited a broad reduction profile along with shoulders at 200–290 °C. For all the samples, in a temperature range of 140–350 °C, H2/Cu ratios is higher than 1.0 (H2/Cu, 1.01–1.13) should be indicative of full reduction of CuO to Cu0, which is associated with incipient reduction of ZrO2 due to interaction with the Cu crystallites.11,24 The reduction peak of CuO shifted towards high temperature with the increase of calcination temperature, indicating the growth of CuO crystalline.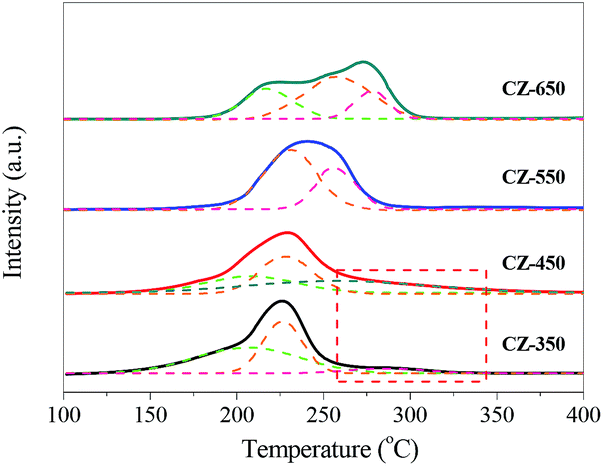 | ||
| Fig. 4 H2-TPR profiles of various CZ samples. | ||
To gain additional insight into the TPR results, the profiles were deconvoluted into at least three Gaussian peaks. The peak positions and their contributions derived from deconvolution are summarized in Table 3. This result suggests that at least three different types of CuO phases present in the CZ samples including a CuO phase on the surface (α-peak) as well as crystallized copper oxide strongly bound in the bulk (β-peak) or weakly interacting or coexisting with the support surface (γ-peak).25,26 As shown in Table 3, from CZ-350 to CZ-550, the contents of surface CuO (α-peak) decreased. This phenomenon can be attributed to the calcination temperature increased gradually and leaded to the transformation of surface CuO (α-peak) to bulk CuO (the β-peak and γ-peak). With the elevating of calcination temperature from 550 to 650 °C, the contents of surface CuO increased. This can be ascribed to that the bulk CuO crystallite grew, and then exposed on the sample surface.
| Catalysts | TM (°C) | Proportion of total area (%) | ||||
|---|---|---|---|---|---|---|
| α | β | γ | α | β | γ | |
| CZ-350 | 205 | 226 | 285 | 51 | 37 | 12 |
| CZ-450 | 207 | 227 | 269 | 27 | 42 | 31 |
| CZ-550 | — | 234 | 255 | 0 | 58 | 42 |
| CZ-650 | 219 | 256 | 278 | 28 | 54 | 18 |
Interestingly, the TPR curve of CZ-350 and CZ-450 are trailing, and this phenomenon can be ascribed to a substantial incorporation of Cu2+ ions into ZrO2, resulting in that it is hard to reduce these Cu2+.
In situ DRIFTS analysis
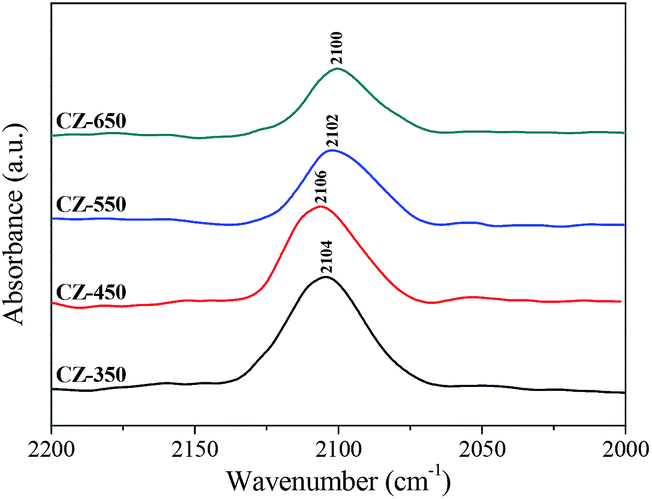
Fig. 5 shows the in situ DRIFT spectra of CO adsorption on various CZ catalysts after the reduction pretreatment. The bands from 2100 to 2106 cm−1 were assigned to the linear adsorption of CO, which corresponds to Cu0–CO species.27 The band of CO linear adsorption over CZ-450 located at the highest frequencies (2106 cm−1) and with the calcination temperature increased, the band shifted to lower frequencies. This result was caused by the structural and electronic changes of copper.28 The frequencies corresponding to the CO bands over the CZ-450 catalysts are higher than that over the other catalysts. This can be attributed to the presence of stronger interaction between Cu and supports,29 which could donate less electron density to the carbon copper bond. The ability of d–π electron feedback in Cu0–C![[triple bond, length as m-dash]](https://www.rsc.org/images/entities/char_e002.gif) O becomes weak, and the position of the Cu0–CO adsorption peak shifted to a higher frequency.30
O becomes weak, and the position of the Cu0–CO adsorption peak shifted to a higher frequency.30
 | ||
| Fig. 5 In situ DRIFT spectra of CO adsorption over the CZ catalysts sweeping with He for 30 min. The spectra are referenced to CZ-350, CZ-450, CZ-550 and CZ-650 under a He flow at 50 °C, respectively. | ||
Fig. 6a shows the spectra obtained after 30 min CO2 adsorption over the reduced CZ catalysts at 220 °C. The catalysts were exposed to a CO2 flow under atmospheric conditions. The bands located at 1597 and 1353 cm−1 may be attributed to υas (CO3) and υs (CO3) mode of bidentate carbonate species, respectively. The band located at 1517 cm−1 may be attributed to υas (CO3) mode of monodentate carbonate species.28,31 According to the literature, CO2 adsorbed on oxygen vacancies of ZrO2.32,33 With the increasing calcination temperature, progressive enhancement in the bands corresponding to the carbonate species was observed. This result can be attributed to that the catalysts with larger oxygen vacancy concentrations adsorbed more CO2 to form carbonate species. Fig. 6b shows the spectra obtained using the reduced CZ catalysts after switching from CO2 to 25% CO2/H2 at 220 °C. As soon as H2 was introduced, many new bands were detected. The bands at 1597, 1383, and 1367 cm−1 can be attributed to the υas(OCO), δ(CH), and υs(OCO) modes, respectively, of formate species, and the band at 2870 cm−1 was assigned to the C–H stretching vibration of formate species. The bands appeared at 1144 and 1049 cm−1 were assigned to the C–O stretch of methoxide species.11,12 The jagged bands located in the range of 1300–1800 cm−1 can be attributed to vibration of H2O (supported by Fig. S3†). However, the carbonate species disappeared. This phenomenon can be attributed to that the formation of formate and methoxide species originated from the hydrogenation of carbonate species. Interestingly, the amount of carbonate species increased with the elevating of calcination temperature, but more formate and methoxide species were detected over CZ-450. This can be ascribed to that the hydrogenation of carbonate species is faster over CZ-450.
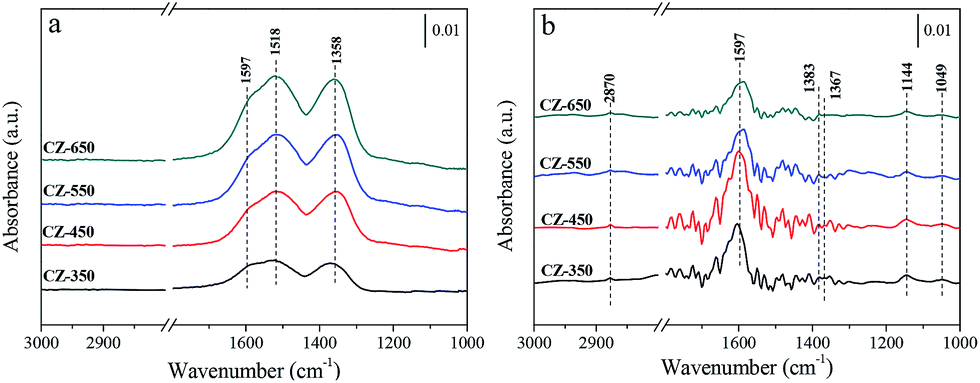 | ||
| Fig. 6 In situ DRIFT spectra of a CO2 flow (a) and switching feed from CO2 to 25% CO2/H2 (b) at 220 °C over the CZ catalysts. The spectra are referenced to CZ-350, CZ-450, CZ-550 and CZ-650 under a He flow at 220 °C, respectively. | ||
Fig. 7a–d shows the spectra obtained during CO2 hydrogenation at 220 °C and 3 MPa over the CZ catalysts in 25% CO2/H2. The bands located at approximately 1597, 1383 and 1367 cm−1 were formate species. The bands located at 1055, 1031 and 1005 cm−1 corresponded to gaseous CH3OH.37 Fig. 7e exhibits the evolution of the surface CH3OH species over different samples during the CO2 hydrogenation experiments, the band at 1031 cm−1 was used to follow the dynamics of methanol. The largest amount of methanol was detected over the CZ-450.
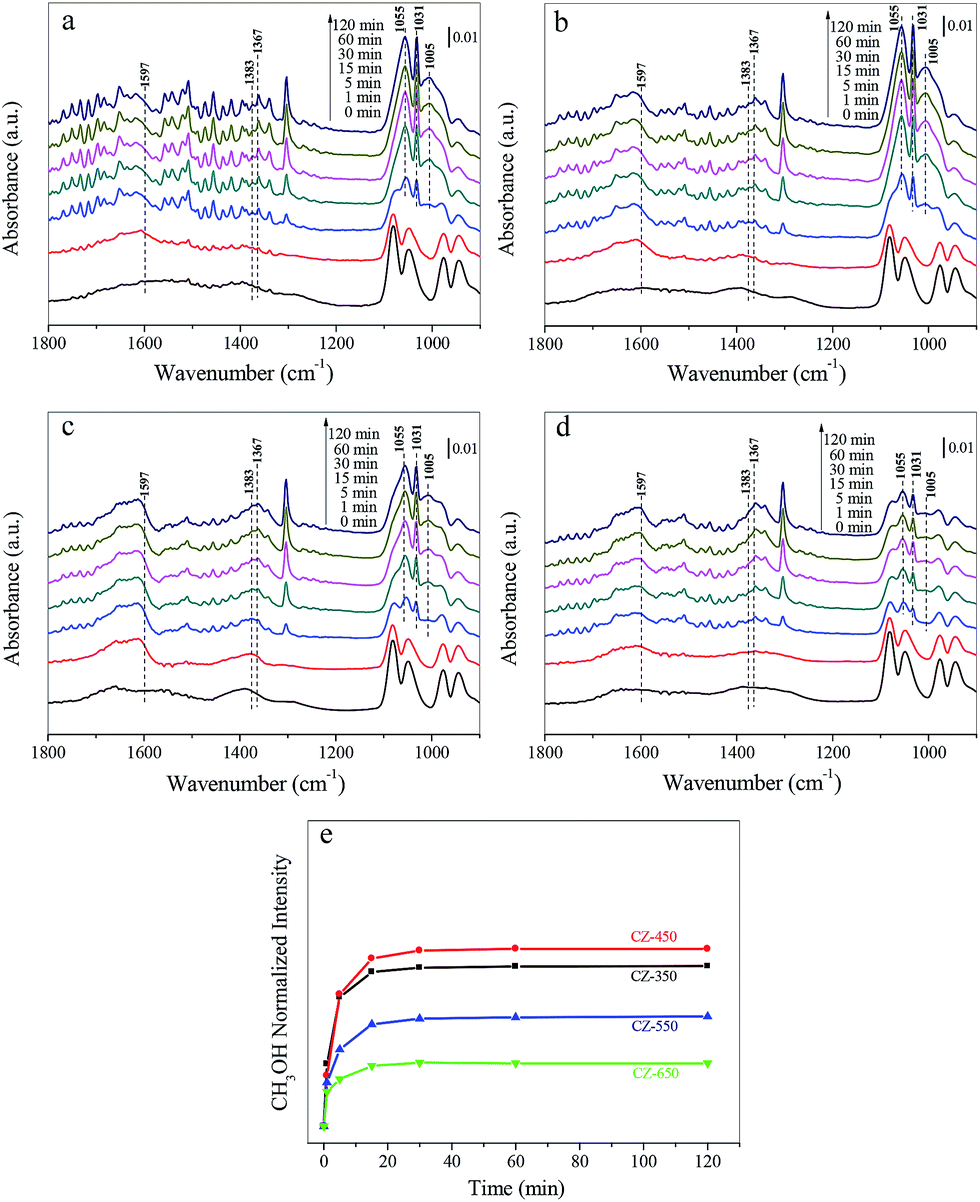 | ||
| Fig. 7 In situ DRIFT spectra of (a) CZ-350, (b) CZ-450, (c) CZ-550 and (d) CZ-650 at 220 °C, under the feed of 0.75 MPa CO2 and 2.25 MPa H2. The spectra are referenced to CZ-350, CZ-450, CZ-550 and CZ-650 under a 3 MPa He flow at 220 °C. (e) Peak intensity of gaseous CH3OH bands for CZ-350, CZ-450, CZ-550 and CZ-650 during the experiments. | ||
As CO2 hydrogenation proceeds, the carbonaceous species detected over CZ catalysts were varied. To compare this change, the stable spectra of each sample are listed in Fig. 8a. According to the literature, the formate species are important intermediate species for methanol synthesis.11,12,33–35 Fig. 8b exhibits peak intensity of formate species under different pressure, at 220 °C. The band at 1597 cm−1 was assigned to the formate species. The consumption of the formate species during CO2 hydrogenation at 220 °C and 3 MPa over the CZ catalysts decreased in the order of CZ-450 > CZ-350 > CZ-550 > CZ-650. It indicates that CZ-450 own faster hydrogenation rate of formate species.
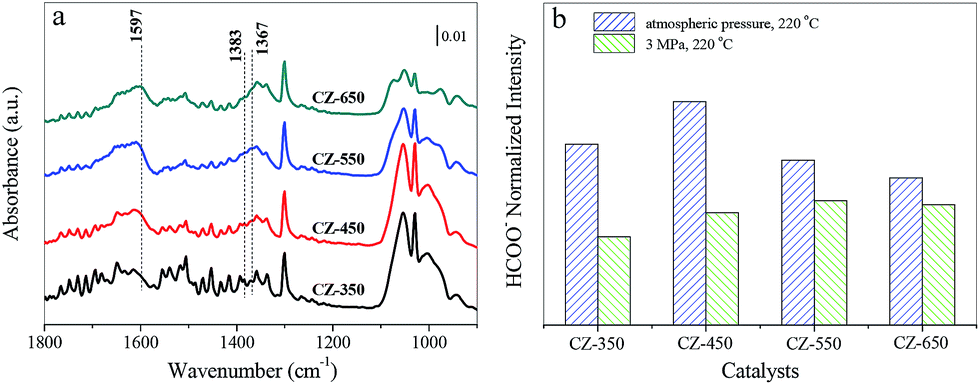 | ||
| Fig. 8 In situ DRIFT spectra of 25% CO2/H2 over the CZ catalysts at 3 MPa and 220 °C after 2 h (a). The spectra are referenced to CZ-350, CZ-450, CZ-550 and CZ-650 under a 3 MPa He flow at 220 °C, respectively. The normalized intensity of formate detected under different condition is listed (b). | ||
Fig. 9a exhibits the spectra of pyridine adsorbed on the studied catalysts to distinguish Brønsted and Lewis acidity. Triwahyono et al.36 reported that surface protons may come from molecular hydrogen. Hydrogen molecules may dissociatively adsorb on Cu sites to form hydrogen atoms. The hydrogen atoms spillover onto the support (ZrO2) and undergo surface diffusion reaching to Lewis acid sites where the hydrogen atoms can release an electron, forming a proton. The bands corresponding to Brønsted and Lewis sites were observed at 1542 and 1450 cm−1,4,37,38 respectively, which were used to follow the dynamics of acid sites. The peak intensity for Brønsted and Lewis acid sites are shown in Fig. 9b. The intensity of Brønsted acid bands were the strongest on the CZ-450 sample. It can be due to that more H+ presented on the ZrO2 of CZ-450. The intensity of Lewis acid bands became stronger with calcination temperature, indicating an increase in the coordinatively unsaturated metal atoms, which represent the formation of oxygen vacancies.12
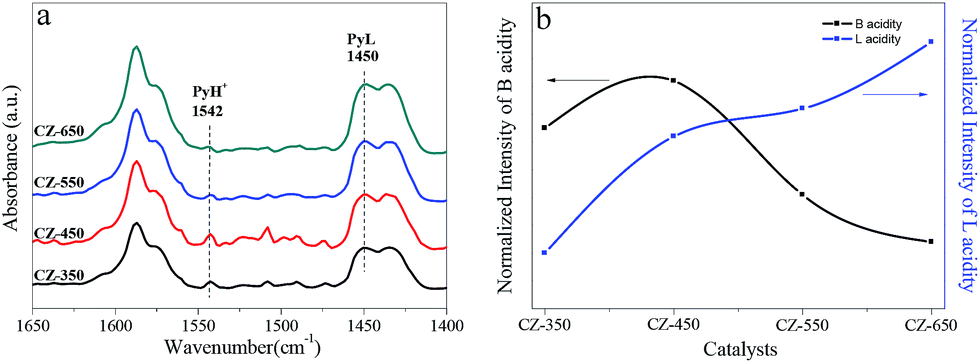 | ||
| Fig. 9 In situ DRIFT spectra of pyridine adsorption on the CZ catalysts (a) and the normalized intensity of B, L acid (b). | ||
Dominant factors for CO2 hydrogenation to methanol over CZ catalysts
It is generally accepted that the importance of CZ catalysts in CO2 hydrogenation to methanol originates from its interesting catalytic activity.6 The textural properties, such as the surface area, crystallite size and Cu surface area, may influence the catalytic performance for CO2 hydrogenation. According to the previous reports,39,40 for copper-based catalysts, well-dispersed CuO particles, Cu surface area and small crystallite size are responsible for the observed catalytic activity. However, the results in the present work reveal different phenomena. The results (Table 2) indicate that the CZ-350 owned the largest surface area and Cu surface area among all the samples. However, the CZ-350 doesn't exhibit the highest catalytic activity (see Table 2). Therefore, the surface area and Cu surface area of the CZ catalysts are not the critical factors for CO2 hydrogenation to methanol in this system.The presence of oxygen vacancies provides the sites for CO/CO2 hydrogenation.11,33 The activity of methanol synthesis over m-ZrO2 with more oxygen vacancies is significantly higher than that over t-ZrO2. The higher concentration of oxygen vacancies could lead to larger amount of intermediates formed, which favoured the formation of methanol over m-ZrO2.10 The XRD and Raman results (see Fig. 1 and 3) indicate that a-ZrO2 transformed into t-ZrO2 and then m-ZrO2 with the calcination temperature increased, resulting in the formation of more oxygen vacancies (see Fig. 2, 9 and Table 1). Compared with the CZ-450, the CZ-550 and CZ-650 possess higher oxygen vacancy concentrations, while exhibit the lower catalytic activity for CO2 hydrogenation to methanol. This result can be explained that the oxygen vacancy concentrations of CZ catalysts are not the critical factors for CO2 hydrogenation to methanol in this system.
The interaction between metal and metal oxide for CO2 hydrogenation was confirmed to enhance the catalytic performance.41 It was found that the adsorption energies of CO2 and O-containing intermediates (e.g., OH, HCO, H2CO, HCOO, H2COO, H3CO, and H2COOH) on the Cu(111)/ZrO2 interface are much higher than those of Cu(111), using density functional theory methods.42 Moreover, Zhu et al.43 observed the catalytic performance for dimethyl oxalate hydrogenation to ethylene glycol depended on the Cu–ZrO2 synergy not merely Cu or ZrO2. However, the detailed investigations of how the interaction influencing the catalytic activity of CZ catalysts in CO2 hydrogenation to methanol is rare. Rhodes et al.12 proposed that when the surface area of Cu was larger than 2.5 m2 g−1, the surface of ZrO2 was saturated with H atoms provided by spillover from Cu. This finding indicated that as the surface area of Cu was greater than 2.5 m2 g−1, the surface Cu atoms can provide excess H atoms through H2 decomposed on Cu atoms. Therefore, the extent of hydrogen spillover over all catalysts should be equivalent when their SCu are larger than 2.5 m2 g−1 (Table 2). Pyridine adsorption was performed to evaluate the extent of hydrogen spillover over various catalysts. Interestingly, the CZ-450 possesses more B acid sites (Fig. 9), indicating that more hydrogen atom spillover from Cu atoms to ZrO2 over CZ-450. This phenomenon also proved stronger interaction between Cu and ZrO2 over the CZ-450. The strong interaction can reduce the transport distance for H spillover44 and activation barriers for CO2 hydrogenation to methanol.45,46 The amount of B acid sites decreased in the order of CZ-450 > CZ-350 > CZ-550 > CZ-650 (Fig. 9). Therefore, it can be deduced that the intensity of interaction between Cu and ZrO2 over CZ catalysts decreased in the order of CZ-450 > CZ-350 > CZ-550 > CZ-650. Witoon et al.47 found that larger metal Cu surface can lead to more H atoms formed. However, the amount of H atoms on the ZrO2, which originated from the spillover of hydrogen on copper particles, was determined by the interaction between Cu and ZrO2, and the stronger Cu–ZrO2 interaction may enhance the spillover of atomic hydrogen from copper surface to the zirconia surface. As observed in the CO2 hydrogenation process over various CZ catalysts (see Fig. 7a–e), the amount of methanol formed over CZ catalysts is also proportional to the interaction between Cu and ZrO2. The interaction contributes to the hydrogenation of carbonation and formate species (Fig. 6 and 8), and accelerate the methanol synthesis. Similarly, Witoon et al.48 also found that the strong interaction between copper and alumina support contributed to the interfacial contact creating a large number of active sites for CO2 and H2 adsorption, resulting in the maximum yield of methanol. All these phenomena demonstrate that the interaction is a crucial factor to determine the catalytic activity in this system.
Mechanism for CO2 hydrogenation to methanol
Owing to great complexity of methanol synthesis from CO2 hydrogenation, atomic level understanding regarding the reaction mechanism has been a long-standing challenge.49 Two classes of reaction routes to methanol have been debated in literature. One is the CO2 hydrogenation to generate methanol directly. The other pathway involves the formation of CO through the RWGS reaction and the conventional syngas-to-methanol conversion (CO + 2H2 → CH3OH). It is well accepted that the former is a predominant pathway for CO2 hydrogenation to methanol. Fisher et al.33 considered that CO2 adsorbed on bare oxides and H2 can dissociate on Cu species. First, CO2 transformed into carbonate species and then hydrogenated to produce formate intermediate species, finally methanol. A detailed study was carried out to investigate the reaction pathway for CO2 hydrogenation to methanol using in situ FTIR spectroscopy. The pathway proceeds through the formation of formate which provided by hydrogenation of adsorbed carbonate, and then dioxomethylene, methoxy, and the final product, methanol.50Our research suggested that the pathway of methanol synthesis over CZ catalysts also followed the first reaction pathway, as shown in Scheme 1. Gaseous H2 dissociatively adsorbed on the Cu0 forming H atoms, and then the H atoms spillover to the ZrO2 through the interface between Cu0 and ZrO2.36 Gaseous CO2 adsorbed on the oxygen vacancies of ZrO2 forming a carbonate species (see Fig. 6a). The formate species, methoxide species and H2O were formed after carbonate species reacting with the adjacent hydrogen atoms (see Fig. 6b). According to the literature,33 the hydrogenation of formate species to form the methoxide species and H2O, and then the methoxide species reacted with H2O to form methanol and OH group, finally, the OH group reacted with H atoms to form H2O. In this investigation, the methoxide species and H2O were observed during CO2 hydrogenation at 220 °C under atmosphere pressure (see Fig. 6b). However, the methoxide species, which should be appeared at ∼1150 cm−1, were not detected in IR spectra during CO2 hydrogenation at 220 °C under 3 MPa (see Fig. 7). This may be ascribed to that the reaction of methoxide species with H2O was rapid and the infrared spectrometer can't detect the reaction under this condition (3 MPa, 220 °C). This phenomenon indicates that this process is not the rate-limiting step in this reaction. Interestingly, the hydrogen spillover (see Fig. 9a) was associated with the catalytic activity of the CZ catalysts (see Table 2). This phenomenon suggests that the hydrogen spillover may be the rate-limiting step in this reaction. However, Jung and Bell51 found the rate of hydrogen spillover is more than an order of magnitude faster than the rate of methanol formation, and, hence, not a rate-limiting step in the synthesis of methanol. This phenomenon can be ascribed to that hydrogen spillover promote the hydrogenation of intermediates (carbonate and formate species), and enhance the rate of methanol synthesis. A well linear relationship between the rate of formate species hydrogenation (see Fig. 8b) and catalytic performance of the CZ catalysts (see Table 2) can be established, indicating the hydrogenation of formate species may be the rate-limiting step in the synthesis of methanol over CZ catalysts.
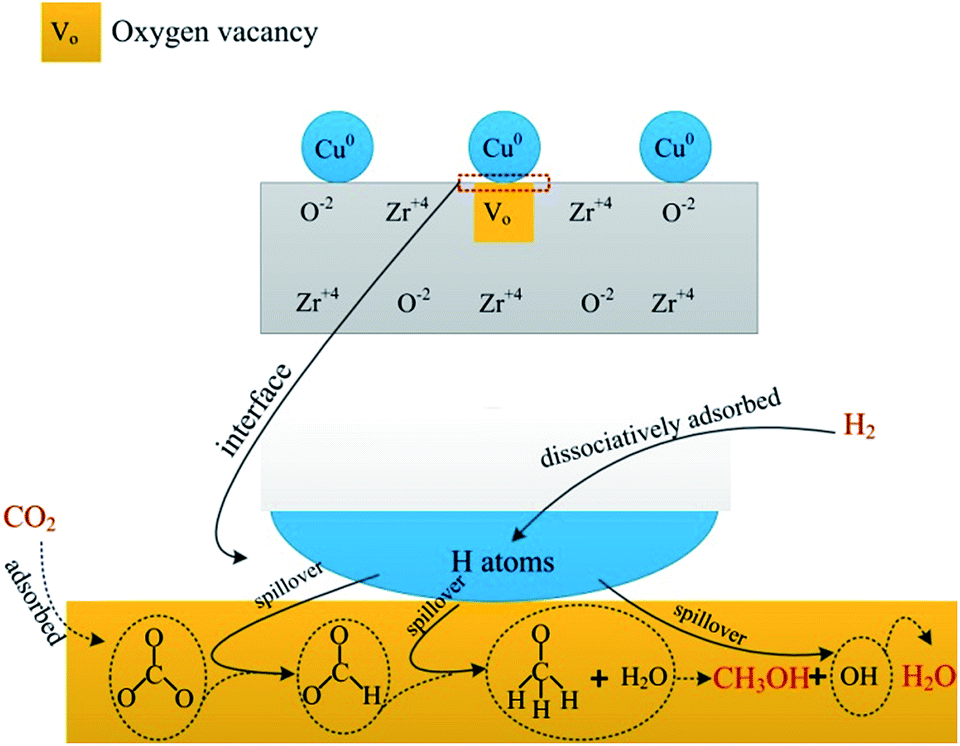 | ||
| Scheme 1 Reaction pathway of CO2 hydrogenation to methanol over CZ catalysts. | ||
Conclusions
A series of CZ catalysts with different features in surface area, copper surface area (SCu), oxygen vacancy concentrations and interaction between Cu and the metal oxide were synthesized. Their physicochemical properties are associated with the catalytic performances to identify the most crucial factor for methanol synthesis. The interaction among CZ catalysts and reaction mechanism were further investigated in detail by using in situ DRIFT spectra.One of the most important phenomena is that the CZ-350, which owns larger surface area and SCu compared with the CZ-450 samples, showed lower catalytic activity. Besides, the CZ-550 and CZ-650, which own higher oxygen vacancy concentrations than the CZ-450, showed much poor catalytic activity. This can be ascribed to the weaker interaction among CZ-350, CZ-550 and CZ-650. By contrast, the CZ-450 presented higher catalytic activity than the other catalysts due to the stronger interaction between Cu and ZrO2, promoting the hydrogenation of formate species, which is the rate-limiting step. This indicated that the interaction is more crucial for determining the catalytic activity when compared with the other parameters such as surface area, SCu and oxygen vacancy concentrations. The findings proposed in this work would enrich the knowledge in understanding the fundamental features of the catalytic activity and in designing rational catalyst.
Acknowledgements
This study was financially supported by the National Natural Science Foundation of China (51304099 and 51404122), the Applied Basic Research Program of Yunnan Province (2013FZ035), the National Key Technologies R & D Program of China (2011BAC01B03). Also, the authors would like to acknowledge the technical supported from the Analysis and Testing Foundation of Kunming University of Science and Technology.Notes and references
- R. Steeneveldt, B. Berger and T. A. Torp, Chem. Eng. Res. Des., 2006, 84, 739–763 CrossRef CAS.
- A. Kiennemann and J. P. Hindermann, Stud. Surf. Sci. Catal., 1988, 35, 181–256 CrossRef.
- S. Velu, K. Suzuki, M. Okazaki, M. P. Kapoor, T. Osaki and F. Ohashi, J. Catal., 2000, 194, 373–384 CrossRef CAS.
- K. Samson, M. Sliwa, R. P. Socha, K. Góra-Marek, D. Mucha, D. Rutkowska-Zbik, J. F. Paul, M. Ruggiero-Mikołajczyk, R. Grabowski and J. Słoczyński, ACS Catal., 2014, 4, 3730–3741 CrossRef CAS.
- F. Arena, G. Italiano, K. Barbera, S. Bordiga, G. Bonura, L. Spadaro and F. Frusteri, Appl. Catal., A, 2008, 350, 16–23 CrossRef CAS.
- F. Arena, K. Barbera, G. Italiano, G. Bonura, L. Spadaro and F. Frusteri, J. Catal., 2007, 249, 185–194 CrossRef CAS.
- R. Burch, S. E. Golunski and M. S. Spencer, Catal. Lett., 1990, 5, 55–60 CrossRef CAS.
- J. Nakamura, I. Nakamura, T. Uchijima, Y. Kanai, T. Watanabe, M. Saito and T. Fujitani, J. Catal., 1996, 160, 65–75 CrossRef CAS.
- I. Kasatkin, P. Kurr, B. Kniep, A. Trunschke and R. Schlögl, Angew. Chem., Int. Ed., 2007, 119, 7465–7468 CrossRef.
- K. T. Jung and A. T. Bell, Catal. Lett., 2002, 80, 63–68 CrossRef CAS.
- M. D. Rhodes and A. T. Bell, J. Catal., 2005, 233, 198–209 CrossRef CAS.
- M. D. Rhodes, K. A. Pokrovski and A. T. Bell, J. Catal., 2005, 233, 210–220 CrossRef CAS.
- R. A. Köppel, C. Stöcker and A. Baiker, J. Catal., 1988, 179, 515–527 CrossRef.
- R. A. Köppel, A. Baiker and A. Wokaun, Appl. Catal., A, 1992, 84, 77–102 CrossRef.
- S. D. Senanayake, P. J. Ramírez, I. Waluyo, S. Kundu, K. Mudiyanselage, Z. Y. Liu, Z. Liu, S. Axnanda, D. J. Stacchiola, J. Evans and J. A. Rodriguez, J. Phys. Chem. C, 2016, 120, 1778–1784 CAS.
- S. Natesakhawat, J. W. Lekse, J. P. Baltrus, P. R. Ohodnicki, B. H. Howard, X. Y. Deng and C. Matranga, ACS Catal., 2012, 2, 1667–1676 CrossRef CAS.
- L. C. Wang, Q. Liu, M. Chen, Y. M. Liu, Y. Cao, H. Yong and K. N. Fan, J. Phys. Chem. C, 2007, 111, 16549–16557 CAS.
- A. G. Sato, D. P. Volanti, D. M. Meira, S. Damyanova, E. Longo and J. M. C. Bueno, J. Catal., 2013, 307, 1–17 CrossRef CAS.
- S. Kuld, C. Conradsen, P. G. Moses, I. Chorkendorff and J. Sehested, Angew. Chem., Int. Ed., 2014, 53, 5941–5945 CrossRef CAS PubMed.
- S. Velu, K. Suzuki, C. S. Gopinath, H. Yoshidac and T. Hattori, Phys. Chem. Chem. Phys., 2002, 4, 1990–1999 RSC.
- M. K. Dongare, A. M. Dongare, V. B. Tare and E. Kemnitz, Solid State Ionics, 2002, 455, 152–153 Search PubMed.
- S. B. Xie, E. Iglesia and A. T. Bell, Chem. Mater., 2000, 12, 2442–2447 CrossRef CAS.
- Y. F. Zhu, X. Kong, D. B. Cao, J. L. Cui, Y. L. Zhu and Y. W. Li, ACS Catal., 2014, 4, 3675–3681 CrossRef CAS.
- G. Bonura, M. Cordaro, C. Cannilla, F. Arena and F. Frusteri, Appl. Catal., B, 2014, 152, 152–161 CrossRef.
- J. Słoczyński, R. Grabowski, A. Kozłowska, P. K. Olszewski and J. Stoch, Phys. Chem. Chem. Phys., 2003, 5, 4631–4640 RSC.
- J. Y. Liu, J. L. Shi, D. H. He, Q. J. Zhang, X. H. Wu, Y. Liang and Q. M. Zhu, Appl. Catal., A, 2001, 218, 113–119 CrossRef CAS.
- A. Dandekar and M. A. Vannice, J. Catal., 1998, 178, 621–639 CrossRef CAS.
- A. G. Sato, D. P. Volanti, D. M. Meira, S. Damyanova, E. Longo and J. M. C. Bueno, J. Catal., 2013, 307, 1–17 CrossRef CAS.
- Y. F. Zhu, Y. L. Zhu, G. Q. Ding, S. H. Zhu, H. Y. Zheng and Y. W. Li, Appl. Catal., A, 2013, 468, 296–304 CrossRef CAS.
- S. Z. Chen, H. B. Zou, Z. L. Liu and W. M. Lin, Appl. Surf. Sci., 2009, 255, 6963–6967 CrossRef CAS.
- H. Du, C. T. Williams, A. D. Ebner and J. A. Ritter, Chem. Mater., 2010, 22, 3519–3526 CrossRef CAS.
- K. Pokrovski, K. T. Jung and A. T. Bell, Langmuir, 2001, 17, 4297–4303 CrossRef CAS.
- I. A. Fisher and A. T. Bell, J. Catal., 1997, 172, 222–237 CrossRef CAS.
- R. Q. Yang, Y. Zhang, Y. Iwama and N. Tsubaki, Appl. Catal., A, 2005, 288, 126–133 CrossRef CAS.
- K. A. Pokrovski, M. D. Rhodes and A. T. Bell, J. Catal., 2005, 235, 368–377 CrossRef CAS.
- S. Triwahyono, T. Yamada and H. Hattori, Appl. Catal., A, 2003, 242, 101–109 CrossRef CAS.
- R. W. Stevens, S. S. C. Chuang and B. H. Davis, Appl. Catal., A, 2003, 252, 57–74 CrossRef CAS.
- S. Triwahyono, A. A. Jalil and M. Musthofa, Appl. Catal., A, 2010, 372, 90–93 CrossRef CAS.
- X. M. Guo, D. S. Mao, G. Z. Lu, S. Wang and G. S. Wu, J. Catal., 2010, 271, 178–185 CrossRef CAS.
- G. Avgouropoulos, T. Ioannides and H. Matralis, Appl. Catal., B, 2005, 56, 87–93 CrossRef CAS.
- Q. Sun, Y. L. Zhang, H. Y. Chen, J. F. Deng, D. Wu and S. Y. Chen, J. Catal., 1997, 167, 92–105 CrossRef CAS.
- Q. L. Tang, Q. J. Hong and Z. P. Liu, J. Catal., 2009, 263, 114–122 CrossRef CAS.
- Y. F. Zhu, X. Kong, D. B. Cao, J. L. Cui, Y. L. Zhu and Y. W. Li, ACS Catal., 2014, 4, 3675–3681 CrossRef CAS.
- S. Arrii, F. Morfin, A. J. Renouprez and J. L. Rousset, J. Am. Chem. Soc., 2004, 126, 1199–1205 CrossRef CAS PubMed.
- Y. X. Yang, J. Evans, J. A. Rodriguez, M. G. Whitea and P. Liu, Phys. Chem. Chem. Phys., 2010, 12, 9909–9917 RSC.
- F. L. Liao, Y. Q. Huang, J. W. Ge, W. R. Zheng, K. Tedsree, P. Collier, X. L. Hong and S. C. Tsang, Angew. Chem., Int. Ed., 2011, 50, 2162–2165 CrossRef CAS PubMed.
- T. Witoon, J. Chalorngtham, P. Dumrongbunditkul, M. Chareonpanich and J. Limtrakul, Chem. Eng. J., 2016, 293, 327–336 CrossRef CAS.
- N. Kanjanasoontorn, T. Permsirivanich, T. Numpilai, T. Witoon, N. Chanlek, M. Niamlaem, C. Warakulwit and J. Limtrakul, Catal. Lett., 2016, 146, 1943–1955 CrossRef CAS.
- W. Wang, S. P. Wang, X. B. Ma and J. L. Gong, Chem. Soc. Rev., 2011, 40, 3703–3727 RSC.
- S. E. Collins, M. A. Baltanas and A. L. Bonivardi, J. Catal., 2004, 226, 410–421 CrossRef CAS.
- K. D. Jung and A. T. Bell, J. Catal., 2000, 193, 207–223 CrossRef CAS.
Footnote |
| † Electronic supplementary information (ESI) available. See DOI: 10.1039/c6ra28305e |
| This journal is © The Royal Society of Chemistry 2017 |