 Open Access Article
Thermoelectric enhancement in sliver tantalate via strain-induced band modification and chemical bond softening
Jun Li ab,
Zuju Ma
 b and
Kechen Wu*a
aState Key Laboratory of Structural Chemistry, Fujian Institute of Research on the Structure of Matter, Chinese Academy of Sciences, Fuzhou, Fujian 350002, People's Republic of China. E-mail: wkc@fjirsm.ac.cn
bUniversity of Chinese Academy of Sciences, Beijing 100049, People's Republic of China
First published on 26th January 2017
Abstract
The improvement of the thermoelectric performance (determined by the ZT value) of materials is limited by the inter-correlation of the transport coefficients. By performing first principle calculations combined with semi-classical Boltzmann theory, we have systematically investigated the geometric, electronic and thermoelectric properties of AgTaO3 under external strain. It is demonstrated that the electronic structure and phonon transport can be modified independently. Compressive strain along the c-axis decreases the energy separation between the light and heavy valence bands and generates multiple valence band valleys near the Fermi level. Such band structure modification greatly enhances the Seebeck coefficient for the p-type doped compound, which is increased from 600 μV K−1 (δc = 0%) to 690 μV K−1 (δc = −5%). Similarly, tensile strain softens the chemical bonding, favoring the reduction of thermal conductivity. Therefore, the improvement in the thermoelectric performance of AgTaO3 under strain suggests that strain engineering is a generally applicable route to enhancing the Seebeck coefficient and ZT in thermoelectric materials.
Introduction
Thermoelectric materials, which can directly convert heat into electricity and vice versa, are of great importance in the search for clean and renewable energy sources.1–4 The efficiency of thermoelectric materials is governed by the dimensionless thermoelectric figure of merit, ZT = S2σT/κ, where S is the Seebeck coefficient, σ is the electrical conductivity, T is the absolute temperature, and κ is the total thermal conductivity, consisting of lattice (κph) and electronic (κel) contributions. There is no known upper bound on ZT, but the current energy crisis has driven the pursuit of higher performance materials with ZT > 1 for commercial use.5,6 It is a challenging task to achieve high ZT values, since all the electronic parameters (σ, S and κel) are interrelated and their simultaneous optimization is difficult.Current approaches to improve the ZT value of thermoelectric materials can be classified into two categories: (i) enhancement of the electrical transport properties via modification of the band structure, such as distorting the lattice,7,8 doping with heteroatoms,9,10 or introducing quantum confinement effects;11–13 (ii) reduction of the thermal conductivity by introducing nano-structured components,14,15 layer structures,6,16 or alloying.17 The mechanism behind the band engineering strategy to increase ZT involves the enhancement of the Seebeck coefficient by introducing a resonant state at the edge of the band, or increasing the convergence of electronic band. The low thermal conductivity originates from the strengthened phonon scattering of low dimensional or the strong anharmonic materials. Furthermore, the phonon interactions are interlinked with the bonding character, namely, a weak chemical bonding interaction gives rise to low thermal conductivity due to the lower speed of sound.18,19 Inspired by the two aspects of improving the thermoelectric performance, another effective method is strain-engineering. As previously reported, the application of pressure or strain has been shown to be a promising strategy to modify electronic structure and phonon transport, and thus tune the thermoelectric properties. For example, the Seebeck coefficient can be significantly enhanced by strain induced band structure distortion or band convergence. Moreover, the thermal conductivity of some materials can be reduced by applying strain.20,21 Hence, it is interesting to study the effect of strain on electrical transport and thermal transport simultaneously, and thus the thermoelectric performance.
Oxide materials attract much attention as promising thermoelectric alternatives because of their advantages of nontoxicity and earth-abundance. For example, Zhang et al. reported that heavy doping22 and inducing 2D electron gas grain boundaries23,24 could enhance the thermoelectric performance of SrTiO3. Furthermore, layered cobaltates25–27 and BiCuSeO systems28,29 are expected to play important roles in thermoelectric applications due to their low thermal conductivity. Many oxide semiconductors with a primary structure of ABO3 have been shown to exhibit diverse physical properties such as superconductivity,30,31 optical transparency32,33 and photocatalytic activity,34,35 and have been reported to possess high mobility at room temperature. Tantalum oxide, AgTaO3, stands out amongst the multitudinous ABO3 type oxides due to its excellent carrier mobility.36 The TaO6 octahedral network contributes to high electrical mobility and a wide band gap, and has thus been attracting increasing attention in applications such as solar cells and even thermoelectric materials.37–39
In this work, based on first-principles calculations combined with semi-classical Boltzmann transport theory, we systematically investigate the effect of uniaxial strain on the geometric, electronic and thermoelectric properties of AgTaO3. It is revealed that the compressive c-axial strain can greatly enhance the Seebeck coefficient of p-type doped AgTaO3, by modulating the valence band character. In addition, the tensile strain can increase the bond lengths of Ta and O atoms, as well as the unit cell volume, which is beneficial for softening the chemical bonds. Furthermore, the tensile uniaxial strain improves the electrical conductivity of p-type doped AgTaO3. The weakened chemical bonding interaction under tensile strain tends to reduce the bulk modulus, which contributes to a reduction in thermal conductivity.
Computational details
Calculations in this work were performed within density functional theory (DFT), using the projector augment-wave (PAW) method40 incorporated in the Vienna Ab-initio Simulation Package (VASP).41,42 Generalized gradient approximation (GGA) with the Perdew–Burke–Ernzerhof (PBE) functional was used to describe the exchange–correlation interaction.43 A kinetic energy cutoff of 500 eV was selected for the plane wave expansion, and a Monkhorst–Pack k-point mesh of 6 × 6 × 4 was used to sample the irreducible Brillouin zone (IBZ) in the structural optimization and self-consistent calculation. The total energy convergence was set to be less than 0.1 meV between two steps. The lattice vectors and atomic positions were fully relaxed until the maximal Hellmann–Feynman forces acting on each atom were less than 0.001 eV A−1. It was found that the calculated electronic structure of AgTaO3 based on GGA/PBE, GGA/PW91 and LDA tends to be similar, and the band gap based on GGA (1.92 eV) is closer to the experimental value than that based on LDA (1.84 eV). Therefore, only the results obtained from GGA/PBE are shown. An exact band structure is of crucial importance for the accurate prediction of TE transport properties, because the Seebeck coefficient, electrical conductivity, and electronic contribution to the thermal conductivity depend on it. Therefore, a denser k-point grid of 21 × 21 × 9 was used for electronic structure calculation. The BoltzTrap program44 was employed to investigate the thermoelectric (TE) properties based on the analytical expressions of the electronic bands. The k-point mesh convergence test was performed to guarantee the accurate prediction of the TE properties.Results and discussion
Geometrical structure
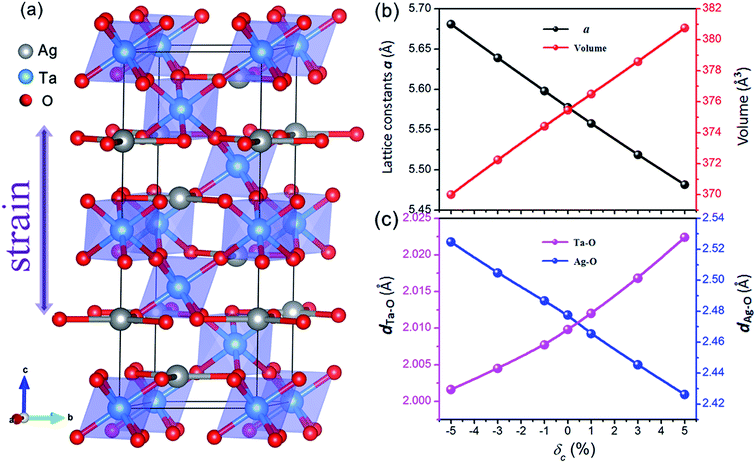
AgTaO3 crystallizes with a rhombohedral structure in the space group R![[3 with combining macron]](https://www.rsc.org/images/entities/char_0033_0304.gif) c, as shown in Fig. 1a. The three-dimensional framework is composed of interlinked corner-sharing TaO6 octahedra, represented by shading. In every octahedral structure, the Ta–O–Ta bonding angle is close to 180 degrees, which gives rise to the excellent carrier mobility of the AgTaO3 system. The lattice parameters of the relaxed cell of unstrained AgTaO3 are a = 5.58 Å and c = 13.94 Å, which are in agreement with the experimental results of a = 5.53 Å and c = 13.72 Å.45 Based on the equilibrium structure, external uniaxial strain along the c-axis is imposed. The strength of the c-axial strain is defined as δc = (c − c0)/c0 × 100%, where c and c0 are the lattice parameters along the z-direction with and without strain, respectively. Positive and negative δ corresponds to tensile and compressive strain, respectively, while δc = 0 means a strain-free case. The parameter a and all the atomic positions are fully relaxed by minimization of the total energy. The calculated independent elastic constants for both with and without strained compounds are all satisfied the Born–Huang stability criteria of a rhombohedral crystal.46
c, as shown in Fig. 1a. The three-dimensional framework is composed of interlinked corner-sharing TaO6 octahedra, represented by shading. In every octahedral structure, the Ta–O–Ta bonding angle is close to 180 degrees, which gives rise to the excellent carrier mobility of the AgTaO3 system. The lattice parameters of the relaxed cell of unstrained AgTaO3 are a = 5.58 Å and c = 13.94 Å, which are in agreement with the experimental results of a = 5.53 Å and c = 13.72 Å.45 Based on the equilibrium structure, external uniaxial strain along the c-axis is imposed. The strength of the c-axial strain is defined as δc = (c − c0)/c0 × 100%, where c and c0 are the lattice parameters along the z-direction with and without strain, respectively. Positive and negative δ corresponds to tensile and compressive strain, respectively, while δc = 0 means a strain-free case. The parameter a and all the atomic positions are fully relaxed by minimization of the total energy. The calculated independent elastic constants for both with and without strained compounds are all satisfied the Born–Huang stability criteria of a rhombohedral crystal.46
The effect of the c-axial strain on the lattice parameter a and unit cell volume are presented in Fig. 1b. The lattice parameter a decreases gradually with increasing c-axial strain from −5% to 5%, leading to a normal positive Poisson ratio, which is similar to most strained materials. As expected, the negative strain compresses the lattice volume, while the tensile strain expands it. The bond lengths of Ta–O and Ag–O exhibit a completely inverse dependence on the uniaxial strain, as shown in Fig. 1c. The Ta–O bond expands from 2.002 Å to 2.022 Å with an increase in strain from −5% to 5%, while the Ag–O bond shrinks from 2.525 Å to 2.426 Å. Nevertheless, all of the Ag–O bonds are parallel to the ab-plane and the Ta–O bonds organize the framework of AgTaO3, indicating that the Ta–O bond dominates the global bonding interaction. The expanded unit cell volume and Ta–O bond length under tensile strain account for the chemical bond weakening, which contributes to a reduction in the thermal conductivity.
Electronic structure
The transport properties of thermoelectric materials closely depend on the electronic states. The curvatures of the conduction and valence bands near the Fermi level determine the carrier transport, and thus affect the thermoelectric power and electrical conductivity. In order to understand the electronic characteristics of AgTaO3, the calculated band structure and density of states (DOS) are shown in Fig. 2. The calculated band gap of unstrained AgTaO3 is 1.92 eV, which is an underestimation compared to the experimental value of 3.4 eV,47 due to the well-known limitations of the GGA exchange functional. AgTaO3 is a direct band gap semiconductor with both the valence band maximum (VBM) and the conduction band minimum (CBM) located at the M point. It can be observed that the valence bands and conduction bands possess significantly different characteristics, indicating the different thermoelectric performances of p- and n-type doped AgTaO3. The flat bands near the VBM contribute to a heavy effective mass, giving rise to high thermoelectric power but small conductivity for p-type doping. In contrast, the high dispersive conduction band indicates a small effective mass near the CBM, which favors high electrical conductivity in n-type compounds. This phenomenon can be further demonstrated with the corresponding DOS. It can be found that the valence band consists predominately of a mixture of Ag-4d and O-2p states, while the conduction band is dominated mainly by Ta-5d states. Typically, thermoelectric materials with large Seebeck coefficients are usually associated with a large DOS near the band gap. Therefore, the higher DOS peak nearer the VBM than the CBM of AgTaO3 is indicative of a higher Seebeck coefficient for p-type doping than that for n-type doping.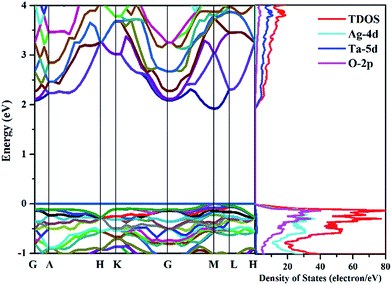 | ||
| Fig. 2 Band structures of optimized AgTaO3 (left) and the total and partial density of states (right). The energy zero is at the valence-band maximum. | ||
Now let us address the effect of the c-axial strain on the electronic structure. The band structure of AgTaO3 under compressive strain (δc = −5% and δc = −3%) and tensile strain (δc = 5% and δc = 3%) are plotted in Fig. 3, and that of the unstrained one (δc = 0) is also presented for comparison. For clarity, we respectively extracted and enlarged the details of the conduction band (Fig. 3a1–e1) and valence band (Fig. 3a2–e2) under different strains. In general, the response of the band structure to the compressive strain is stronger than that to the tensile strain, especially for the valence band. When compressive strain is imposed, the conduction band edge at the Γ point splits gradually, resulting in the CBM transfering from the M point to the Γ point (Fig. 3a1 and b1). Consequently, the energy band gap (Eg) remains almost unchanged under a strain of −3% but is greatly decreased at −5%, due to the transformation of the CBM. Therefore, the compressive strain can cause AgTaO3 to transform from a direct to an indirect semiconductor. The tensile strain does not turn the energy gap from direct to indirect, but decreases the Eg from 1.92 eV to 1.75 eV. However, when the tensile strain reaches 5%, the conduction band at the Γ point splits significantly, forming two similar band valleys at the Γ and M points (Fig. 3e1). For the valence band (Fig. 3a2–e2), the compressive strain modifies the valence band by reducing the energy offset between the light and heavy hole valence bands, forming a multiple-valley valence band near the Fermi energy level. Thus the compressive strain results in an improvement of the valence band degeneracy, which favors the enhancement of the Seebeck coefficient for p-type doping, as has been demonstrated for hole-doped SnSe by Zhao et al.48 The tensile strain enhances the band dispersion at the VBM by reducing the band energy of other symmetry points, which contributes to the enhancement of the electrical conductivity for p-type doping.
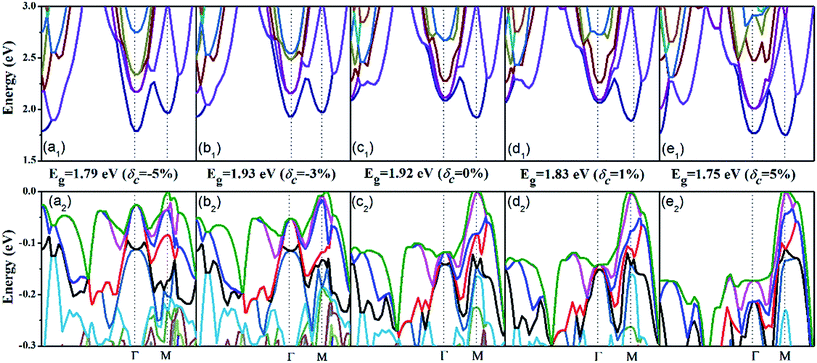 | ||
| Fig. 3 The electronic band structure under different stains: (a1–e1) the conduction band and (a2–e2) the valence band. | ||
To illustrate the effect of strain on the electronic structure near the Fermi level in more detail, we collected the total DOS of the valence band (from −0.25 eV to 0 eV) and the conduction band (from 1.70 eV to 2.20 eV) under strain as shown in Fig. 4, with the zero-energy point representing the respective VBMs. The asymmetric increase in the valence band density of states near the Fermi level is in accordance with the valence band degeneracy, giving rise to an increased Seebeck coefficient and power factor for p-type doping. However, although the tensile strain increases the density of states of the CBM, the magnitude of the value is not on par with the DOS value of the VBM. Hence, the Seebeck coefficient for n-type doping is weakly dependent on strain, except for when δc = −5%. Under the compressive strain of δc = −5%, the abnormal conduction DOS character induces an obvious decrease in the Seebeck coefficient, as depicted below.
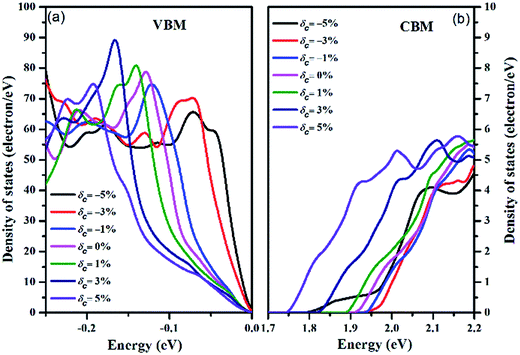 | ||
| Fig. 4 The density of states under different strains for the (a) VBM and (b) CBM. The Fermi energy level is shifted to 0 eV. | ||
Thermoelectric properties
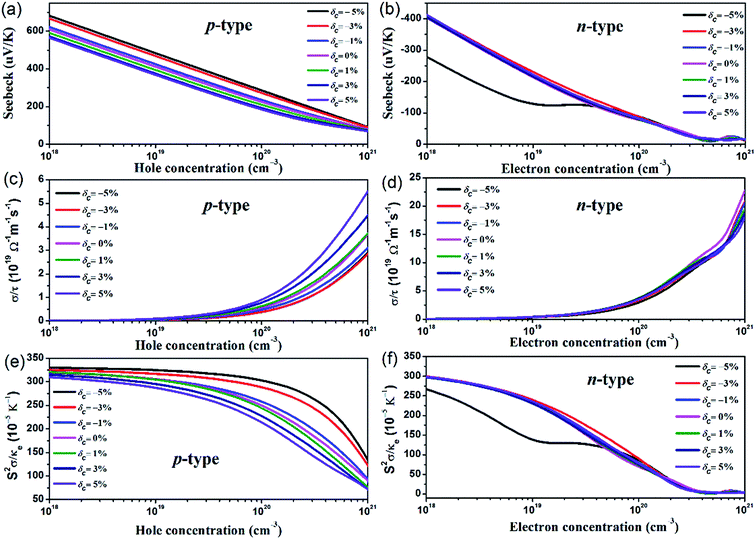
Based on the parameters from the calculated electronic structures, the thermoelectric properties of AgTaO3 can be calculated by solving the Boltzmann transport equation using the BolazTrap code. To examine the effect of uniaxial strain on the ability to produce a voltage from the temperature difference, the Seebeck coefficients of the p- and n-type doped compounds under different strains, as a function of hole and electron concentration at T = 300 K, are presented in Fig. 5a and b. It can be found that for both the p- and n-type doped compounds, the Seebeck coefficient exhibits a near linear decreasing trend with increasing carrier concentration. For p-type doping (Fig. 5a), the compressive strain brings an obvious enhancement to the Seebeck coefficient. With the hole concentration at 1018 cm−3, the Seebeck coefficient increases from 600 μV K−1 (δc = 0%) to 690 μV K−1 (δc = −5%). The remarkable enhancement originates from the multiple-valley valence band and the pronounced band asymmetry near the Fermi level induced by the compressive strain. For n-type doping, the Seebeck coefficient exhibits a weak dependence on the c-axial strain, except for the case of δc = −5%. At a small doping level with an electron concentration of lower than ∼4 × 1019 cm−3, a compressive strain of δc = −5% decreases the Seebeck coefficient significantly, which can be ascribed to the abnormal characteristics of the conduction band under these conditions. Comparing the two kinds of doping style, at the same hole doping and electron doping concentration, the Seebeck coefficient of p-type doped AgTaO3 is much higher than that of the n-type doped AgTaO3 due to the high valence band DOS peak, which manifests as improved thermoelectric properties of AgTaO3 as a p-type material.The directly obtained electrical conductivities from the BoltzTrap code are expressed as the ratio of the electrical conductivity (σ) to the scatting time τ, σ/τ. The constant scatting time approximation is always adopted when σ is calculated, thus the effect of strain on electrical conductivity can be demonstrated by the effect of strain on the value of σ/τ. As presented in Fig. 5c and d, the σ/τ value for both p- and n-type doped AgTaO3 increases with the hole and electron concentration increasing from 1018 cm−3 to 1021 cm−3. However, the small electron effective mass due to the light and high dispersive conduction band contributes to a large electrical conductivity value for n-type doped AgTaO3. For p-type doping, the value of σ/τ can be obviously enhanced by applying tensile strain but is decreased slightly under compressive strain. This can be easily explained using the electronic band structure under different strains: the valence band dispersion near the Fermi energy level is strengthened by the tensile strain, which produces a small hole effective mass, resulting in the enhancement of electrical conductivity for p-type doping. For n-type doping, similar to the Seebeck coefficient, the σ/τ is weakly sensitive to the uniaxial strain, as shown in Fig. 5d.
The Seebeck coefficient, electrical conductivity and electrical thermal conductivity are interlinked and determined by the electronic transport processes, thus the value of S2σ/κe is much better for discussing the thermoelectric properties, due to the absence of scattering time. Consequently, the effect of strain on the value of S2σ/κe for p-type and n-type doping as a function of strain is plotted in Fig. 5e and f. As described above, the effects of the carrier concentration on the Seebeck coefficient and the electrical conductivity are opposite. Accordingly, a compromise between S and σ should be taken into consideration, in order to obtain an optimized thermoelectric performance. For p-type doping, the S2σ/κe value monotonously increases with an increase in compressive strain, and this is more obvious at the heavy hole doping level. Contrarily, the tensile strain decreases the S2σ/κe value gradually, induced by the degenerated Seebeck coefficient. For n-type doping, the S2σ/κe value is nearly unaffected by the strain, except for the case of δc = −5%, due to the dramatic response of the Seebeck coefficient to the compressive strain of −5%.
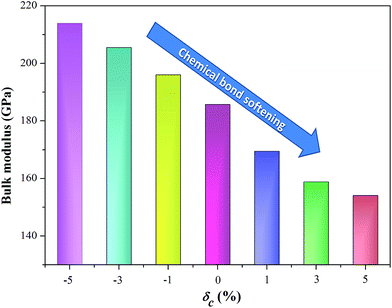
The transport parameters we discussed above describe all electronic function. Another important parameter that determines the thermoelectric performance is the lattice thermal conductivity, which depends on phonon transport. Phonon interactions are interlinked with the bonding character and strength. As mentioned when discussing the effect of strain on geometric structure, the unit cell volume expands under the c-axial tensile strain (as shown in Fig. 1b), which weakens the global chemical bonding interaction of AgTaO3. This can also be confirmed from the simulated bulk modulus of a compound under uniaxial strain, as visualized in Fig. 6. The bulk modulus decreases with an increase in the c-axial strain from −5% to 5%, which is considered to be due to the gradual softening of the bonds under the rising tensile strain. The bond softening, i.e. the chemical bond interaction weakening, usually means a low phonon velocity which causes strong phonon scatterings, leading to reduced thermal conductivity.
Conclusions
In summary, we systematically investigated the effect of strain on the geometric, electronic, and p-type/n-type doped thermoelectric properties of AgTaO3. The results show that strain engineering can modify the electronic transport and phonon transport independently, which is expected to be an effective way to improve the thermoelectric performance. The compressive strain leads to the degeneracy of the valence band and increases the density of states of the VBM, giving rise to the enhancement of the Seebeck coefficient and power factor for p-type doping. The tensile strain enlarges the volume of the unit cell and decreases the bulk modulus of AgTaO3, which induces bond softening. The weakened chemical bonding interaction is favorable to phonon softening, which is conducive to the reduction of thermal conductivity. The present study offers hints that the thermoelectric performance of AgTaO3 can be enhanced by applying external strain.Acknowledgements
This work was supported by the National Science Foundation of China (No. 21501177). We acknowledge the Supercomputing Center of CNIC and Special Program for Applied Research on Super Computation of the National Science Foundation of China-Guangdong Joint Fund (the second phase) for providing the computer resources.References
- R. Venkatasubramanian, E. Siivola, T. Colpitts and B. O'Quinn, Nature, 2001, 413, 597–602 CrossRef CAS PubMed.
- G. J. Snyder and E. S. Toberer, Nat. Mater., 2008, 7, 105–114 CrossRef CAS PubMed.
- S.-J. Kim, J.-H. We and B.-J. Cho, Energy Environ. Sci., 2014, 7, 1959–1965 CAS.
- G. Tan, L.-D. Zhao and M. G. Kanatzidis, Chem. Rev., 2016, 116, 12123–12149 CrossRef CAS PubMed.
- H.-J. Wu, L.-D. Zhao, F.-S. Zheng, D. Wu, Y.-L. Pei, X. Tong, M. G. Kanatzidis and J.-Q. He, Nat. Commun., 2014, 5, 4515 CAS.
- L.-D. Zhao, S.-H. Lo, Y.-S. Zhang, H. Sun, G.-J. Tan, C. Uher, C. Wolverton, V. P. Dravid and M. G. Kanatzidis, Nature, 2014, 508, 373–377 CrossRef CAS PubMed.
- J. P. Heremans, V. Jovovic, E. S. Toberer, A. Saramat, K. Kurosaki, A. Charoenphakdee, S. Yamanaka and G. J. Snyder, Science, 2008, 321, 554–557 CrossRef CAS PubMed.
- W. Liu, X.-J. Tan, K. Yin, H.-J. Liu, X.-F. Tang, J. Shi, Q.-J. Zhang and C. Uher, Phys. Rev. Lett., 2012, 108, 166601 CrossRef PubMed.
- Y.-B. Luo, J.-Y. Yang, M. Liu, Y. Xiao, L.-W. Fu, W.-X. Li, D. Zhang, M.-Y. Zhang and Y.-D. Cheng, J. Mater. Chem. A, 2015, 3, 1251–1257 CAS.
- J.-S. Rhyee, K.-H. Ahn, K.-H. Lee, H.-S. Ji and J.-H. Shim, Adv. Mater., 2011, 23, 2191–2194 CrossRef CAS PubMed.
- L. Hicks and M. Dresselhaus, Phys. Rev. B: Condens. Matter Mater. Phys., 1993, 47, 16631–16634 CrossRef CAS.
- L. D. Hicks and M. S. Dresselhaus, Phys. Rev. B: Condens. Matter Mater. Phys., 1993, 47, 12727–12731 CrossRef CAS.
- Y. Tian, M. R. Sakr, J. M. Kinder, D. Liang, M. J. MacDonald, R. L. J. Qiu, H.-J. Gao and X. P. A. Gao, Nano Lett., 2012, 12, 6492–6497 CrossRef CAS PubMed.
- W. Kim, J. Zide, A. Gossard, D. Klenov, S. Stemmer, A. Shakouri and A. Majumdar, Phys. Rev. Lett., 2006, 96, 045901 CrossRef PubMed.
- X. Huang, C. Zhi, P. Jiang, D. Golberg, Y. Bando and T. Tanaka, Adv. Funct. Mater., 2013, 23, 1824–1831 CrossRef CAS.
- C. Chiritescu, D. G. Cahill, N. Nguyen, D. Johnson, A. Bodapati, P. Keblinski and P. Zschack, Science, 2007, 315, 351–353 CrossRef CAS PubMed.
- D. M. Rowe, V. S. Shukla and N. Savvides, Nature, 1981, 290, 765–766 CrossRef CAS.
- S. Wang, Y. Sun, J. Yang, B. Duan, L. Wu, W. Zhang and J. Yang, Energy Environ. Sci., 2016, 9, 3436–3447 CAS.
- P. Ying, X. Li, Y. Wang, J. Yang, C. Fu, W. Zhang, X. Zhao and T. Zhu, Adv. Funct. Mater., 2016, 27, 1604145 CrossRef.
- Q.-X. Pei, Y.-W. Zhang, Z.-D. Sha and V. B. Shenoy, J. Appl. Phys., 2013, 114, 033526 CrossRef.
- L.-Y. Zhu, T.-T. Zhang, Z.-M. Sun, J.-H. Li, G.-B. Chen and S. A. Yang, Nanotechnology, 2015, 26, 465707 CrossRef PubMed.
- R.-Z. Zhang, C.-L. Wang, J.-C. Li, W.-B. Su, J.-L. Zhang, M.-L. Zhao, J. Liu, Y.-F. Zhang and L.-M. Mei, Solid State Sci., 2010, 12, 1168–1172 CrossRef CAS.
- R.-Z. Zhang, C.-L. Wang, J.-C. Li and K. Koumoto, J. Am. Ceram. Soc., 2010, 93, 1677–1681 CAS.
- R.-Z. Zhang and K. Koumoto, J. Electron. Mater., 2013, 42, 1568–1572 CrossRef CAS.
- A. Maignan, S. Hebert, D. Pelloquin, C. Michel and J. Hejtmanek, J. Appl. Phys., 2002, 92, 1964–1967 CrossRef CAS.
- D. O. Demchenko and D. B. Ameen, Comput. Mater. Sci., 2014, 82, 219–225 CrossRef CAS.
- K. Takahata, Y. Iguchi, D. Tanaka, T. Itoh and I. Terasaki, Phys. Rev. B: Condens. Matter Mater. Phys., 2000, 61, 12551 CrossRef CAS.
- L.-D. Zhao, J. He, D. Berardan, Y. Lin, J.-F. Li, C.-W. Nan and N. Dragoe, Energy Environ. Sci., 2014, 7, 2900–2924 CAS.
- J.-H. Sui, J. Li, J.-Q. He, Y.-L. Pei, D. Berardan, H.-J. Wu, N. Dragoe, W. Cai and L.-D. Zhao, Energy Environ. Sci., 2013, 6, 2916–2920 CAS.
- M. H. K. Rubel, A. Miura, T. Takei, N. Kumada, M. M. Ali, M. Nagao, S. Watauchi, I. Tanaka, K. Oka, M. Azuma, E. Magome, C. Moriyoshi, Y. Kuroiwa and A. K. M. A. Islam, Angew. Chem., Int. Ed., 2014, 53, 3599–3603 CrossRef CAS PubMed.
- M. H. K. Rubel, T. Takei, N. Kumada, M. M. Ali, A. Miura, K. Tadanaga, K. Oka, M. Azuma, M. Yashima, K. Fujii, E. Magome, C. Moriyoshi, Y. Kuroiwa, J. R. Hester and M. Aydeev, Chem. Mater., 2016, 28, 459–465 CrossRef CAS.
- S. De Wolf, J. Holovsky, S.-J. Moon, P. Loper, B. Niesen, M. Ledinsky, F.-J. Haug, J.-H. Yum and C. Ballif, J. Phys. Chem. Lett., 2014, 5, 1035–1039 CrossRef CAS PubMed.
- J. Zhu, Z. Xia, Y. Zhang, M. S. Molokeev and Q. Liu, Dalton Trans., 2015, 44, 18536–18543 RSC.
- R. Asai, H. Nemoto, Q. Jia, K. Saito, A. Iwase and A. Kudo, Chem. Commun., 2014, 50, 2543–2546 RSC.
- C. Clavero, Nat. Photonics, 2014, 8, 95–103 CrossRef CAS.
- M. Wiegel, M. H. J. Emond, E. R. Stobbe and G. Blasse, J. Phys. Chem. Solids, 1994, 55, 773–778 CrossRef CAS.
- H. Kato, H. Kobayashi and A. Kudo, J. Phys. Chem. B, 2002, 106, 12441–12447 CrossRef CAS.
- J.-T. Li and N.-Q. Wu, Catal. Sci. Technol., 2015, 5, 1360–1384 CAS.
- A. Mahmood, S. M. Ramay, H. M. Rafique, Y. Al-Zaghayer and S. U. D. Khan, Mod. Phys. Lett. B, 2014, 28, 1450077 CrossRef.
- P. E. Blöchl, Phys. Rev. B: Condens. Matter Mater. Phys., 1994, 50, 17953–17979 CrossRef.
- G. Kresse and J. Furthmüller, Phys. Rev. B: Condens. Matter Mater. Phys., 1996, 54, 11169–11186 CrossRef CAS.
- G. Kresse and D. Joubert, Phys. Rev. B: Condens. Matter Mater. Phys., 1999, 59, 1758 CrossRef CAS.
- J. P. Perdew, K. Burke and M. Ernzerhof, Phys. Rev. Lett., 1996, 77, 3865–3868 CrossRef CAS PubMed.
- G. K. H. Madsen and D. J. Singh, Comput. Phys. Commun., 2006, 175, 67–71 CrossRef CAS.
- M. Wolcyrz and M. Lukaszewski, Z. Kristallogr., 1986, 177, 53–58 CrossRef CAS.
- M. Born and K. Huang, Dynamical theory of crystal lattices, Oxford university press, 1998 Search PubMed.
- H. Kato, H. Kobayashi and A. Kudo, J. Phys. Chem. B, 2002, 106, 12441–12447 CrossRef CAS.
- L.-D. Zhao, G.-J. Tan, S.-Q. Hao, J.-Q. He, Y.-L. Pei, H. Chi, H. Wang, S.-K. Gong, H.-B. Xu, V. P. Dravid, C. Uher, G. J. Snyder, C. Wolverton and M. G. Kanatzidis, Science, 2016, 351, 141–144 CrossRef CAS PubMed.
| This journal is © The Royal Society of Chemistry 2017 |

