DOI:
10.1039/C6RA28287C
(Paper)
RSC Adv., 2017,
7, 12812-12823
Removal of ammonia from aqueous solutions by ligand exchange onto a Cu(II)-loaded chelating resin: kinetics, equilibrium and thermodynamics
Received
16th December 2016
, Accepted 12th February 2017
First published on 23rd February 2017
Abstract
A poly ligand exchanger (PLE), Cu(II)-loaded chelating resin (ammonia adsorption reagent, named AMAR) was prepared to efficiently remove ammonia from solutions by ligand exchange. The kinetics, equilibrium and thermodynamics of the ligand sorption of ammonia onto AMAR from the synthesized solution were investigated under different experimental conditions. AMAR was characterized using FT-IR and a Micromeritics ASAP2020 surface area and porosity analyzer. The FT-IR analysis and pore textural property studies verified the functional group of weak iminodiacetate acid and reveal the combination form of Cu(II) with AMAR. The batch experiments with respect to different solution pHs, temperatures, initial ammonia concentrations and contact times were investigated. The equilibrium sorption experiments suggested that the optimum pH for ammonia adsorption was 9.5. The ammonia adsorption capacity on AMAR increased with the increase of contact time and initial ammonia concentration and decreased with the increase of temperature. The Langmuir (R2 > 0.99) isotherm model was the best fitted model compared with the Freundlich model (R2 > 0.91). The kinetic data were fitted well with the pseudo-second-order model compared with the pseudo-first-order and intra-particle models. The kinetic data confirmed that particle diffusion is not the only rate-limiting step in the adsorption process. The adsorption process might be affected by a variety of mechanisms. The maximum adsorption capacity was 42.735 mg g−1, indicating that AMAR was a promising and efficient ammonia adsorption reagent.
1. Introduction
Ammonia is the most commonly occurring nitrogenous pollutant in wastewater and is widely derived from sewage, agricultural and industrial sources.1–3 The excess emission of ammonia into ecosystems can cause severe environmental problems such as eutrophication and algal bloom.4 A maximum ammonia concentration of 21 μg L−1 NH3–N was considered to be protective for most marine fish and estuarine fish as the threshold value despite the influence of changes in pH, salinity and temperature.5 Complete removal of ammonia was inevitable to meet the increasingly strict wastewater discharge standards, especially in developed countries such as China. The removal of ammonia from solutions has been the core problem. Researchers have paid much attention to technologies for ammonia removal. Various methods, such as air-stripping,6–8 biological processes,9–11 breakpoint chlorination,12,13 chemical precipitation14,15 and ion exchange,1,16–18 have been used to remove ammonia from domestic and industrial wastewater.19 Among these listed technologies, the adsorption method is considered as a promising technology for the treatment of ammonia-containing wastewater because of its simple and effective process, lower operating cost and economical and practical property.20 The conventional adsorbents were various zeolites (such as naturally occurring zeolite, clinoptilolite, mordenite21,22), activated carbon,23–26 bentonite,27 sepiolite,28 fly ash and synthetic organic ion resin.29,30 While the adsorption capacities of these adsorbents for ammonia removal are relatively low and all the materials require a secondary treatment, which increases the adsorption process cost.
Ligand exchange technology was virginally proposed by Helfferich in 1962 to improve the selectivity of the ion exchanger towards NH4+.31 Complex metal ions, such as Cu2+, Ni2+, Ag+, Zn2+, Co3+, and Fe3+ were loaded onto an ion exchanger, and the potential ligands were adsorbed from solutions or gases through the formation of complexes with the metal in the exchanger (“ligand sorption”) or through the displacement of other transition metals (“ligand exchange”). The transition metal plays an end functional group in the PLE. The reaction of transition metal with the potential ligands is a strong and unique combination. This binding force of complexation is generally stronger than the traditional physical adsorption or ion exchange for the unique structure of metal–ligand complex. The metal–ligand complex also provides a driving force for the ligand exchange resin to efficiently eliminate interference of non-ligands, thus the potential ligands could selectively adsorbed to the resin.
Currently, ligand exchange technologies are mainly used for removing anions (F−, HAsO3− and PO43−) or organic neutral ligands (amine and phenols) in solutions.29,32–36 Very few researchers have reported using ligand exchange technology to remove ammonia from domestic or industrial water.37 Groves F. R.38 treated the 150 mg L−1 ammonia wastewater using ligand exchange method. The analysis results showed that the ligand exchange technology was a competitive method for ammonia removal compared with the traditional ion exchange. Yoshida and T. Kataoka39 investigated the adsorption properties of ammonia and amine using H+ form and Cu2+ form strong acidic ion-exchange resin. The results showed that the selectivity of H+ form resin was considerable high and higher than that of Cu2+ form. In Cu2+ form and monoethanolamine system, Cu2+ was eluted by the amine. Helfferich formulated a thermodynamic equilibrium equation for ligand adsorption that could predict the complex stability constant for ammonia removal and proposed loading Amberlite IRC-50 with Cu2+, Ni2+, Ag+, Zn2+ to verify the equation.31 In addition, Mustafa40 observed that Amberlite IRC-50 loaded with Cu2+, Ni2+, and Zn2+ served as a ligand exchanger. However, the adsorption properties and other operating conditions of the Amberlite IRC-50 were not described. In ligand separation field, the high-concentration ammonia was commonly used as the eluent to exchange other ligands (organic molecules such as amines or amino acids) in ligand exchange resin. Typical “ligand exchange” reactions can be described as follows:
| |
 | (1) |
In our previous work, we have investigated the effect of completion ions and causticization and the ammonia adsorption properties on AMAR.41,42 In this paper, a novel ammonia adsorbent, Cu(II)-loaded chelating resin (AMAR), is prepared for the removal of ammonia from aqueous solutions. Batch mode experiments were performed for the ammonia removal on AMAR to investigate the optimum adsorption conditions. The chemical structure and pore textural properties were determined. The possible adsorption mechanisms were also explored using isotherm equations, thermodynamic investigations and kinetic models.
2. Materials and methods
2.1 Materials and apparatus
All sorption and ion-exchange reactions were performed using an anion exchange resin purchased from Shanghai Huizhu Resin Co., Ltd., China. The virgin resin is a standard, spherical, microporous chelating resin in Na+ form that can be functionalized by reactions with iminodiacetate groups. The resin's physical properties and specifications as reported by the suppliers are shown in Table 1. All chemical reagents, such as sodium hydroxide, sodium chloride, ammonium chloride calcium chloride, stronger ammonia water and hydrochloric acid were analytical reagent grade and were used as received. The virginal resin was modified by a copper solution prepared using analytical-grade CuSO4·5H2O. Deionized water with a minimum resistivity of 18 MΩ was used throughout the experiment. The resin after loading with copper was a blue spherical particle named AMAR.
Table 1 Physical properties and specifications of virgin resin
| Matrix |
Styrene-divinylbenzene |
| Functional group |
Iminodiacetate |
| Structure |
Macroporous |
| pH range |
0–14 |
| Ion type |
Na+ form |
| Particle size (0.4–1.25 mm) |
≥95% |
| Loading density |
760 kg m−3 |
| Coefficient of uniformity |
≤1.6 |
| Wet superficial density |
0.72–0.76 g mL−1 |
| Wet density |
1.10–1.16 g mL−1 |
| Loading density (wet) |
0.6 mL mL−1 |
| Volume total exchange capacity |
≥1.8 mmol mL−1 |
The pH of the solutions was measured using a Mettler Toledo 320 pH Meter (Mettler Toledo co., Ltd, China). The resin was dried in a 101 electric blast-drying oven. The ammonia and Cu2+ concentrations were determined by using Nessler reagent and copper reagent (diethylamine dithiosododiumformate) with a VIS-7220 Spectrophotometer (Beijing Rayleigh Analytical Instrument Corporation (BRAIC), China). The resins that were immersed in different solutions were all shaken in a SHZ-82A water-bath constant temperature oscillator (WCTO) (Jiangsu Jintan Medical Instrument Co., Ltd., China).
2.2 Preparation of adsorbent
To remove surface dust and clean the resin, a known amount of virgin resin was washed repeatedly with deionized water prior to pretreatment.43 To convert the resin to AMAR, a certain amount of chelating resin was packed into an ion exchange column. A saturated concentration of CuSO4 solution was passed slowly through the ion exchange column until the effluent had the same copper concentration as the initial solution to ensure that the Cu(II)-loaded resin was saturated. Then, the resin was washed repeatedly with deionized water until the effluent copper concentration was below 0.5 mg L−1 to confirm that no Cu(II) leakage occurred. The Cu(II)-loaded resin was dewatered by pressing gently between two pieces of filter paper, and then dried in an oven at 323 K for 48 h.
2.3 Characterization of AMAR
The specific surface area and pore volume of AMAR were determined by N2 adsorption–desorption isotherms at 77 K using a Micromeritics ASAP2020 surface area and porosity analyzer (Quantachrome, American). The samples were outgassed for more than 12 h in a vacuum drying oven at 353 K prior to the adsorption measurement. The pore distributions and pore volume were constructed using the adsorption branch of the N2 isotherms based on the BJH model. The specific surface area was calculated on the basis of the BET (Brunauer, Emmett and Teller) equation. Cu(II) bounded to the AMAR resin by digesting the Cu(II)-loaded resin using strong HCl solution and analyzed by using an atomic adsorption spectrophotometer (Hitachi Zeeman Z-8200, Japan). The detecting limit of copper was 0.05 mg L−1. The Fourier transform infrared spectra of sample before and after adsorption were obtained from a Nexus 870 FTIR spectrometer (Thermo Nicolet Company, USA).
2.4 Equilibrium studies
The adsorption experiments were performed according to the batch method. Effect of initial pH was determined keeping the other variables (resin dosage 1 g, initial ammonia concentration 200 mg L−1) constant. In the equilibrium experiments, 100 mL of simulated solutions with the initial ammonia concentrations of 200 mg L−1 were added into flasks. A selected amount of ammonium chloride was used to prepare the simulated ammonia wastewater of different concentrations (10, 20, 50, 100, 200, 500, 1000, 2000, 3000, 4000 mg L−1). The dried resin was fixed to 1 g. The flasks were sealed and shaken in a WCTO at 200 rpm and 298 K for 24 h to reach the adsorption equilibrium. pH adjustments were made by using 0.1 mol L−1 sodium hydroxide and 0.1 mol L−1 hydrochloric acid. The ammonia removal efficiency (%) was calculated according to the following eqn (2). The equilibrium adsorption capacity of ammonia was calculated according to eqn (3).| |
 | (2) |
| |
 | (3) |
Here, R is the ammonia removal efficiency (%). C0 and Ce are initial and equilibrium concentrations of ammonia in solutions (mg L−1). V is the volume of solution (L), m is the mass of resin used in the equilibrium experiment (g), qe is the equilibrium adsorption capacity (mg g−1).
2.5 Isotherm studies
All the adsorption isotherm studies were carried out in a series of temperature ranging from 288–333 K. Each part of the dried AMAR resin was fixed to 1 g. The simulated ammonia wastewater of 200 mg L−1 mixing with 1 g AMAR was sealed and shaken in a WCTO at 200 rpm for 24 h to reach the adsorption equilibrium. The solution pH was adjusted to the optimum adsorption pH with 1 mol L−1 NaOH and 1 mol L−1 HCl. The corresponding shaken temperatures of WCTO were adjusted to 288 K, 298 K, 308 K, 318 K and 333 K.
2.6 Kinetic studies
Kinetic studies were performed by using 100 mL of simulated wastewater. The solution pH was adjusted to the deserved value by adding 1 mol L−1 NaOH and 1 mol L−1 HCl into the mixtures of AMAR and working solutions. The flasks were sealed and shaken at 200 rpm and 298 K for a comparatively long time. Samples were extracted at a certain time intervals (10, 20, 30, 60, 120, 240, 360, 480 and 600 min). Ammonia concentrations were determined by VIS-7220 Spectrophotometer at the visible light wavelength of 420 nm. The corresponding ammonia adsorption capacities at different equilibrium t (min) were calculated with eqn (4).| |
 | (4) |
Here qt (mg g−1) is the adsorption capacity at constant time t and Ct is the ammonia concentration at constant time t (mg L−1).
3. Results and discussions
3.1 FT-IR analysis
FTIR analysis was performed in order to identify the functional groups of AMAR before and after ammonia adsorption. The FT-IR spectra of (a) AMAR after adsorption, (b) AMAR and (c) virgin resin are shown in Fig. 1. The information changes between the virgin resin and the copper loaded resin AMAR was given in Fig. 1 to partly reveal the adsorption mechanism. The spectrum of virgin resin showed peaks at 3412 cm−1 assigned to –OH stretching vibration of hydroxyl groups; the band at 1589 cm−1 was the C![[double bond, length as m-dash]](https://www.rsc.org/images/entities/char_e001.gif) O symmetric stretching vibration of carboxylic acid groups of the virgin resin;44,45 the peak at 2921 cm−1 is attributed to the symmetric and asymmetric C–H stretching vibration of –CH2 and –CH3 groups;46 2348 cm−1 attributed the characteristic peak of –NH2. 1405 cm−1 assigned to bending vibrations of –OH. After loading copper, the band at 1384 cm−1 was the C
O symmetric stretching vibration of carboxylic acid groups of the virgin resin;44,45 the peak at 2921 cm−1 is attributed to the symmetric and asymmetric C–H stretching vibration of –CH2 and –CH3 groups;46 2348 cm−1 attributed the characteristic peak of –NH2. 1405 cm−1 assigned to bending vibrations of –OH. After loading copper, the band at 1384 cm−1 was the C![[double bond, length as m-dash]](https://www.rsc.org/images/entities/char_e001.gif) O asymmetric stretching vibration of carboxylic acid groups of AMAR. The intensity of –OH was weakened after loading copper and adsorption process. The –OH peak at 3412 cm−1 was slightly shifted to 3420 cm−1 (AMAR) and 3416 cm−1 (AMAR after adsorption). The C
O asymmetric stretching vibration of carboxylic acid groups of AMAR. The intensity of –OH was weakened after loading copper and adsorption process. The –OH peak at 3412 cm−1 was slightly shifted to 3420 cm−1 (AMAR) and 3416 cm−1 (AMAR after adsorption). The C![[double bond, length as m-dash]](https://www.rsc.org/images/entities/char_e001.gif) O peak was shifted from 1589 cm−1 (origin resin) to 1616 cm−1 (AMAR) and 1616 cm−1 (AMAR after adsorption). The intensity of C
O peak was shifted from 1589 cm−1 (origin resin) to 1616 cm−1 (AMAR) and 1616 cm−1 (AMAR after adsorption). The intensity of C![[double bond, length as m-dash]](https://www.rsc.org/images/entities/char_e001.gif) O was weakened after loading with copper. These findings suggested that the hydrogen and oxygen atoms in the –OH and were involved in the copper adsorption. The loaded copper in AMAR may form coordinate covalent bond with –COOH in the virgin resin. After copper loading, the peak of –NH2 at 2348 cm−1 was disappeared in AMAR. While, the peak of –NH2 was appeared at 2348 cm−1 with a weaker intensity. These results indicated that –NH2 may be involved with the adsorption process as well as the copper-loading process. The schema of the listed forms of complexes was shown in Fig. 2. Transition metals can form complexes with carboxylate in three forms, which are monodentate complexes, bidentate complexes and bridge complexes. The virgin resin and AMAR showed peaks of C
O was weakened after loading with copper. These findings suggested that the hydrogen and oxygen atoms in the –OH and were involved in the copper adsorption. The loaded copper in AMAR may form coordinate covalent bond with –COOH in the virgin resin. After copper loading, the peak of –NH2 at 2348 cm−1 was disappeared in AMAR. While, the peak of –NH2 was appeared at 2348 cm−1 with a weaker intensity. These results indicated that –NH2 may be involved with the adsorption process as well as the copper-loading process. The schema of the listed forms of complexes was shown in Fig. 2. Transition metals can form complexes with carboxylate in three forms, which are monodentate complexes, bidentate complexes and bridge complexes. The virgin resin and AMAR showed peaks of C![[double bond, length as m-dash]](https://www.rsc.org/images/entities/char_e001.gif) O symmetric stretching vibration of carboxylic acid groups at 1589 cm−1 and 1616 cm−1 and ΔV = 27 cm−1 (ΔV < 200 cm−1), which suggests that the Na+ in the resins exchanges with the copper ions in solutions and forms coordinate covalent bond with –COOH.
O symmetric stretching vibration of carboxylic acid groups at 1589 cm−1 and 1616 cm−1 and ΔV = 27 cm−1 (ΔV < 200 cm−1), which suggests that the Na+ in the resins exchanges with the copper ions in solutions and forms coordinate covalent bond with –COOH.
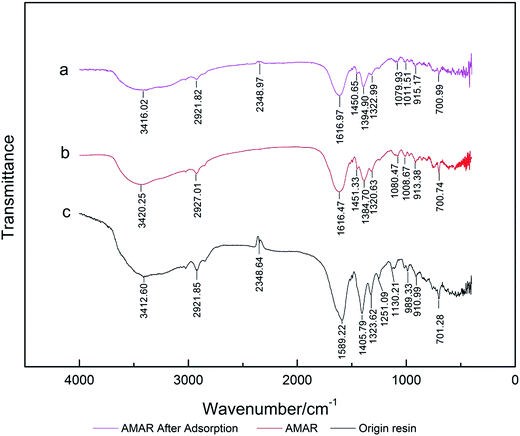 |
| | Fig. 1 FT-IR spectra of (a) AMAR after adsorption, (b) AMAR and (c) virgin resin. | |
 |
| | Fig. 2 Schema of metal–carboxylate complexes. | |
3.2 Pore textural properties
The nitrogen adsorption and desorption isotherms on the virgin resin, AMAR and saturated AMAR resin and the pore size distribution of the listed resin were measured at 77 K are plotted in Fig. 3 and 4 respectively. The pore textural properties are summarized in Table 1. The pore textural properties including the BET specific surface area, Barrett–Joyner–Halenda (BJH) average pore diameter and cumulative pore volume for all the samples are calculated using the built-in software of ASAP 2020 (Table 2).
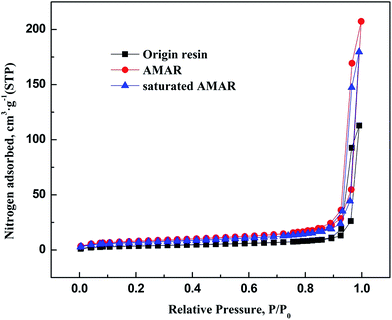 |
| | Fig. 3 N2 adsorption and desorption isotherms of origin resin, AMAR and saturated AMAR. | |
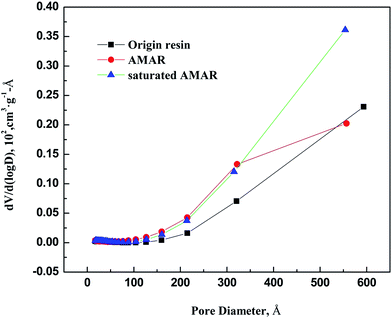 |
| | Fig. 4 Pore diameter distribution of origin resin, AMAR and saturated AMAR. | |
Table 2 The calculated structural parameters of the virgin resin, AMAR and saturated AMAR by ASAP 2020
| |
Virgin resin |
AMAR |
Saturated AMAR |
| BET surface area (m2 g−1) |
13.60 |
28.47 |
24.71 |
| t-Plot micropore surface area (m2 g−1) |
2.54 |
4.31 |
5.07 |
| Pore volume (cm3 g−1) |
10.17 |
10.32 |
10.27 |
| t-Plot micropore volume (cm3 g−1) |
0.0012 |
0.0013 |
0.0023 |
| Average pore width (nm) |
513.10 |
450.78 |
449.73 |
As depicted in Fig. 3, the nitrogen adsorption and desorption isotherms of the three resins exhibited typical type IV with H1 hysteresis loop according to IUPAC classification.47 The initial part of the type IV is attributed to monolayer–multilayer adsorption according to J. Nawrocki.48 This H1 hysteresis loop probably arises from the agglomerates loading to narrow pore size distribution. The pore textural properties such as the BET surface area, t-plot micropore surface area, pore volume are summarized in Table 2. As shown in Fig. 4, the corresponding pore size distribution of the tested resins was wide. The corresponding average pore width of the origin resin, AMAR and the saturated AMAR were 513.10 nm, 450.78 nm and 449.73 nm, which explained the relatively small BET surface area (m2 g−1) of the origin resin (13.60 m2 g−1), AMAR (28.47 m2 g−1) and saturated AMAR (24.71 m2 g−1). The BET surface area of the resin was increased after copper loading to the resin. The pore volume of the virgin resin (10.17 cm3 g−1) slightly increased compared with AMAR (10.32 cm3 g−1) and saturated AMAR (10.27 cm3 g−1). The pore textural parameters including the BET surface area, t-plot micropore volume and pore volume of the virgin resin were all smaller than the copper loaded resin AMAR and the saturated AMAR. This changing of the pore textural properties could be interpreted by the formation of bridge complex between transition metals and the iminodiacetate moieties. Parts of the pores were occupied with metals and made the pores shrink.49
3.3 Effect of pH
As previously reported, ammonia in solution exists in two forms, un-ionized (NH3) and ionized (NH4+).50 Solution pH is a critical factor in the sorption process, affecting not only the ratio of the two forms but also the surface charge of absorbents.51,52 Many studies have proved the importance of solution pH as one of the critical control parameters in the adsorption process, especially in ammonia adsorption.53–56 The solution pH had an important influence on the equilibrium ammonia concentration and the ammonia removal efficiency. The effect of solution pH on the ammonia adsorption on AMAR were shown in Fig. 5. At a pH lower than 7, the equilibrium ammonia concentration decreased at an increasing rate. The ammonia removal efficiency increased with the increasing of solution pH but was lower than 10%. As the solution pH increased from 7 to 9.5, the equilibrium ammonia concentrations decreased sharply with the increasing of pH. The ammonia removal efficiency significantly increased from 19.4% (pH = 7) to 91.6% (pH = 9.31). When the solution pH was higher than 9.5, the removal efficiency decreased as the pH increased. There existed two forms of ammonia, un-ionized (NH3) and ionized (NH4+), in the aqueous solutions.50 The ratio of the two forms of ammonia changes with the changing of solution pH and temperature.57 The two forms of ammonia follow the equation:58| | |
NH4+ + OH− ↔ +NH3 + H2O, Kb = 1.8 × 10⁻⁵
| (5) |
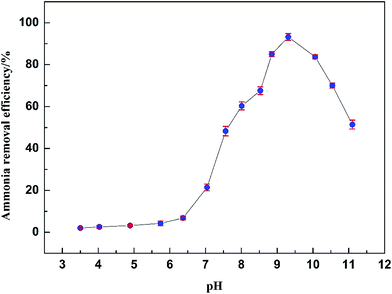 |
| | Fig. 5 Effect of pH on the adsorption of ammonia on AMAR. | |
(I) At a pH lower than 7, ammonia exists as stable ionized NH4+.
(II) As the solution pH increases to 7–9.5, NH4+ is gradually converted to NH3 and the NH3 concentration rapidly increases, which results in good conditions for the adsorption of ammonia onto the Cu(II)-loaded resin. As shown in eqn (1), the ammonia could be removed easier as NH3 than as NH4+. This difference explains how the ammonia removal efficiency changes with the solution pH.
(III) It is clear that NH3 is the predominant species above pH 9.5 according to eqn (5). Simultaneously, a sharp increase in the OH− concentration may result in forming the unexpected precipitate Cu(OH)2 and lead to the decrease of Cu(II) loaded on the resin. The drop-off of Cu(II) on the resin restricted the forming of copper complex with the neutral ligand NH3 and caused the reduction in ammonia adsorption.
3.4 Adsorption isotherms
Adsorption is usually described using different types of isotherms, which indicate the amount of adsorbate present on the adsorbent as a function of pressure (gas) or concentration (liquid) at a constant temperature. The adsorption isotherm is an invaluable and effective curve depicting the adsorption phenomena governing the retention (or release) or mobility of a substance.59,60 All equilibrium experiments were carried out at the optimum pH of 9.5 at room temperature 298 K. The equilibrium adsorption data were analyzed using two typical adsorption isotherms, viz., Langmuir and Freundlich isotherm model.23,61,62
3.4.1 Adsorption theoretical model. The Langmuir isotherm is a commonly applied model for adsorption on a completely homogenous surface with negligible interaction between adsorbed molecules.63 This model perfectly describes numerous homogeneous, constant-energy sorption systems in solution. The maximum adsorption capacity of each adsorbent for various adsorbates is explained by fitting the data to the Langmuir model. The non-linear Langmuir isotherm formula can be expressed as follows:| |
 | (6) |
where KL is an equilibrium constant, and qm represents the maximum adsorption capacity of the AMAR. Ce (mg L−1) and qe (mg g−1) are the equilibrium concentration of ammonia and the amount of ammonia absorbed per unit matter of sorbent, respectively.For predicting the favorability of an adsorption system, the dimensionless separation factor RL was introduced and is defined as follows:51,64
| |
 | (7) |
where
Cm is the maximal initial concentration of ammonia in solution, and
RL is an indicator of the sorption favorability and capacity. If
RL > 1, the isotherm is unfavorable; 0 <
RL < 1, the isotherm is linear;
RL = 0, the isotherm is irreversible.
65 The isotherm is linear when
R = 1.
The Freundlich isotherm model was first proposed by Freundlich in 1906.66 It is known as the earliest mathematical model of adsorption and has been applied well in describing multilayer adsorption, in contrast to the monolayer Langmuir model. The basic assumption of this isotherm is that the sorption sites are distributed exponentially with respect to the heat of adsorption. The mathematical expression for the Freundlich equation is given below:
| |
 | (8) |
The linear form of the Freundlich isotherm is given as follows:
| |
 | (9) |
In this model, Ce (mg L−1) and qe (mg g−1) are the equilibrium concentration of ammonia and the amount of ammonia absorbed per unit matter of sorbent, respectively. KF and n are two important characteristic Freundlich constants. KF indicates an adsorption interaction between the adsorbent and the adsorbate, while n is an indicator of the favorableness of the adsorption system, similar to RL in the Langmuir model. If 1/n > 1, the isotherm is unfavorable at lower concentrations of adsorbate; 0 < 1/n < 1, the isotherm is favorable; 1/n = 0, the isotherm is irreversible.67
3.4.2 Adsorption isotherms fitting result. Linear regression is considered as a conventional and effective method for the determination of isotherm parameters. The effect of initial ammonia concentrations on the adsorption of ammonia at optimum solution pH at setting equilibrium temperatures 288 K, 298 K, 308 K, 318 K and 333 K was investigated. The experimental data of ammonia adsorption isotherms of on AMAR at different temperatures was shown in Fig. 6. The Langmuir and Freundlich isotherms are the most often-used isotherm models for the description of adsorption of liquid adsorption in liquid phase applications.68 The corresponding linearized Langmuir and Freundlich isotherms fitting results were shown in Fig. 7 and 8.
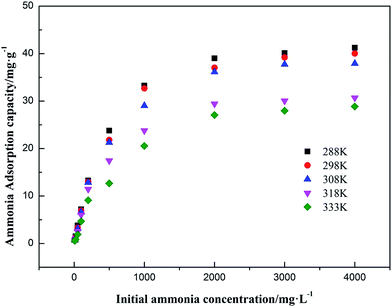 |
| | Fig. 6 Adsorption isotherms of ammonia onto AMAR at different temperatures. | |
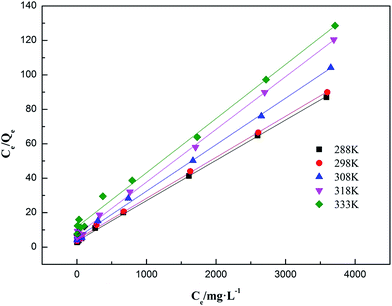 |
| | Fig. 7 Linearized Langmuir adsorption isotherms of ammonia onto AMAR at different temperatures. | |
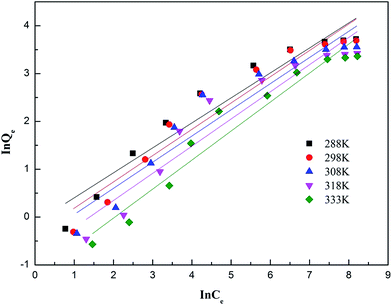 |
| | Fig. 8 Linearized Freundlich adsorption isotherms of ammonia onto AMAR at different temperatures. | |
As shown in Fig. 6, the ammonia adsorption capacity on AMAR increased with the increasing of initial ammonia concentrations in solutions and decreased with the increasing of solution temperature, suggesting that the ammonia adsorption process might be an exothermic reaction. The relevant adsorption isotherm parameters according to the three linear regression fitting results were shown in Table 3. As shown in Table 3, the coefficient of determination R2 of both Langmuir and Freundlich isotherm models were relatively high (Langmuir model R2 > 0.99, Freundlich model R2 > 0.91), suggesting that both of the two isotherm models were fitted well for the ammonia adsorption. The dimensionless separation factor RL ranged from 0.427 to 0.649 (0 < RL < 1), suggesting that the Langmuir isotherm was linear and favorable for isotherm modelling. The constant 1/n in Freundlich model ranged from 0.522 to 0.607 (0 < 1/n < 1), suggesting that the Freundlich isotherm was linear and favorable as well. The Langmuir isotherm model was the best-fitting model of the two in view of the value of R2. Besides, the Freundlich isotherm model did not fit well with the experimental data in the high initial ammonia concentrations. At the corresponding solution temperature of 288 K, 298 K, 308 K, 318 K and 333 K, the theoretical maximum ammonia adsorption capacities were 42.735 mg g−1, 41.841 mg g−1, 40.323 mg g−1, 32.680 mg g−1 and 31.746 mg g−1, using the Langmuir isotherm model. The lower solution temperature (T < 308 K) has slightly effect on the ammonia adsorption capacity, while the higher solution temperature has a greater impact on the ammonia adsorption capacities.
Table 3 Parameters of Langmuir and Freundlich isotherms for ammonia adsorption on AMAR
| T/K |
Langmuir model |
Freundlich model |
| qm/mg g−1 |
KL/g mg−1 |
RL |
R2 |
1/n |
KF |
R2 |
| 288 |
42.735 |
0.0067 |
0.427 |
0.999 |
0.522 |
0.887 |
0.935 |
| 298 |
41.841 |
0.0054 |
0.481 |
0.999 |
0.550 |
0.695 |
0.931 |
| 308 |
40.323 |
0.0048 |
0.510 |
0.999 |
0.563 |
0.595 |
0.926 |
| 318 |
32.680 |
0.0043 |
0.538 |
0.998 |
0.568 |
0.453 |
0.918 |
| 333 |
31.746 |
0.0027 |
0.649 |
0.994 |
0.607 |
0.291 |
0.951 |
3.5 Adsorption thermodynamics
The calculation of thermodynamic parameters was considered as a necessary and efficient way to reveal the effect of temperature on the adsorbent and adsorbate in the adsorption process and help understand the nature of adsorption process. The experiments were carried out at different temperatures. Gibbs free energy change ΔG, enthalpy change ΔH and entropy change ΔS are calculated according to the following thermodynamic equations:67,69–71| |
 | (11) |
where R (8.314 J mol−1 K−1) is the gas constant and T(K) is the solution temperature. The enthalpy change ΔH and entropy change ΔS are obtained from the slope and intercept of the line plotted by ln(K0) versus 1/T, respectively. K0 is the dependency of the equilibrium association constant. In literatures, the equilibrium constants for thermodynamic calculation have been derived in many different ways, such as Langmuir isotherm, Frumkin isotherm, Flory–Huggins isotherm, distribution constants, and so on. Among them, the Langmuir equilibrium constant is the most frequently used model for thermodynamic calculation. The Langmuir equilibrium constant for calculation of ΔG was proved numerically equal to the thermodynamic equilibrium constant of adsorption according to Liu Yu.72 In this paper, the thermodynamic constant K0 was calculated following eqn (12) according to Langmuir model.
The obtained thermodynamic parameters for ammonia adsorption on AMAR were listed in Table 4. The values of ΔG increased with the increasing of temperature, indicating that the sorption process is more favorable at high temperature. The driving force for the adsorption increased with the increasing of temperature. The positive values of ΔG suggested that the sorption process was nonspontaneous. The negative value of ΔH reflects that the sorption process is exothermic in nature. The negative value of ΔS shows that a decrease in randomness occurs at the interface during the sorption process.73 This may be resulted from the coordination reaction between the copper loaded on AMAR and ammonia in solutions. For the solid–liquid sorption process, the adsorbate from the liquid phase into the solid surface will lose partial degree of freedom. This is the process of entropy reduction.
Table 4 Thermodynamic parameters for ammonia adsorption on AMAR
| 1/T |
ln(K0) |
Temperature/K |
ΔG/kJ mol−1 |
ΔS/kJ mol−1 |
ΔH/kJ mol−1 |
| 0.003472 |
−1.257 |
288 |
3.010 |
−82.776 |
−20.996 |
| 0.003356 |
−1.487 |
298 |
3.685 |
| 0.003247 |
−1.645 |
308 |
4.212 |
| 0.003145 |
−1.962 |
318 |
5.188 |
| 0.003003 |
−2.461 |
333 |
6.814 |
3.6 Adsorption kinetics
3.6.1 Adsorption kinetic models. Adsorption kinetics analysis, an important method for describing the adsorption process, is used to interpret the transport of adsorbates inside adsorbents for real applications and plays a key role in elucidating the dominant adsorption mechanism.74–76 The adsorption kinetic data obtained were analyzed using the pseudo-first-order, pseudo-second-order and intra-particle diffusion kinetic models. The pseudo-first-order model is one of the most widely used kinetic models for depicting the adsorption process in solution. A simple expression of this model was introduced by Lagergren in 1898.77 The pseudo-first-order model is usually expressed as eqn (13):| |
 | (13) |
where k1 (min−1) is the rate constant of the pseudo-first-order kinetic model.Eqn (13) is the linear pseudo-first-order kinetic model obtained from a plot of log(qe − qt) vs. time (t). The rate constant k1 and adsorption capacity qe can be calculated from the intercept and the slope, respectively.
Ho and Mckay developed the pseudo-second-order kinetic model in 1998 to address the shortcomings of the pseudo-first-order model at higher adsorbate uptake values.78 The pseudo-second-order kinetic model is expressed as eqn (14) and (15):
| |
 | (14) |
The non-linear form of the pseudo-second-order model can be expressed as follows:
| |
 | (16) |
where
h is the initial sorption rate and
k2 is the rate constant of pseudo-second order adsorption (g mg
−1 min
−1). The slope and intercept of the plot of
t/
qt versus t were used to calculate
qe2 and
k2.
79
The intra-particle diffusion model assumes that intra-particle diffusion is the only rate determining step.80 The intra-particle diffusion equation can be written by following equation:
where
kt is the intra-particle diffusion rate (mg g
−1 min
−1/2), and
C is a constant characterizing the extend of the boundary layer effect. The slope and intercept of the plot of
qt versus t1/2 were used to calculate
kt and
C. If the plots gives a straight line passing through the origin, the intra-particle diffusion is the rate limiting step for adsorption; if the plots gives a multi-linear relationship or does not pass through the origin, the adsorption process were affected by two or more diffusion mechanisms.
81
3.6.2 Adsorption kinetics fitting results. The influences of contact time on the adsorption capacities for ammonia adsorption on AMAR at the given temperature 288 K, 298 K, 308 K, 318 K and 333 K with the initial ammonia concentrations of 198 mg L−1 were conducted. The experimental adsorption kinetics data were shown in Fig. 9. The pseudo-first-order, pseudo-second-order and intra-particle diffusion kinetic models were used to fit the experimental data and the corresponding fitting results were shown in Fig. 10–12.
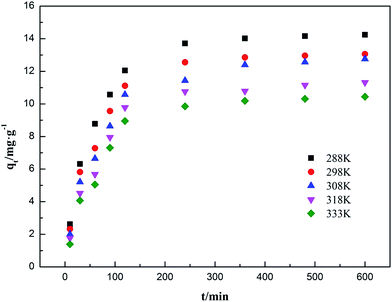 |
| | Fig. 9 Adsorption kinetics of ammonia onto AMAR at different temperatures. | |
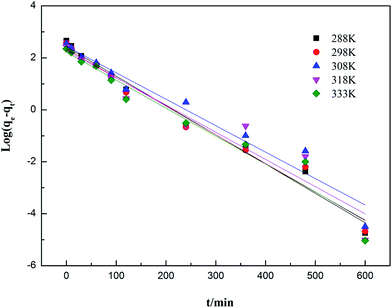 |
| | Fig. 10 Adsorption kinetics of ammonia onto AMAR fitting with pseudo-first-order model at different temperatures. | |
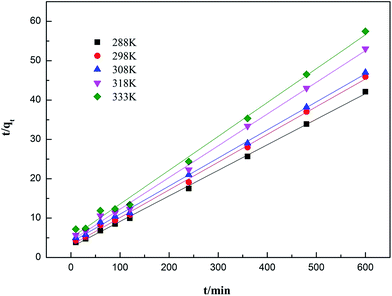 |
| | Fig. 11 Adsorption kinetics of ammonia onto AMAR fitting with pseudo-second-order model at different temperatures. | |
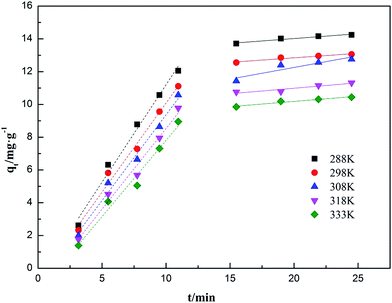 |
| | Fig. 12 Adsorption kinetics of ammonia onto AMAR fitting with intra-particle diffusion model at different temperatures. | |
As shown in Fig. 9, a higher solution temperature results in a higher initial adsorption rate at the same initial ammonia concentrations. The ammonia adsorption capacity qe increased rapidly during the initial adsorption stage (100 min). Then, the adsorption capacity increased at a relatively slow adsorption rate (300 min) and finally reached equilibrium after 360 min. This changing of the adsorption rate might be due to the reduction of available binding sites in AMAR overtime.
The corresponding calculated kinetic parameters and the coefficient of determinations of each model were listed in Table 5. As shown in Table 5, both of the three classic kinetic models, pseudo-first-order, pseudo-second-order and intra-particle diffusion kinetic models, could describe the kinetic data compatibly. The pseudo-second-order was the best fitted kinetic model in view of the comparatively high coefficient of determination (0.996 < R2 < 0.999) compared with pseudo-first-order (0.926 < R2 < 0.983) and intra-particle diffusion (0.888 < R2 < 0.962). In addition, the adsorption capacities (qe) estimated by pseudo-second-order were in an acceptable agreement with the experimental data. This results indicated that the ammonia adsorption on AMAR is mostly controlled by the chemisorption behavior.82 The results from Table 5 and Fig. 9 showed that the initial adsorption rates increased with the decreasing of solution temperature. The adsorption rate is mainly affected by the following three steps, which are liquid film diffusion, particle diffusion and chemical reaction process. The intra-particle diffusion fitting results did not pass through the origin, indicating that the particle diffusion is not the only rate-limited step in the adsorption process. The adsorption process might be affected by a variety of mechanisms.
Table 5 Kinetic parameters for ammonia adsorption on AMAR at different temperatures
| Models |
Parameters |
Temperature/K |
| 288 |
298 |
308 |
318 |
333 |
| |
qexp (mg g−1) |
14.241 |
13.061 |
12.759 |
11.313 |
10.443 |
| Pseudo-first-order |
qe (mg g−1) |
10.656 |
9.843 |
9.398 |
9.444 |
8.930 |
| k1 (min−1) |
0.026 |
0.025 |
0.023 |
0.024 |
0.025 |
| R2 |
0.983 |
0.977 |
0.954 |
0.926 |
0.955 |
| Pseudo-second-order |
qe (mg g−1) |
15.385 |
14.184 |
14.025 |
12.407 |
11.628 |
| k2 × 103 (g mg−1 min−1) |
1.599 |
1.610 |
1.311 |
1.546 |
1.490 |
| R2 |
0.999 |
0.998 |
0.998 |
0.997 |
0.996 |
![[thin space (1/6-em)]](https://www.rsc.org/images/entities/char_2009.gif) |
| Intra-particle diffusion |
| Step I |
kt (mg g−1 min−0.5) |
1.191 |
1.089 |
1.047 |
0.986 |
0.930 |
| C (mg g−1) |
−0.701 |
−0.797 |
−1.100 |
−1.321 |
−1.493 |
| R2 |
0.989 |
0.986 |
0.986 |
0.982 |
0.979 |
| Step II |
kt (mg g−1 min−0.5) |
12.839 |
11.749 |
9.418 |
9.650 |
8.897 |
| C (mg g−1) |
0.059 |
0.055 |
0.142 |
0.067 |
0.064 |
| R2 |
0.952 |
0.946 |
0.888 |
0.921 |
0.962 |
4. Conclusions
In this paper, a poly ligand exchanger (PLE), Cu(II)-loaded chelating resin (named AMAR) with the functional group of weak iminodiacetate acid was prepared to efficiently remove ammonia from solutions. The investigation of FT-IR analysis and the pore textural properties characterized the main structure and the physicochemical properties of AMAR and help to understand the ammonia adsorption mechanism on AMAR. The copper ions loading onto AMAR forms coordinate covalent bond with –COOH in the virgin resin. Pore textural properties of the resins indicated that the BET surface areas and the pore volumes of the resins were enlarged after copper loading because of the formation of bridge complex between transition metals and the iminodiacetate moieties; the investigation on the effect of solution pH on the ammonia adsorption shown that the optimum pH was about 9.5. The higher pH cannot guarantee a higher adsorption capacity; the equilibrium experiments shown that the maximum ammonia adsorption capacity was 42.735 mg g−1 and Langmuir isotherm model was the best fitted model; the positive ΔG and negative ΔH and ΔS were obtained according to the thermodynamic study; the pseudo-second-order kinetic model characterizes the kinetic curves well and the intra-particle diffusion result indicates that the adsorption process was controlled by at least two mechanisms.
Acknowledgements
This work was supported by the National Natural Science Foundation of China under grant (No. 51174328).
References
- N. Miladinovic and L. R. Weatherley, Intensification of ammonia removal in a combined ion-exchange and nitrification column, Chem. Eng. J., 2008, 135, 15–24 CrossRef CAS.
- J.-W. Shin, S.-J. Seo, H. A. Maitlo and J.-Y. Park, The enhancement of ammonium removal from ethanolamine wastewater using air-cathode microbial fuel cells coupled to ferric reduction, Bioresour. Technol., 2015, 190, 466–473 CrossRef CAS PubMed.
- Q. Lu, W. Zhou, M. Min, X. Ma, Y. Ma and P. Chen, et al., Mitigating ammonia nitrogen deficiency in dairy wastewaters for algae cultivation, Bioresour. Technol., 2016, 201, 33–40 CrossRef CAS PubMed.
- M. Chen, W. Wang, Y. Feng, X. Zhu, H. Zhou and Z. Tan, et al., Impact resistance of different factors on ammonia removal by heterotrophic nitrification–aerobic denitrification bacterium Aeromonas sp. HN-02, Bioresour. Technol., 2014, 167, 456–461 CrossRef CAS PubMed.
- F. B. Eddy, Ammonia in estuaries and effects on fish, J. Fish Biol., 2005, 67, 1495–1513 CrossRef CAS.
- F. M. Ferraz, J. Povinelli and E. M. Vieira, Ammonia removal from landfill leachate by air stripping and absorption, Environ. Technol., 2013, 34, 2317–2326 CrossRef CAS PubMed.
- X. Quan, Z. Cheng, F. Xu, F. Qiu, L. Dai and Y. Yan, Structural optimization of the porous section in a water-sparged aerocyclone reactor to enhance the air-stripping efficiency of ammonia, J. Environ. Chem. Eng., 2014, 2, 1199–1206 CrossRef CAS.
- M.-H. Yuan, Y.-H. Chen, J.-Y. Tsai and C.-Y. Chang, Removal of ammonia from wastewater by air stripping process in laboratory and pilot scales using a rotating packed bed at ambient temperature, J. Taiwan Inst. Chem. Eng., 2016, 60, 488–495 CrossRef CAS.
- G. Yalmaz and I. Öztürk, Biological ammonia removal from anaerobically pre-treated landfill leachate in sequencing batch reactors (SBR), Water Sci. Technol., 2001, 43, 307–314 CAS.
- G. L. Rogers and S. L. Klemetson, Ammonia removal in selected aquaculture water reuse biofilters, Aquacult. Eng., 1985, 4, 135–154 CrossRef.
- H. Du, F. Li, Z. Yu, C. Feng and W. Li, Nitrification and denitrification in two-chamber microbial fuel cells for treatment of wastewater containing high concentrations of ammonia nitrogen, Environ. Technol., 2016, 37, 1232–1239 CrossRef CAS PubMed.
- T. A. Pressley, D. F. Bishop and S. G. Roan, Ammonia–nitrogen removal by breakpoint chlorination, Environ. Sci. Technol., 1972, 6, 622–628 CrossRef CAS.
- J. W. Charrois and S. E. Hrudey, Breakpoint chlorination and free-chlorine contact time: Implications for drinking water N-nitrosodimethylamine concentrations, Water Res., 2007, 41, 674–682 CrossRef CAS PubMed.
- Y.-n. Chen, C.-h. Liu, J.-x. Nie, X.-p. Luo and D.-s. Wang, Chemical precipitation and biosorption treating landfill leachate to remove ammonium–nitrogen, Clean Technol. Environ. Policy, 2013, 15, 395–399 CrossRef CAS.
- H. Huang, Y. Chen, Y. Jiang and L. Ding, Treatment of swine wastewater combined with MgO-saponification wastewater by struvite precipitation technology, Chem. Eng. J., 2014, 254, 418–425 CrossRef CAS.
- J. H. Koon and W. J. Kaufman, Ammonia removal from municipal wastewaters by ion exchange, J.-Water Pollut. Control Fed., 1975, 448–465 CAS.
- O. Lahav, Y. Schwartz, P. Nativ and Y. Gendel, Sustainable removal of ammonia from anaerobic-lagoon swine waste effluents using an electrochemically-regenerated ion exchange process, Chem. Eng. J., 2013, 218, 214–222 CrossRef CAS.
- G. A. Maul, Y. Kim, A. Amini, Q. Zhang and T. H. Boyer, Efficiency and life cycle environmental impacts of ion-exchange regeneration using sodium, potassium, chloride, and bicarbonate salts, Chem. Eng. J., 2014, 254, 198–209 CrossRef CAS.
- H. Liu and J. Wang, Separation of ammonia from radioactive wastewater by hydrophobic membrane contactor, Prog. Nucl. Energy, 2016, 86, 97–102 CrossRef CAS.
- P. Liang, H. Yu, J. Huang, Y. Zhang and H. Cao, The Review on Adsorption and Removing Ammonia Nitrogen with Biochar on its Mechanism, MATEC Web of Conferences, 07006, 2016, vol. 67.
- L. Weatherley and N. Miladinovic, Comparison of the ion exchange uptake of ammonium ion onto New Zealand clinoptilolite and mordenite, Water Res., 2004, 38, 4305–4312 CrossRef CAS PubMed.
- H. Huang, D. Xiao, R. Pang, C. Han and L. Ding, Simultaneous removal of nutrients from simulated swine wastewater by adsorption of modified zeolite combined with struvite crystallization, Chem. Eng. J., 2014, 256, 431–438 CrossRef CAS.
- T. Mochizuki, M. Kubota, H. Matsuda and L. F. D'Elia Camacho, Adsorption behaviors of ammonia and hydrogen sulfide on activated carbon prepared from petroleum coke by KOH chemical activation, Fuel Process. Technol., 2016, 144, 164–169 CrossRef CAS.
- V. M. F. Alexandre, F. V. do Nascimento and M. C. Cammarota, Ammonia stripping, activated carbon adsorption and anaerobic biological oxidation as process combination for the treatment of oil shale wastewater, Environ. Technol., 2016, 1–9 Search PubMed.
- L. M. Le Leuch, A. Subrenat and P. Le Cloirec, Hydrogen Sulfide and Ammonia Removal on Activated Carbon Fiber Cloth-Supported Metal Oxides, Environ. Technol., 2005, 26, 1243–1254 CrossRef CAS PubMed.
- Q. Zhao, H. Han, B. Hou, H. Zhuang, S. Jia and F. Fang, Nitrogen removal from coal gasification wastewater by activated carbon technologies combined with short-cut nitrogen removal process, J. Environ. Sci., 2014, 26, 2231–2239 CrossRef PubMed.
- F. Tomul, F. Turgut Basoglu and H. Canbay, Determination of adsorptive and catalytic properties of copper, silver and iron contain titanium-pillared bentonite for the removal bisphenol A from aqueous solution, Appl. Surf. Sci., 2016, 360, 579–593 CrossRef CAS.
- S. Yu, L. Zhai, S. Zhong, Y. Qiu, L. Cheng and X. Ren, Synthesis and structural characterization of magnetite/sepiolite composite and its sorptive properties for Co(II) and Cd(II), J. Taiwan Inst. Chem. Eng., 2016, 59, 221–228 CrossRef CAS.
- Z. Xiong, P. Dimick, D. Zhao, A. Kney and J. Tavakoli, Removal of perchlorate from contaminated water using a regenerable polymeric ligand exchanger, Sep. Sci. Technol., 2006, 41, 2555–2574 CrossRef CAS.
- U. De La Torre, B. Pereda-Ayo and J. R. González-Velasco, Cu-zeolite NH3–SCR catalysts for NOx removal in the combined NSR–SCR technology, Chem. Eng. J., 2012, 207–208, 10–17 CrossRef CAS.
- F. Helfferich, Ligand Exchange. I. Equilibria, J. Am. Chem. Soc., 1962, 84, 3237–3242 CrossRef CAS.
- A. A. Gürten, S. Uçan, M. A. Özler and A. Ayar, Removal of aniline from aqueous solution by PVC-CDAE ligand-exchanger, J. Hazard. Mater., 2005, 120, 81–87 CrossRef PubMed.
- N. Viswanathan and S. Meenakshi, Effect of metal ion loaded in a resin towards fluoride retention, J. Fluorine Chem., 2008, 129, 645–653 CrossRef CAS.
- B. An, T. R. Steinwinder and D. Zhao, Selective removal of arsenate from drinking water using a polymeric ligand exchanger, Water Res., 2005, 39, 4993–5004 CrossRef CAS PubMed.
- M. Barsbay, P. A. Kavaklı and O. Güven, Removal of phosphate using copper-loaded polymeric ligand exchanger prepared by radiation grafting of polypropylene/polyethylene (PP/PE) nonwoven fabric, Radiat. Phys. Chem., 2010, 79, 227–232 CrossRef CAS.
- A. Ayar, S. Gursal, A. A. Gurten and O. Gezici, On the removal of some phenolic compounds from aqueous solutions by using a sporopollenin-based ligand-exchange fixed bed – isotherm analysis, Desalination, 2008, 219, 160–170 CrossRef CAS.
- K. Shimomura, L. Dickson and H. F. Walton, Separation of amines by ligand exchange: part IV ligand exchange with chelating resins and cellulosic exchangers, Anal. Chim. Acta, 1967, 37, 102–111 CrossRef CAS.
- F. R. Groves.Waste Water Treatment by Ligand Exchange, 1983 Search PubMed.
- H. Yoshida and T. Kataoka, Recovery of Amine and Ammonia by Ion Exchange Method Comparison of Ligand Sorption and Ion Exchange Accompanied by Neutralization Reaction, Solvent Extr. Ion Exch., 1986, 4, 1171–1191 CrossRef CAS.
- S. Mustafa, L. H. Nadia, N. Rehana, A. Naeem and H. Y. Samad, Ligands Sorption Studies on Transition Metal Ion Loaded Amberlite IRC-50, Langmuir, 1998, 14, 2378–2384 CrossRef CAS.
- Q. Chen, K. Zhou, Y. Chen, A. Wang and F. Liu, A novel poly ligand exchanger—Cu(II)-loaded chelating resin for the removal of ammonia–nitrogen in aqueous solutions, Environ. Technol., 2017, 1–21 CrossRef CAS PubMed.
- Q. Chen, K. Zhou, Y. Hu, F. Liu and A. Wan, Effect of competing ions and causticization on the ammonia adsorption by a noval poly ligand exchanger (PLE) AMAR, Water Sci. Technol., 2016, 2016548 Search PubMed.
- V. J. Inglezakis, M. D. Loizidou and H. P. Grigoropoulou, Equilibrium and kinetic ion exchange studies of Pb2+, Cr3+, Fe3+ and Cu2+ on natural clinoptilolite, Water Res., 2002, 36, 2784–2792 CrossRef CAS PubMed.
- L. Wang, H. Zhang, C. Lu and L. Zhao, Ligand exchange on the surface of cadmium telluride quantum dots with fluorosurfactant-capped gold nanoparticles: synthesis, characterization and toxicity evaluation, J. Colloid Interface Sci., 2014, 413, 140–146 CrossRef CAS PubMed.
- C.-h. Xiong, G.-t. Wang and C.-p. Yao, Adsorption of ytterbium(III) from aqueous solution by SQD-85 resin, Trans. Nonferrous Met. Soc. China, 2011, 21, 2764–2771 CrossRef CAS.
- S. Liang, X. Guo, N. Feng and Q. Tian, Isotherms, kinetics and thermodynamic studies of adsorption of Cu2+ from aqueous solutions by Mg2+/K+ type orange peel adsorbents, J. Hazard. Mater., 2010, 174, 756–762 CrossRef CAS PubMed.
- D. Saha and S. Deng, Adsorption equilibrium and kinetics of CO2, CH4, N2O, and NH3 on ordered mesoporous carbon, J. Colloid Interface Sci., 2010, 345, 402–409 CrossRef CAS PubMed.
- J. Nawrocki, M. Rigney, A. Mccormick and P. W. Carr, Chemistry of zirconia and its use in chromatography, Journal of Chromatography A, 1993, 657, 229–282 CrossRef CAS PubMed.
- Z. Weihua, H. Runping, C. Zongzhang, J. Shi and H. Liu, Characterization and Properties of Manganese Oxide Coated Zeolite as Adsorbent for Removal of Copper(II) and Lead(II) Ions from Solution, J. Chem. Eng. Data, 2006, 51, 534–541 CrossRef.
- K. Emerson, R. C. Russo, R. E. Lund and R. V. Thurston, Aqueous ammonia equilibrium calculations: effect of pH and temperature, J. Fish. Res. Board Can., 1975, 32, 2379–2383 CrossRef CAS.
- W. Guan, J. Pan, H. Ou, X. Wang, X. Zou and W. Hu, et al., Removal of strontium(II) ions by potassium tetratitanate whisker and sodium trititanate whisker from aqueous solution: equilibrium, kinetics and thermodynamics, Chem. Eng. J., 2011, 167, 215–222 CrossRef CAS.
- S. Karcher, A. Kornmüller and M. Jekel, Anion exchange resins for removal of reactive dyes from textile wastewaters, Water Res., 2002, 36, 4717–4724 CrossRef CAS PubMed.
- Z.-Y. Ji, J.-S. Yuan and X.-G. Li, Removal of ammonium from wastewater using calcium form clinoptilolite, J. Hazard. Mater., 2007, 141, 483–488 CrossRef CAS PubMed.
- S. Shibuya, Y. Sekine and I. Mikami, Influence of pH and pH adjustment conditions on photocatalytic oxidation of aqueous ammonia under airflow over Pt-loaded TiO2, Appl. Catal., A, 2015, 496, 73–78 CrossRef CAS.
- Y. Ding and M. Sartaj, Statistical analysis and optimization of ammonia removal from aqueous solution by zeolite using factorial design and response surface methodology, J. Environ. Chem. Eng., 2015, 3, 807–814 CrossRef CAS.
- C. Peng, L. Chai, C. Tang, X. Min, Y. Song and C. Duan, et al., Study on the mechanism of copper–ammonia complex decomposition in struvite formation process and enhanced ammonia and copper removal, J. Environ. Sci., 2017, 51, 222–233 CrossRef PubMed.
- S. H. Lin and C. L. Wu, Ammonia removal from aqueous solution by ion exchange, Ind. Eng. Chem. Res., 1996, 35, 553–558 CrossRef CAS.
- K. M. Udert, T. A. Larsen and W. Gujer, Estimating the precipitation potential in urine-collecting systems, Water Res., 2003, 37, 2667–2677 CrossRef CAS PubMed.
- K. Foo and B. Hameed, Insights into the modeling of adsorption isotherm systems, Chem. Eng. J., 2010, 156, 2–10 CrossRef CAS.
- Z. Huang, S. Liu, B. Zhang, L. Xu and X. Hu, Equilibrium and kinetics studies on the absorption of Cu(II) from the aqueous phase using a β-cyclodextrin-based adsorbent, Carbohydr. Polym., 2012, 88, 609–617 CrossRef CAS.
- V. Sivasankar, T. Ramachandramoorthy and A. Chandramohan, Fluoride removal from water using activated and MnO2-coated Tamarind Fruit (Tamarindus indica) shell: batch and column studies, J. Hazard. Mater., 2010, 177, 719–729 CrossRef CAS PubMed.
- P. Ganesan, R. Kamaraj and S. Vasudevan, Application of isotherm, kinetic and thermodynamic models for the adsorption of nitrate ions on graphene from aqueous solution, J. Taiwan Inst. Chem. Eng., 2013, 44, 808–814 CrossRef CAS.
- B. Alyüz and S. Veli, Kinetics and equilibrium studies for the removal of nickel and zinc from aqueous solutions by ion exchange resins, J. Hazard. Mater., 2009, 167, 482–488 CrossRef PubMed.
- M. Mazzotti, Equilibrium theory based design of simulated moving bed processes for a generalized Langmuir isotherm, Journal of Chromatography A, 2006, 1126, 311–322 CrossRef CAS PubMed.
- S. Sen Gupta and K. G. Bhattacharyya, Interaction of metal ions with clays: I. A case study with Pb(II), Appl. Clay Sci., 2005, 30, 199–208 CrossRef CAS.
- H. Freundlich, Over the adsorption in solution, J. Phys. Chem., 1906, 57, 1100–1107 Search PubMed.
- S. Vasiliu, I. Bunia, S. Racovita and V. Neagu, Adsorption of cefotaxime sodium salt on polymer coated ion exchange resin microparticles: kinetics, equilibrium and thermodynamic studies, Carbohydr. Polym., 2011, 85, 376–387 CrossRef CAS.
- N. P. Sasidharan, P. Chandran and K. S. Sudheer, Interaction of colloidal zinc oxide nanoparticles with bovine serum albumin and its adsorption isotherms and kinetics, Colloids Surf., B, 2013, 102, 195–201 CrossRef CAS PubMed.
- G. Bayramoglu, B. AltiNtas and M. Y. Arica, Adsorption kinetics and thermodynamic parameters of cationic dyes from aqueous solutions by using a new strong cation-exchange resin, Chem. Eng. J., 2009, 152, 339–346 CrossRef CAS.
- P. Wang, M. Cao, C. Wang, Y. Ao, J. Hou and J. Qian, Kinetics and thermodynamics of adsorption of methylene blue by a magnetic graphene–carbon nanotube composite, Appl. Surf. Sci., 2014, 290, 116–124 CrossRef CAS.
- X. Liu and D. J. Lee, Thermodynamic parameters for adsorption equilibrium of heavy metals and dyes from wastewaters, Bioresour. Technol., 2014, 160, 24–31 CrossRef CAS PubMed.
- Y. Liu, Is the Free Energy Change of Adsorption Correctly Calculated?, J. Chem. Eng. Data, 2009, 54, 1981–1985 CrossRef CAS.
- P. Liao, S. Yuan, W. Xie, W. Zhang, M. Tong and K. Wang, Adsorption of nitrogen-heterocyclic compounds on bamboo charcoal: kinetics, thermodynamics, and microwave regeneration, J. Colloid Interface Sci., 2013, 390, 189–195 CrossRef CAS PubMed.
- D. D. Maksin, A. B. Nastasović, A. D. Milutinovićnikolić, L. T. Suručić, Z. P. Sandić and R. V. Hercigonja, et al., Equilibrium and kinetics study on hexavalent chromium adsorption onto diethylene triamine grafted glycidyl methacrylate based copolymers, J. Hazard. Mater., 2012, 209–210, 99–110 CrossRef CAS PubMed.
- W. Yang, Q. Tang, J. Wei, Y. Ran, L. Chai and H. Wang, Enhanced removal of Cd(II) and Pb(II) by composites of mesoporous carbon stabilized alumina, Appl. Surf. Sci., 2016, 369, 215–223 CrossRef CAS.
- Q. Li, L. Chai and W. Qin, Cadmium(II) adsorption on esterified spent grain: equilibrium modeling and possible mechanisms, Chem. Eng. J., 2012, 197, 173–180 CrossRef CAS.
- S. Lagergren, About the theory of so-called adsorption of soluble substances, K. Sven. Vetenskapsakad. Handl., 1898, 24, 1–39 Search PubMed.
- Y. Ho and G. McKay, The kinetics of sorption of basic dyes from aqueous solution by sphagnum moss peat, Can. J. Chem. Eng., 1998, 76, 822–827 CrossRef CAS.
- T. Anitha, P. S. Kumar and K. S. Kumar, Binding of Zn(II) ions to chitosan–PVA blend in aqueous environment: adsorption kinetics and equilibrium studies, Environ. Prog. Sustainable Energy, 2015, 34, 15–22 CrossRef CAS.
- Z. H. Zhou, J. Yuan and M. Hu, Adsorption of ammonium from aqueous solutions on environmentally friendly barbecue bamboo charcoal: characteristics and kinetic and thermodynamic studies, Environ. Prog. Sustainable Energy, 2015, 34, 655–662 CrossRef CAS.
- J. Huang, R. Deng and K. Huang, Equilibria and kinetics of phenol adsorption on a toluene-modified hyper-cross-linked poly(styrene-co-divinylbenzene) resin, Chem. Eng. J., 2011, 171, 951–957 CrossRef CAS.
- C. Zhou, Q. Wu, T. Lei and I. I. Negulescu, Adsorption kinetic and equilibrium studies for methylene blue dye by partially hydrolyzed polyacrylamide/cellulose nanocrystal nanocomposite hydrogels, Chem. Eng. J., 2014, 251, 17–24 CrossRef CAS.
|
| This journal is © The Royal Society of Chemistry 2017 |
Click here to see how this site uses Cookies. View our privacy policy here.  Open Access Article
 ab,
Kanggen Zhou*ab,
Yan Chenab,
Aihe Wangab and
Fang Liuab


![[double bond, length as m-dash]](https://www.rsc.org/images/entities/char_e001.gif) O symmetric stretching vibration of carboxylic acid groups of the virgin resin;44,45 the peak at 2921 cm−1 is attributed to the symmetric and asymmetric C–H stretching vibration of –CH2 and –CH3 groups;46 2348 cm−1 attributed the characteristic peak of –NH2. 1405 cm−1 assigned to bending vibrations of –OH. After loading copper, the band at 1384 cm−1 was the C
O symmetric stretching vibration of carboxylic acid groups of the virgin resin;44,45 the peak at 2921 cm−1 is attributed to the symmetric and asymmetric C–H stretching vibration of –CH2 and –CH3 groups;46 2348 cm−1 attributed the characteristic peak of –NH2. 1405 cm−1 assigned to bending vibrations of –OH. After loading copper, the band at 1384 cm−1 was the C![[double bond, length as m-dash]](https://www.rsc.org/images/entities/char_e001.gif) O asymmetric stretching vibration of carboxylic acid groups of AMAR. The intensity of –OH was weakened after loading copper and adsorption process. The –OH peak at 3412 cm−1 was slightly shifted to 3420 cm−1 (AMAR) and 3416 cm−1 (AMAR after adsorption). The C
O asymmetric stretching vibration of carboxylic acid groups of AMAR. The intensity of –OH was weakened after loading copper and adsorption process. The –OH peak at 3412 cm−1 was slightly shifted to 3420 cm−1 (AMAR) and 3416 cm−1 (AMAR after adsorption). The C![[double bond, length as m-dash]](https://www.rsc.org/images/entities/char_e001.gif) O peak was shifted from 1589 cm−1 (origin resin) to 1616 cm−1 (AMAR) and 1616 cm−1 (AMAR after adsorption). The intensity of C
O peak was shifted from 1589 cm−1 (origin resin) to 1616 cm−1 (AMAR) and 1616 cm−1 (AMAR after adsorption). The intensity of C![[double bond, length as m-dash]](https://www.rsc.org/images/entities/char_e001.gif) O was weakened after loading with copper. These findings suggested that the hydrogen and oxygen atoms in the –OH and were involved in the copper adsorption. The loaded copper in AMAR may form coordinate covalent bond with –COOH in the virgin resin. After copper loading, the peak of –NH2 at 2348 cm−1 was disappeared in AMAR. While, the peak of –NH2 was appeared at 2348 cm−1 with a weaker intensity. These results indicated that –NH2 may be involved with the adsorption process as well as the copper-loading process. The schema of the listed forms of complexes was shown in Fig. 2. Transition metals can form complexes with carboxylate in three forms, which are monodentate complexes, bidentate complexes and bridge complexes. The virgin resin and AMAR showed peaks of C
O was weakened after loading with copper. These findings suggested that the hydrogen and oxygen atoms in the –OH and were involved in the copper adsorption. The loaded copper in AMAR may form coordinate covalent bond with –COOH in the virgin resin. After copper loading, the peak of –NH2 at 2348 cm−1 was disappeared in AMAR. While, the peak of –NH2 was appeared at 2348 cm−1 with a weaker intensity. These results indicated that –NH2 may be involved with the adsorption process as well as the copper-loading process. The schema of the listed forms of complexes was shown in Fig. 2. Transition metals can form complexes with carboxylate in three forms, which are monodentate complexes, bidentate complexes and bridge complexes. The virgin resin and AMAR showed peaks of C![[double bond, length as m-dash]](https://www.rsc.org/images/entities/char_e001.gif) O symmetric stretching vibration of carboxylic acid groups at 1589 cm−1 and 1616 cm−1 and ΔV = 27 cm−1 (ΔV < 200 cm−1), which suggests that the Na+ in the resins exchanges with the copper ions in solutions and forms coordinate covalent bond with –COOH.
O symmetric stretching vibration of carboxylic acid groups at 1589 cm−1 and 1616 cm−1 and ΔV = 27 cm−1 (ΔV < 200 cm−1), which suggests that the Na+ in the resins exchanges with the copper ions in solutions and forms coordinate covalent bond with –COOH.


![[thin space (1/6-em)]](https://www.rsc.org/images/entities/char_2009.gif)


