 Open Access Article
Titanium dioxide nanoparticles induce size-dependent cytotoxicity and genomic DNA hypomethylation in human respiratory cells
Yue Ma†
 ,
Yinsheng Guo†
 ,
Shuang Wu,
Ziquan Lv,
Qian Zhang and
Yuebin Ke
 *
*
Key Laboratory of Molecular Biology, Key Laboratory of Genetics & Molecular Medicine of Shenzhen, Shenzhen Center for Disease Control and Prevention, No 8 Longyuan Road, Nanshan District, Shenzhen 518055, China. E-mail: keyke@szu.edu.cn; Fax: +86-755-25531876; Tel: +86-755-25531876
First published on 28th April 2017
Abstract
The widespread use of titanium dioxide nanoparticles (TiO2 NPs) is gradually increasing the risk of exposure to these potentially hazardous materials. Although numerous health effects of TiO2 NPs have been investigated, it remains unknown whether they could affect the respiratory cellular epigenome. We explored the viability, membrane integrity, intracellular ROS and genomic DNA methylation of human respiratory cells, as well as their expression of methylation-related genes, after treatment with TiO2 NPs with diameters of 25 nm (nanotube morphology) or 60 nm (anatase morphology). Two cell lines relevant to inhalation exposure, namely human bronchial epithelial cell line (16HBE) and human non-small cell lung cancer cells (A549), were tested, with treatment concentrations ranging from 0.1 to 100 μg mL−1. The TiO2 NPs induced time- and concentration-dependent decreases in cell viability in both A549 and 16HBE cells. The reduction in cell viability was greater for the smaller particles (size 25 nm) of the nanotube type. Cellular membrane integrity assays revealed that 16HBE cells were less sensitive to TiO2 NPs-25 nm (nanotube-type) than were A549 cells, as higher concentrations were required for cytotoxicity against the former. TiO2 NPs-25 nm (nanotube-type) showed greater toxicity against both cell lines than TiO2 NPs-60 nm (anatase-type). Intracellular ROS levels in both A549 and 16HBE cell were increased by TiO2 NPs whereas pretreatment with the antioxidant N-acetyl-L-cysteine eliminated TiO2 NPs-induced ROS accumulation and reduced cell death. Moreover, the anatase-type TiO2 NPs resulted in decreased global DNA methylation and altered expression levels of methylation-related genes and proteins, suggesting that these NPs induce cellular epigenomic toxicity. These results allowed us to confirm the epigenetic mechanism by which TiO2 NPs damage human respiratory cells.
Introduction
In recent decades, titanium dioxide nanoparticles (TiO2 NPs) have been mass-produced for their worldwide applications in food-related industries, materials for air pollution control, pharmaceuticals and personal care products.1 The extensive production and use of TiO2 NPs has increased the level of human exposure through multiple media and pathways. TiO2 NPs can be delivered directly into the human body as nano-food or nanomedicine.2 Due to their small particle size, industrially released TiO2 NPs can also be inhaled as airborne particulate matter.3 Concerns are increasing about the possible health implications of exposure to TiO2 NPs.4,5Increasing number of evidence has shown that TiO2 NPs exert a variety of adverse health effects including liver function damage, nephrotoxicity and pulmonary toxicity.6–8 Both in vitro and in vivo toxicological assays have characterised the harmful effects of TiO2 NPs on organs and tissues, especially in the respiratory system. For example, a study on mice indicated that nano-TiO2 could induce severe pulmonary emphysema, extensive disruption of alveolar septa and type II pneumocyte hyperplasia.8 Inhalation of nano-TiO2 was found to provoke lung inflammation in mice via the biological activity of IL-1α.9 Additionally, in vitro assays showed that TiO2 NPs elicited distinct apoptotic pathways in bronchial epithelial cells through lysosomal membrane destabilisation and lipid peroxidation.10 Oxidative stress was also detected in human pulmonary epithelial cells after exposure to TiO2 NPs.11
To extend current knowledge, further study is required of the possible epigenetic effects of TiO2 NPs on respiratory cells. At present, the genomic toxicity of TiO2 NPs and their ability to affect the cellular epigenome of human respiratory cells remain largely unexplored. It is generally accepted that epigenetic factors regulate the interplay between genes and the environment, and thus affect human diseases.12 Additionally, epigenetic alterations in airway cells have been found to be associated with respiratory diseases.13 Multiple studies have found evidence that DNA methylation plays a role in human respiratory diseases.14,15 Therefore, TiO2 NPs may have epigenetic effects on human respiratory cells.
Epigenetic effects are heritable changes, caused by environmental factors, that regulate gene expression via alterations in chromatin proteins without changes in DNA sequences.16 DNA methylation is a major epigenetic modification that can regulate gene expression.17 Aberrant DNA methylation has been demonstrated in a variety of diseases.18 Genomic DNA methylation is catalysed by the activities of methylation enzymes, including DNA methyltransferase 1 (DNMT1), DNMT3a and DNMT3b. Ten-eleven translocation (TET) proteins catalyse the hydroxymethylation step in the DNA demethylation pathway.19 Methyl-CpG-binding domain protein 2 (MBD2), with its ability to bind to methylated DNA, appears to function as a mediator of the biological consequences of the methylation signal.20 Numerous studies have indicated that exposure to nanoparticles can compromise the DNA methylome. For example, exposure of human small-airway epithelial cells to engineered nanoparticles emitted by laser printers was found to result in alterations in both global DNA methylation patterns.21 Short-term exposure to engineered nanomaterials was also found to affect the epigenome of macrophages and airway epithelial cells.22 Another study found that multi-walled carbon nanotubes could induce DNA hyper-methylation.23 Taken together, these studies confirm the epigenetic effects of nanoparticles and highlight the importance of DNA methylation in the study of nanoparticle toxicity. In this context, TiO2 NPs of different diameters and crystal forms may represent a new set of tools to study the influence of nanoscale geometry on cell behaviour.24,25
In this study, the biological responses of human respiratory cells exposed to TiO2 NPs were evaluated across a wide range of exposure doses. TiO2 NPs with two different diameters (25 nm and 60 nm) and of nanotube or anatase type were used to investigate the influence of particle size and crystal form. The methylation status of genomic DNA and the expression of Dnmt3b, TETs and Mbd2 in the treated cells were also assessed.
Materials and methods
1. Chemicals
Titanium dioxide nanotubes of 25 nm average diameter (TiO2-N25) were purchased from Sigma-Aldrich (St. Louis, MO, USA). Anatase TiO2 of 60 nm average diameter (TiO2-A60) was purchased from Aladdin (Shanghai, China). A stock suspension of TiO2 NPs at a concentration of 10 mg mL−1 was prepared in cell culture media and ultra-sonicated for 10 min. The TiO2 NPs were further diluted in cell culture media to 0.1, 1, 10 and 100 μg mL−1 and sonicated within 5 min before the treatment.Dimethylsulphoxide (DMSO) and N-acetyl-L-cysteine (NAC) were also obtained from Sigma-Aldrich (St. Louis, MO, USA). NAC was used at 3 mmol L−1 and added 1 h before TiO2 NPs-treatment. Trypsin and a penicillin–streptomycin mixture for cell culture were purchased from Hyclone Laboratories, Inc. (Logan, UT, USA). Roswell Park Memorial Institute (RPMI) 1640 medium, minimum essential Eagle's medium (MEM) and foetal bovine serum (FBS) were purchased from Gibco (Carlsbad, CA, USA). A PrimeScript 1st Strand cDNA Synthesis Kit was purchased from Takara Biotechnology (Dalian, China).
2. TiO2 NP characterisation
The TiO2 NP stock suspensions were diluted in water and sonicated for 60 s at 60 W (Bioblock ultrasonic processor 75038, Bioblock Scientific, Illkirch, France) for preparation. The size and shape of the TiO2 NPs were determined using a scanning electron micrographs (SEM, S-4800, Hitachi, Tokyo, Japan). The hydrodynamic diameter and zeta potential of the TiO2 NPs were determined by dynamic light scattering (Brookhaven 90 Plus, Brookhaven Instruments Co, NY, USA). Measurements were run in triplicate for each sample.3. Cell culture
The human bronchial epithelial cell line 16HBE was kindly provided by Prof. D. C. Gruenert (University of California, CA, USA). The human non-small cell lung cancer cell line A549 was obtained from the Type Culture Collection of the Chinese Academy of Sciences (Shanghai, China). The 16HBE cells were cultured in fresh MEM supplemented with 10% (v/v) FBS, 100 μg mL−1 penicillin and 100 μg mL−1 streptomycin in a cell culture flask in an atmosphere containing 5% CO2 at 37 °C in an incubator. The A549 cells were cultured in fresh RPMI 1640 medium containing 10% (v/v) FBS, 100 μg mL−1 penicillin and 100 μg mL−1 streptomycin.The culture medium was changed every 48 h, and the cells were subcultured every 3 to 4 days at approximately 80% confluence. When the cultured cells had grown to about 80% confluence, the cultures were treated with TiO2-N25 or TiO2-A60 at different concentrations (0.1, 1, 10 and 100 μg mL−1) for 48 h, and the control cells were cultured with regular culture medium without TiO2 NPs.
4. Cell viability assay
The cell viability of the 16HBE and A549 cells after treatment with TiO2 NPs was tested by 3-(4,5-dimethylthiazol-2-yl)-2,5-diphenyltetrazolium bromide (MTT) assay. The cells were plated on 96-well plates at a density of 4 × 10⁴ cells per mL and then incubated for 24 h. Different concentrations of TiO2-N25 or TiO2-A60 (in the range 0.1–100 μg mL−1) were added into the cell culture and incubation was continued for 24–72 h. Wells containing culture medium but no cells were used as the blank, and wells containing culture medium without TiO2 NPs treatment were used as the control. After adding 20 μL of MTT (5 mg mL−1) into each well and incubating for 4 h at 37 °C, the MTT medium was discarded and the cells were lysed in 100 μL of DMSO. The optical density (OD) at 490 nm was measured by a multiwell-plate reader (Bio-Tek EL 808, Bio-Tek Instruments Inc, Colmar, France). Cell viability values (%), expressed as the percentage of absorbance values at each dose compared to the vehicle control, were calculated by (ODTiO2 NPs − ODblank)/(ODcontrol − ODblank) × 100%.5. Cellular membrane integrity assay
Cellular membrane integrity was evaluated using the CytoTox-One Homogenous Membrane Integrity Assay (Promega, Madison, WI, USA) following exposure to different concentrations of TiO2-N25 or TiO2-A60 (0.1–100 μg mL−1) for 24, 48 and 72 h. This assay was performed to estimate the number of non-viable cells present after exposure to TiO2 NPs by measuring the activity of lactate dehydrogenase (LDH) leaked from the cells.6. Determination of the intracellular reactive oxygen species (ROS) content
The ROS content generated in the 16HBE and A549 cells was measured by the oxidant-sensitive probe DCFH-DA according to the manufacturer's instructions (Beyotime, Shanghai, China). Briefly, the cells were treated with different concentrations of TiO2 NPs (N25 or A60 in the range 0.1–100 μg mL−1) or co-treatment with NAC for 48 h and then stained with DCFH-DA 10 μM at 37 °C for 20 min. The cells were rinsed and imaged by using the fluorescence microscope (Olympus, Tokyo, Japan) at 488 nm for excitation. The fluorescence intensities of DCFH-DA in the cells were analyzed using Image-Pro Plus software (Media Cybernetics, Silver Spring, MD, USA).7. Analysis of genomic DNA methylation
Genomic DNA from the 16HBE and A549 cells was extracted using a Wizard Genomic DNA Purification Kit (Promega, Madison, WI, USA). Genomic DNA methylation was determined by a MethylFlash Methylated DNA Quantification Kit (Epigentek, Brooklyn, NY, USA) according to the manufacturer's instructions.8. RNA isolation and quantitative real-time PCR (Q-PCR)
Total cellular RNA was isolated from the cells using Trizol reagent (Invitrogen, Carlsbad, CA, USA). Reverse transcription for cDNA synthesis was performed using Revert Aid First Strand cDNA Synthesis Kits (Fermentas, Hanover, MD, USA). Quantifications of gene transcripts were performed by Q-PCR on the 7900HT fast real-time PCR system (Applied Biosystems, Foster City, CA, USA) using SYBR Green PCR Master Mix reagents (Applied Biosystems, Framingham, MA, USA). Samples were analysed in triplicate. The Q-PCR cycle conditions were 95 °C for 2 min, followed by 40 cycles of denaturation at 95 °C for 15 s and annealing and extension at 60 °C for 1 min. The relative gene expression values were calculated by the 2−ΔΔCt method and normalised to values obtained from the housekeeping gene GAPDH. Three independent experiments were performed for each target. Primer sequences for Q-PCR are listed in Table 1.| Gene | Primer sequence (5′–3′) | Accession number |
|---|---|---|
| Gapdh | Forward: AACGACCCCTTCATTGAC | NM_001256799.2 |
| Reverse: TCCACGACATACTCAGCAC | ||
| Dnmt3b | Forward: CCGCTTCCTCGCAGCAG | NM_001207055.1 |
| Reverse: TGGGCTTTCTGAACGAGTCC | ||
| Mbd2 | Forward: GGGAAGAGGATGGATTGCCC | NM_003927.4 |
| Reverse: AGCTGACGTGGCTGTTCATT | ||
| Tet1 | Forward: CCAAGTCATGCAGCCCTACC | XM_011540204.1 |
| Reverse: CACAAGGTTTTGGTCGCTGG | ||
| Tet2 | Forward: CCCGCTGAGTGATGAGAACA | NM_001127208.2 |
| Reverse: TGTGCTGCTGAATGTTTGCC | ||
| Tet3 | Forward: ACCTGCCAGGCCTTTATGAC | NM_001287491.1 |
| Reverse: ACCACACCGTTTCCGTTTCT |
9. Western blot analysis
The total proteins in the 16HBE and A549 cells were extracted using radio-immunoprecipitation assay (RIPA) lysis buffer (Beyotime, Shanghai, China) containing 1 mM phenylmethanesulfonyl fluoride (Sigma-Aldrich, St. Louis, MO, USA). The concentrations of total protein were determined by BCA protein assay kits (Beyotime, Jiangsu, China). Total proteins from each group were separated by a 12% denaturing polyacrylamide gel. The blotted membranes were blocked using 5% (w/v) non-fat milk in Tris-buffered saline (TBS) and incubated with anti-β-actin, anti-DNMT3B or MBD2 (1![[thin space (1/6-em)]](https://www.rsc.org/images/entities/char_2009.gif) :
:![[thin space (1/6-em)]](https://www.rsc.org/images/entities/char_2009.gif) 1000, Abcam, Cambridge, UK) for 2 h at 37 °C. The membranes were incubated with secondary antibody (LI-COR Bioscience, Lincoln, NE, USA) and the protein bands were visualized using an enhanced chemiluminescence method, and then quantified by Image J.
1000, Abcam, Cambridge, UK) for 2 h at 37 °C. The membranes were incubated with secondary antibody (LI-COR Bioscience, Lincoln, NE, USA) and the protein bands were visualized using an enhanced chemiluminescence method, and then quantified by Image J.
10. Statistical analysis
Data are expressed as means ± SD. Statistical analysis was performed using SPSS 13.0 (SPSS Inc., Chicago, IL, USA). Comparisons between all cellular parameters after exposure were performed using one-way analysis of variance and the Tukey correction for multiple-comparison statistical significance. A P value <0.05 was considered to be statistically significant. All experiments were independent and conducted in triplicate or more.Results
1. TiO2 NP characterization
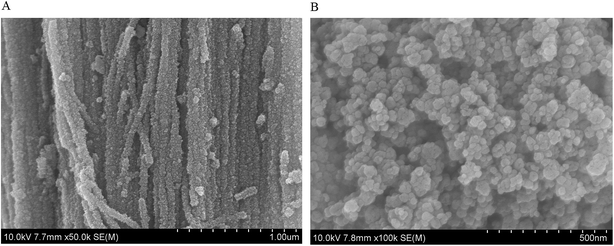
The TiO2 NPs (of the nanotube type with particle size of 25 nm, or of the anatase type with particle size of 60 nm) were characterized for their size, shape, hydrodynamic diameter and zeta potential before cell culture experimentation. The SEM images of TiO2 NPs were shown in Fig. 1 which confirmed the size and shape described by Sigma-Aldrich and Aladdin. Physico-chemical characteristics (diameter, zeta potentials and hydrodynamic diameters of the suspended particles in water and culture mediums) of the TiO2 NPs are given in Table 2. Both types of TiO2 NPs showed negative zeta potentials in all media. In both MEM and RPMI 1640 culture mediums, the TiO2-A60 particles showed less negative surface charge than TiO2-N25. The analysis of the hydrodynamic diameters showed that both types of TiO2 NPs formed small aggregates in water, RPMI 1640 and MEM suspension. TiO2-N25 presents a population of aggregates with a mean particle size of 125 nm in water, 372 nm in RPMI 1640 and 254 nm in MEM. In water, the TiO2-A60 particles formed one population of smaller aggregates (51 nm) and another population of larger ones (320 nm). TiO2-A60 also formed both smaller and larger aggregates in RPMI 1640 and MEM, with size distributions of 86 and 620 nm, and 101 and 620 nm, respectively.| Diameter | Average SEM size (nm ± SD) | Zeta potential (mV) | Hydrodynamic diameter (nm) | Crystalline structure | |||||
|---|---|---|---|---|---|---|---|---|---|
| Water | RPMI 1640 | MEM | Water | RPMI 1640 | MEM | ||||
| TiO2-N25 | 25 nm | 20.9 ± 1.5 | −22.3 | −12.5 | −10.8 | 125 | 372 | 254 | Nanotube |
| TiO2-A60 | 60 nm | 51.9 ± 8.7 | −13.1 | −7.6 | −6.4 | 51 and 320 | 86 and 572 | 101 and 620 | Anatase |
2. Effects of TiO2 NP exposure on cell viability
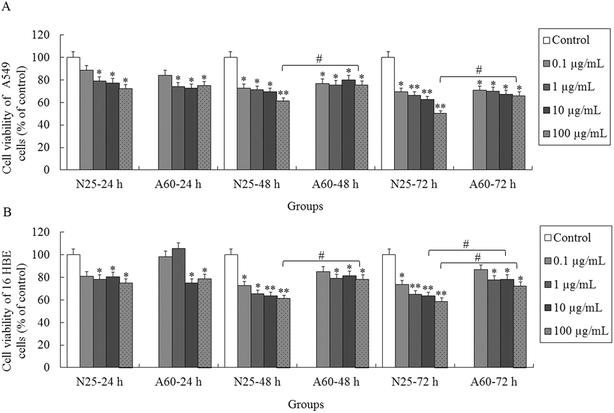
To investigate whether the TiO2 NPs exerted cytotoxic effects on the A549 and 16HBE cells, the cell viabilities were determined by MTT after 24, 48 and 72 h of treatment. We observed distinct cellular responses to the two types of TiO2 NP. As shown in Fig. 2A, the cell viabilities of the A549 cells significantly decreased (P < 0.05) after exposure to either TiO2-N25 or TiO2-A60 at concentrations of 1–100 μg mL−1 for 24 h. For the 16HBE cells, TiO2-N25 inhibited the cell viabilities (compared with the control) at all concentrations in the range 1–100 μg mL−1 after 24 h treatment (Fig. 2B, P < 0.05). However, 24 h treatment with TiO2-A60 caused a significant decrease in the cell viabilities of the 16HBE cells only at concentrations of 10 and 100 μg mL−1. For longer treatment times (48 and 72 h), the decrease in cell viability increased with each increment of the treatment time. The cell viability of both cell lines decreased more strongly with higher treatment concentrations, longer treatment times and smaller particle sizes.3. Effects of TiO2 NP exposure on cellular membrane integrity
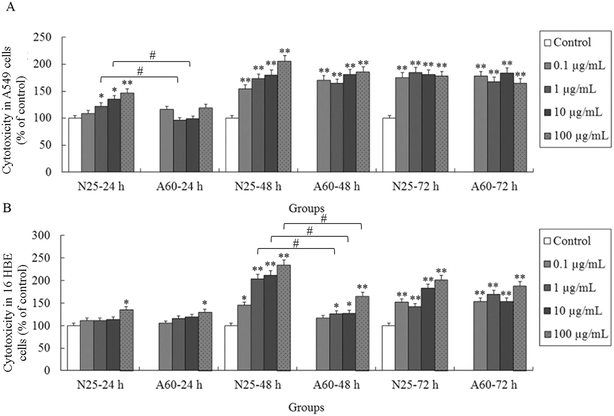
The cellular membrane integrity of the 16HBE and A549 cells was tested after treatment with TiO2-N25 or TiO2-A60 at concentrations of 0, 0.1, 1, 10 and 100 μg mL−1 for 24, 48 and 72 h. Fig. 3A and B illustrates the results of the LDH assay, showing each treatment at various administered doses and times. The A549 cells experienced a significant increase of cell death after exposure to TiO2-N25 at concentrations of 1–100 μg mL−1 for 24 h (Fig. 3A, P < 0.05). The effects of TiO2-N25 on the A549 cells were more prominent after 48 h and 72 h than after 24 h (Fig. 3A, P < 0.01). Compared with the control, treatment with TiO2-A60 significantly increased the cytotoxicity against A549 cells at 0.1–100 μg mL−1 after 48 h and 72 h of exposure (P < 0.01). For the 16HBE cell line, the TiO2 NPs were cytotoxic only at higher concentrations and longer treatment times, as shown in Fig. 3B. It is evident from Fig. 3B that the 16HBE cells were less sensitive to TiO2-N25 than the A549 cells were, as higher concentrations were required for cytotoxic effects after 24 h treatment. Nevertheless, the TiO2-N25 particles were more toxic against both cell lines than TiO2-A60. In the subsequent experiments, treatments were performed with TiO2 NPs at 0, 0.1, 1, 10 and 100 μg mL−1 for 48 h.4. Effects of TiO2 NP exposure on ROS synthesis
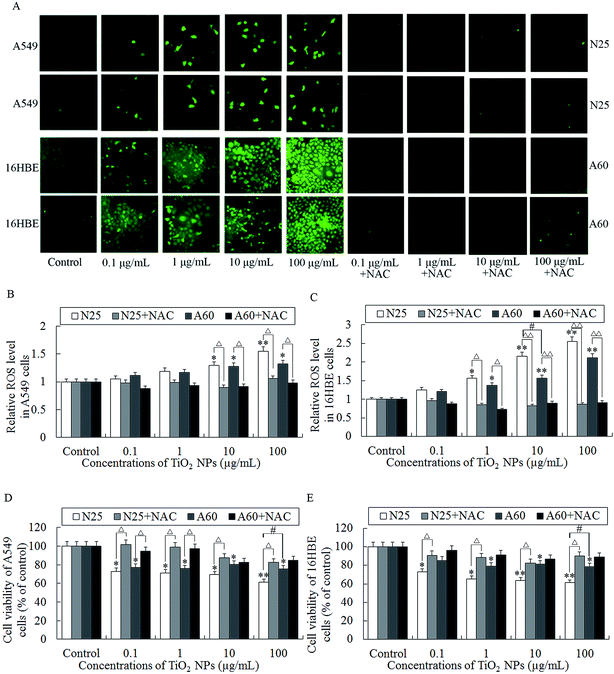
After exposure to TiO2 NP or co-treatment with NAC, the levels of intracellular ROS in the A549 and 16HBE cells were determined using the fluorescent ROS indicator DCFH-DA. The levels of intracellular ROS in the A549 cells were found markedly increased at 10–100 μg mL−1 compared with the control (Fig. 4A and B, P < 0.01). Quantification data demonstrated that the intensity of DCFH-DA fluorescence (representing the intracellular ROS level) in the 16HBE cells were significantly increased at 1–100 μg mL−1 compared with the control (Fig. 4A and C). These results indicated that TiO2 NPs induced ROS accumulation in the A549 and 16HBE cells. Statistical analysis of the DCFH-DA fluorescence levels of cells co-treatment with NAC demonstrated that NAC significantly reduced the TiO2 NP-induced ROS accumulation (Fig. 4A–C).Besides, the anti-oxidant NAC was used to test whether TiO2 NPs increased cell death via inducing ROS accumulation. As shown in Fig. 4D and E, co-treatment with NAC abolished TiO2 NP-induced cell death as determined by MTT which was consistent with the effect of NAC of reducing the levels of TiO2 NPs-induced ROS. Taken together, this study suggested that TiO2 NPs induced cell death mainly via a ROS-dependent mechanism.
5. Effects of TiO2 NP exposure on genomic DNA methylation
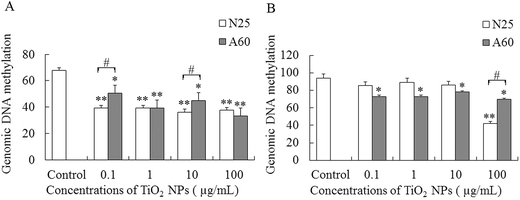
The degree of genomic DNA methylation of the A549 and 16HBE cells was determined after treatment with different concentrations of TiO2-N25 or TiO2-A60 for 48 h. As shown in Fig. 5A, the genomic DNA methylation levels of the A549 cells were reduced after exposure to TiO2-N25 at 0.1–100 μg mL−1 compared with the control (P < 0.01). After exposure to TiO2-A60, at all concentrations in the range 0.1–100 μg mL−1, the extent of DNA methylation in the A549 cells decreased significantly (hypomethylation) compared with the control (Fig. 5A, P < 0.05). The obtained results thus indicated that TiO2 NPs exposure induced a significant decrease of genomic DNA methylation in A549 cells. Fig. 5B shows that for the 16HBE cells, the global DNA methylation levels decreased after exposure to TiO2-N25 at 100 μg mL−1, compared with the control (P < 0.01). Moreover, for treatment with TiO2-A60, the genomic DNA methylation levels of the 16HBE cells were significantly decreased by all concentrations in the range 0.1–100 μg mL−1 (Fig. 5B, P < 0.05).6. Effects of TiO2 NP exposure on expression of Dnmt3b, Mbd2 and TETs in A549 and 16HBE cells
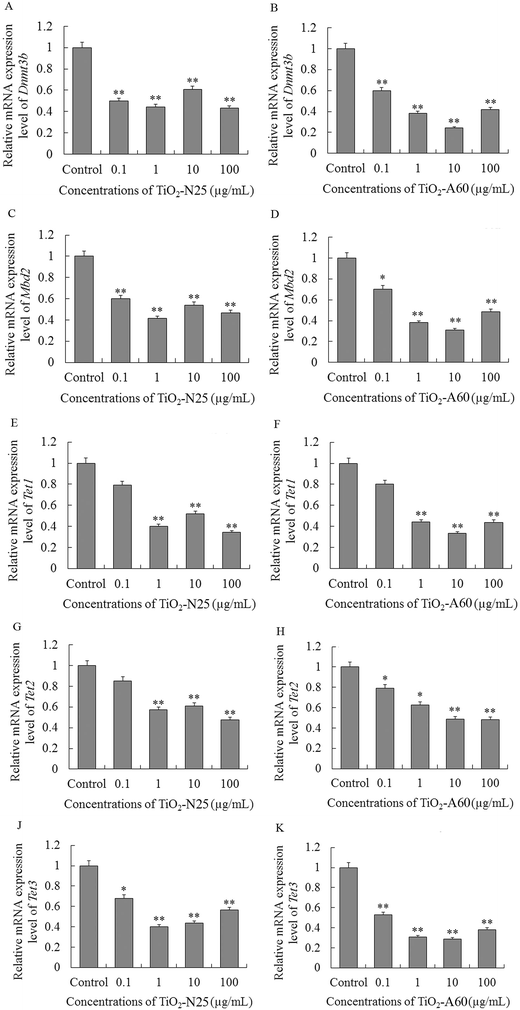
To investigate the possible mechanisms of the genomic DNA hypomethylation observed after exposure to TiO2 NPs, we further examined the expression levels of Dnmt3b, Mbd2 and TETs in the A549 and 16HBE cells.As shown in Fig. 6A, C and J, the mRNA expression levels of Dnmt3b, Mbd2 and Tet3 decreased in the A549 cells after exposure to TiO2-N25 at 0.1–100 μg mL−1 (P < 0.01). The mRNA expression levels of Tet1 and Tet2 decreased in the A549 cells after exposure to TiO2-N25 at 1–100 μg mL−1 (Fig. 6E and G, P < 0.01). TiO2-A60 reduced the mRNA expression levels of Dnmt3b, Mbd2, Tet2 and Tet3 in the A549 cells at 0.1–100 μg mL−1 (Fig. 6B, D, H and K, P < 0.01). The mRNA expression levels of Tet1 decreased in the A549 cells after exposure to TiO2-A60 at 1–100 μg mL−1 (Fig. 6F, P < 0.01).
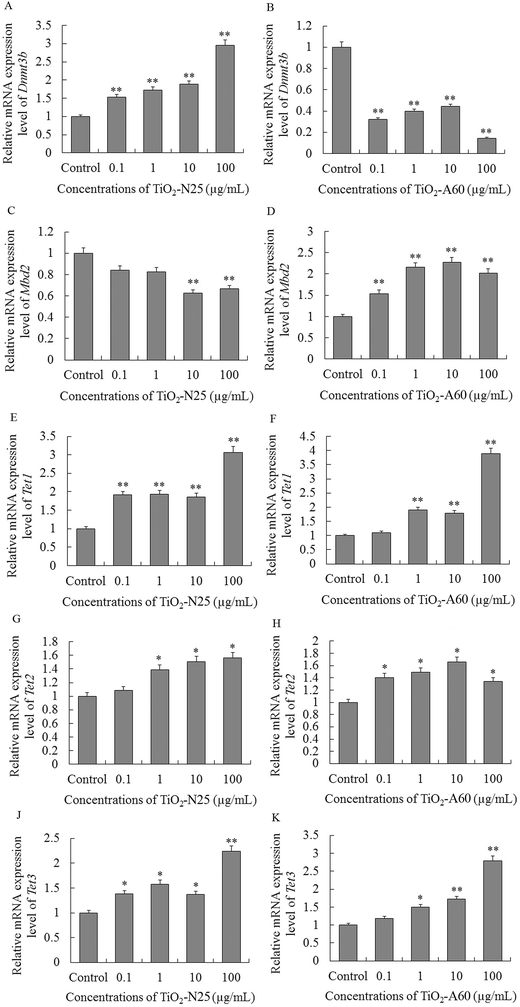
Interestingly, in the 16HBE cells, exposure to TiO2-N25 or TiO2-A60 (0.1–100 μg mL−1) had different (mostly opposite) effects on the expression of Dnmt3b, Mbd2, Tet1, Tet2 and Tet3 compared with the A549 cells (Fig. 7A–K). Exposure to TiO2-N25 caused an increase in the expression of Dnmt3b, Tet1, Tet2 and Tet3 in the 16HBE cells relative to the untreated cells (Fig. 7A, E, G and J). Only the expression of Mbd2 was reduced in the 16HBE cells after exposure to TiO2-N25, and only at relatively high concentrations (10–100 μg mL−1), as shown in Fig. 7C. Likewise, in the TiO2-A60 exposure groups, the expression of Mbd2, Tet1, Tet2 and Tet3 increased in the 16HBE cells (Fig. 7D, F, H and K).
Based on these results, we hypothesised that the changes in expression levels of Dnmt3b, Mbd2 and TETs may be associated with TiO2 NPs-induced genomic hypomethylation in the A549 and 16HBE cells.
7. Effects of TiO2 NP exposure on the expression levels of DNMT3B and MBD2 proteins
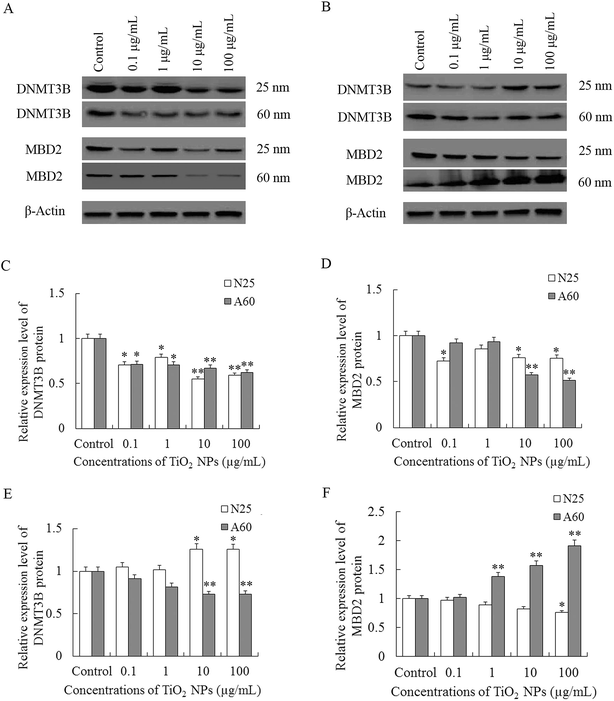
As shown in Fig. 8A and C, treatment of TiO2 NPs significantly reduced the levels of DNMT3B in A549 cells in a dose-dependent manner when compared with control (P < 0.05). The expression levels of MBD2 proteins were significantly decreased after TiO2-N25-treatment at concentrations of 0.1, 1, and 100 μg mL−1 and at concentrations of 10–100 μg mL−1 in the TiO2-A60 group (P < 0.05, Fig. 8A and D).In the 16HBE cells, exposure to TiO2-N25 caused an increase in the expression of DNMT3B at relatively high concentrations (10–100 μg mL−1) which was opposite to the A549 cells (P < 0.05, Fig. 8B and E). And in the TiO2-A60 groups, the MBD2 proteins were decreased at concentrations of 10–100 μg mL−1 (P < 0.01, Fig. 8B and E). However, the expression of MBD2 proteins were decreased after exposure to TiO2-N25 only at the highest concentration (100 μg mL−1) and were increased in the TiO2-A60 groups at concentrations of 1–100 μg mL−1, as shown in Fig. 8B and F.
Discussion
This study evaluated the potential toxicity of varying doses of TiO2 NPs on human respiratory cells. The alveolar epithelium and bronchial epithelial cells make direct contact with inhaled nanoparticles, so we chose two cell lines as in vitro models of this contact.11,25 The viability, membrane integrity, intracellular ROS and genomic DNA methylation of the cell lines, as well as their expression of methylation-related genes and proteins, were measured after exposure to two types of TiO2 NPs: those with particle sizes of 25 nm (nanotube crystalline phase) or 60 nm (anatase crystalline phase).Both types of TiO2 NPs were characterised physico-chemically before the exposure experiments. In MEM and RPMI 1640, the surface charge on the TiO2 NPs was less negative than in water. The decrease in charge was caused by a partial compensation of the negative charges by inorganic cations attracted to the surfaces of the TiO2 NPs in the cell culture media.26 The TiO2-N25 particles retained more negative surface charge than TiO2-A60. The relatively low zeta potentials of the particles reduced the stability of their nanodispersions, causing them to aggregate. The particles had greater hydrodynamic diameters in cell culture media than in water due to this enhanced aggregation. However, it has been reported that even in the form of aggregates, the cytotoxic effects of nanoparticles depend on the primary particle size and surface area.27
The viability and membrane integrity of both cell lines were negatively affected by treatment with TiO2-N25 or TiO2-A60. For both cell lines, the decrease in cell viability after exposure to TiO2 NPs was stronger for higher treatment concentrations, longer treatment times and smaller particle sizes. A previous study demonstrated that TiO2 NPs with diameters of 5 nm inhibited the proliferation of A549 cells in a dose- and time-dependent manner.28 In addition, the cytotoxicity results in this study suggested that A549 cells were more sensitive to exposure to TiO2-N25 than were 16HBE cells. This agrees with an earlier study showing that although TiO2 NPs with diameters of 21 nm were cytotoxic for both A549 and 16HBE cell lines at relatively high concentrations, A549 cells were more sensitive than 16HBE cells.11 The influence of size on the toxicity of TiO2 NPs has been further reported elsewhere.29,30 The cytotoxic effects of TiO2 NPs exposure on A549 and 16HBE cells evidently impair their normal functioning. More detailed mechanistic studies are needed to clarify the cellular responses to TiO2 NPs exposure.
TiO2 NPs possesses toxicity has been proofed, but the underlying mechanisms of which remain elusive. Disturbances in oxidative stress state of cells can cause toxic effects that damage all components of the cell, including proteins, lipids, and DNA. Oxidative stress causes base damage, which is mostly caused by ROS generated. Increased intracellular ROS accumulation has been shown to induce cell death. As demonstrated in a previous study, TiO2 (15 nm) NPs induces increased intracellular ROS in bronchial epithelial cells (16HBE14o-cell line and primary cells).10 In this study, the levels of intracellular ROS in the A549 and 16HBE cells were increased after exposure to TiO2 NP. Furthermore, the anti-oxidant NAC completely abolished the TiO2 NPs-induced ROS accumulation and cell death in both A549 and 16HBE cells. This study supports the concept that ROS accumulation plays a role the cytotoxicity of TiO2 NPs.
Although the potential adverse effects of TiO2 NPs have become more apparent in recent years,4 the epigenetic mechanisms responsible for the toxic effects of TiO2 NPs remain largely unknown. This work represents the first genome-wide study of DNA methylation in human respiratory cells treated with TiO2 NPs. We found that both TiO2-N25 and TiO2-A60 significantly reduced global DNA methylation levels in A549 and 16HBE cells. Moreover, the A549 cell line proved more sensitive to genomic DNA methylation by TiO2 NPs than did 16HBE cells. For the latter cell line, the epigenetic effects of TiO2-A60 were more significant than those of TiO2-N25. This observation is in line with previous studies reporting that anatase TiO2 NPs exhibited more pronounced genotoxicity and deleterious effects, due to the photocatalytic properties of anatase TiO2.25,30 Recently, exposure to various sources of particulate matter has been reported to affect DNA methylation.31–33 Consistent with our results, an in vitro study indicated that TiO2 particles of diameter 21 nm modestly affected DNA methylation in human small-airway epithelial cells (SAECs).22 Preliminary evidence has also been found that exposure to TiO2 nanotubes can regulate methylation levels in gene promoters.34 Global hypomethylation occurs early in tumorigenesis and predisposes cells to genomic instability and further genetic changes.35 DNA hypomethylation is associated with opening of the chromatin configuration and transcriptional activation, leading to chromosomal instability and aberrant expression of genes.36 Additionally, changes in global DNA methylation patterns have been shown to play a role in airway diseases.14,15 Thus, we conclude that these alterations in global DNA methylation were associated with the cytotoxic effects of TiO2 NPs and might further contribute to the higher risk of respiratory diseases. In addition, the variation in the effects of different TiO2 NPs on different cell lines suggests that both the cell line sensibility and the nanoscale particle geometry affect the outcome.
As previously reported, analysis of global DNA methylation may mask the redistribution of hypomethylation and hypermethylation, which may result in cumulatively unchanged levels of global DNA methylation.33 Therefore, to further investigate the mechanism of global hypomethylation induced by TiO2 NPs, the expression levels of Dnmt3b, Mbd2 and TETs were determined in this study. In addition to changes in genomic DNA methylation, changes in the expression of DNA methylation-related genes were evident in both cell lines post-treatment with TiO2 NPs. In the A549 cells, the expression levels of Dnmt3b, Mbd2 and TETs decreased after exposure to TiO2 NPs. However, in the 16HBE cell line, increased expression levels of Dnmt3b and TETs were observed in the TiO2-N25 groups, and of Mbd2 and TETs in the TiO2-A60 groups. Evidence indicates that DNMT3B can methylate hemimethylated and unmethylated CpG sites and also possesses maintenance functions.37,38 MBD2, with its ability to bind to methylated DNA, can suppress transcription from methylated target gene promoters. MBD2 is also reported to function as a demethylase to activate transcription.39 5-Methylcytosine (5-mC) can be converted to 5-hydroxymethylcytosine (5-hmC) by the TET proteins during DNA demethylation.19 Down-regulation of methyltransferases and Mbd2 at mRNA levels was previously reported after exposure to SiO2 nanoparticles, which were also associated with global hypomethylation.40 The expression levels of DNA methyltransferases and Tet1 were reduced in alveolar macrophages after treatment with laser printer-emitted engineered nanoparticles.41 Moreover, significant losses in the expression of Tet1 were observed following CuO exposure in alveolar macrophages and SAEC cells.22,41 Consequently, the observed loss of Dnmt3b and Mbd2 expression may be the cause of the global hypomethylation in this study, implying that hypomethylation was the result of inhibitory effects on de novo DNA methylation by TiO2 NPs. Indeed, there is evidence that increased expression of Dnmt3b and Mbd2 acts as regulatory feedback in response to genomic hypomethylation.42,43 The alterations in TETs expression suggest the diminished ability of TETs to convert 5-mC into 5-hmC during demethylation. As shown by the western blot analyses, the expression levels of these proteins were consistent with the expression level of their mRNAs.
In summary, exposure to TiO2 NPs has the potential to trigger an unfavourable biological response in two cell lines relevant to the respiratory system. The negative effects of TiO2 NPs include a decrease in cell viability, a rise in cell death, genomic hypomethylation and altered expression of methylation-related genes, and may lead to increased risk of respiratory diseases in individuals exposed to TiO2 NPs. The different levels of cytotoxicity suggest a cell-specific sensitivity in addition to the influence of nanoparticle characteristics. While TiO2 NPs are weak mutagens,44 they may have detrimental effects on the expression of methylation-related genes, leading to alterations in the extent of DNA methylation. Importantly, we have shown that genomic hypomethylation and altered expression of DNA methylation-related genes may occur after exposure to low doses (0.1 μg mL−1) of TiO2 NPs. Thus, our results indicated that both types of TiO2 NPs inhibited cell viability in a dose- and time-dependent manner. Moreover, the ability of TiO2 NPs to affect the cellular epigenome was demonstrated. The subsequent consequences of these altered epigenetic states remain unclear. Further investigations are needed to clarify the epigenomic effects of TiO2 NPs in cells and more importantly in vivo. In addition, a broader range of diameters for each particle type of TiO2 NPs remains to be investigated in future research work. This may enable us to identify key factors to predict the toxicity of nanomaterials.
Conclusion
Our data indicate that TiO2 NPs can elicit unfavourable biological responses in vitro. Exposure to TiO2 NPs led to significant changes in cell viability, cell death, intracellular ROS, cell genomic DNA methylation and methylation-related gene and protein expression. Moreover, the observed dysfunction of DNA methylation suggests that TiO2 NPs exert effects on the cellular epigenome. To further investigate the mechanism of toxicity in detail, a study on murine responses to TiO2 NP exposure via intratracheal instillation and whole-body inhalation is currently in progress.Author contributions
Y. M. and Y. G. performed the experiments involving cell culture, cell viability, cell membrane integrity and intracellular ROS. Y. G. analysed the DNA methylation, gene and protein expressions in the cultured cells. Y. M., Y. G., S. W., Z. L. and Z. Q. carried out the analyses of data and the statistical tests. Y. M. designed the experiments and Y. G. drafted the manuscript. All authors approved the final version of the manuscript to be published.Conflict of interest
None of the authors has any potential conflict of interest or financial interests to disclose.Acknowledgements
This work was supported by funds from the National Natural Science Foundation of China (81072323, 81602831), China Postdoctoral Science Foundation funded project (2016M602537) and the Guangdong Provincial Science and Technology Project (2013B021800032).References
- A. Weir, P. Westerhoff, L. Fabricius, K. Hristovski and N. von Goetz, Environ. Sci. Technol., 2012, 46, 2242–2250 CrossRef CAS PubMed
.
- X. X. Chen, B. Cheng, Y. X. Yang, A. Cao, J. H. Liu, L. J. Du, Y. Liu, Y. Zhao and H. Wang, Small, 2013, 9, 1765–1774 CrossRef CAS PubMed
.
- Y. Morimoto, H. Izumi, Y. Yoshiura, T. Tomonaga, B. W. Lee, T. Okada, T. Oyabu, T. Myojo, K. Kawai, K. Yatera, M. Shimada, M. Kubo, K. Yamamoto, S. Kitajima, E. Kuroda, M. Horie, K. Kawaguchi and T. Sasaki, Nanotoxicology, 2016, 10, 607–618 CrossRef CAS PubMed
.
- H. Shi, R. Magaye, V. Castranova and J. Zhao, Part. Fibre Toxicol., 2013, 10, 15 CrossRef CAS PubMed
.
- B. Ekstrand-Hammarstrom, J. Hong, P. Davoodpour, K. Sandholm, K. N. Ekdahl, A. Bucht and B. Nilsson, Biomaterials, 2015, 51, 58–68 CrossRef PubMed
.
- J. Wang, G. Zhou, C. Chen, H. Yu, T. Wang, Y. Ma, G. Jia, Y. Gao, B. Li, J. Sun, Y. Li, F. Jiao, Y. Zhao and Z. Chai, Toxicol. Lett., 2007, 168, 176–185 CrossRef CAS PubMed
.
- Y. Duan, J. Liu, L. Ma, N. Li, H. Liu, J. Wang, L. Zheng, C. Liu, X. Wang, X. Zhao, J. Yan, S. Wang, H. Wang, X. Zhang and F. Hong, Biomaterials, 2010, 31, 894–899 CrossRef CAS PubMed
.
- H. W. Chen, S. F. Su, C. T. Chien, W. H. Lin, S. L. Yu, C. C. Chou, J. J. Chen and P. C. Yang, FASEB J., 2006, 20, 2393–2395 CrossRef CAS PubMed
.
- A. S. Yazdi, G. Guarda, N. Riteau, S. K. Drexler, A. Tardivel, I. Couillin and J. Tschopp, Proc. Natl. Acad. Sci. U. S. A., 2010, 107, 19449–19454 CrossRef CAS PubMed
.
- S. Hussain, L. C. Thomassen, I. Ferecatu, M. C. Borot, K. Andreau, J. A. Martens, J. Fleury, A. Baeza-Squiban, F. Marano and S. Boland, Part. Fibre Toxicol., 2010, 7, 10 CrossRef PubMed
.
- R. Guadagnini, K. Moreau, S. Hussain, F. Marano and S. Boland, Nanotoxicology, 2015, 9(1), 25–32 CrossRef CAS PubMed
.
- L. Liu, Y. Li and T. O. Tollefsbol, Curr. Issues Mol. Biol., 2008, 10, 25–36 CAS
.
- J. Nicodemus-Johnson, K. A. Naughton, J. Sudi, K. Hogarth, E. T. Naurekas, D. L. Nicolae, A. I. Sperling, J. Solway, S. R. White and C. Ober, Am. J. Respir. Crit. Care Med., 2016, 193, 376–385 CrossRef CAS PubMed
.
- D. Stefanowicz, T. L. Hackett, F. S. Garmaroudi, O. P. Gunther, S. Neumann, E. N. Sutanto, K. M. Ling, M. S. Kobor, A. Kicic, S. M. Stick, P. D. Pare and D. A. Knight, PLoS One, 2012, 7, e44213 CAS
.
- W. Qiu, A. Baccarelli, V. J. Carey, N. Boutaoui, H. Bacherman, B. Klanderman, S. Rennard, A. Agusti, W. Anderson, D. A. Lomas and D. L. DeMeo, Am. J. Respir. Crit. Care Med., 2012, 185, 373–381 CrossRef CAS PubMed
.
- D. Rodenhiser and M. Mann, Can. Med. Assoc. J., 2006, 174, 341–348 CrossRef PubMed
.
- P. A. Jones, Nat. Rev. Genet., 2012, 13, 484–492 CrossRef CAS PubMed
.
- K. D. Robertson, Nat. Rev. Genet., 2005, 6, 597–610 CrossRef CAS PubMed
.
- S. Ito, L. Shen, Q. Dai, S. C. Wu, L. B. Collins, J. A. Swenberg, C. He and Y. Zhang, Science, 2011, 333, 1300–1303 CrossRef CAS PubMed
.
- B. Hendrich and A. Bird, Mol. Cell. Biol., 1998, 18, 6538–6547 CrossRef CAS PubMed
.
- S. V. Pirela, I. R. Miousse, X. Lu, V. Castranova, T. Thomas, Y. Qian, D. Bello, L. Kobzik, I. Koturbash and P. Demokritou, Environ. Health Perspect., 2016, 124, 210–219 Search PubMed
.
- X. Lu, I. R. Miousse, S. V. Pirela, S. Melnyk, I. Koturbash and P. Demokritou, Nanotoxicology, 2015, 1–11 CrossRef PubMed
.
- M. Ghosh, S. Bhadra, A. Adegoke, M. Bandyopadhyay and A. Mukherjee, Mutat. Res., 2015, 774, 49–58 CrossRef CAS PubMed
.
- J. Wang and Y. Fan, Int. J. Mol. Sci., 2014, 15, 22258–22278 CrossRef CAS PubMed
.
- M. L. Jugan, S. Barillet, A. Simon-Deckers, N. Herlin-Boime, S. Sauvaigo, T. Douki and M. Carriere, Nanotoxicology, 2012, 6, 501–513 CrossRef CAS PubMed
.
- L. C. Thomassen, A. Aerts, V. Rabolli, D. Lison, L. Gonzalez, M. Kirsch-Volders, D. Napierska, P. H. Hoet, C. E. Kirschhock and J. A. Martens, Langmuir, 2010, 26, 328–335 CrossRef CAS PubMed
.
- S. Hussain, S. Boland, A. Baeza-Squiban, R. Hamel, L. C. Thomassen, J. A. Martens, M. A. Billon-Galland, J. Fleury-Feith, F. Moisan, J. C. Pairon and F. Marano, Toxicology, 2009, 260, 142–149 CrossRef CAS PubMed
.
- Y. Wang, H. Cui, J. Zhou, F. Li, J. Wang, M. Chen and Q. Liu, Environ. Sci. Pollut. Res., 2015, 22, 5519–5530 CrossRef CAS PubMed
.
- A. Simon-Deckers, B. Gouget, M. Mayne-L'hermite, N. Herlin-Boime, C. Reynaud and M. Carriere, Toxicology, 2008, 253, 137–146 CrossRef CAS PubMed
.
- H. J. Johnston, G. R. Hutchison, F. M. Christensen, S. Peters, S. Hankin and V. Stone, Part. Fibre Toxicol., 2009, 6, 33 CrossRef PubMed
.
- A. Baccarelli, R. O. Wright, V. Bollati, L. Tarantini, A. A. Litonjua, H. H. Suh, A. Zanobetti, D. Sparrow, P. S. Vokonas and J. Schwartz, Am. J. Respir. Crit. Care Med., 2009, 179, 572–578 CrossRef CAS PubMed
.
- J. Madrigano, A. Baccarelli, M. A. Mittleman, R. O. Wright, D. Sparrow, P. S. Vokonas, L. Tarantini and J. Schwartz, Environ. Health Perspect., 2011, 119, 977–982 CrossRef CAS PubMed
.
- I. R. Miousse, M. C. Chalbot, N. Aykin-Burns, X. Wang, A. Basnakian, I. G. Kavouras and I. Koturbash, Environ. Mol. Mutagen., 2014, 55, 428–435 CrossRef CAS PubMed
.
- L. Lv, Y. Liu, P. Zhang, X. Zhang, J. Liu, T. Chen, P. Su, H. Li and Y. Zhou, Biomaterials, 2015, 39, 193–205 CrossRef CAS PubMed
.
- P. W. Laird and R. Jaenisch, Annu. Rev. Genet., 1996, 30, 441–464 CrossRef CAS PubMed
.
- E. Daura-Oller, M. Cabre, M. A. Montero, J. L. Paternain and A. Romeu, Bioinformation, 2009, 3, 340–343 CrossRef PubMed
.
- T. Chen, Y. Ueda, J. E. Dodge, Z. Wang and E. Li, Mol. Cell. Biol., 2003, 23, 5594–5605 CrossRef CAS PubMed
.
- I. Rhee, K. E. Bachman, B. H. Park, K. W. Jair, R. W. Yen, K. E. Schuebel, H. Cui, A. P. Feinberg, C. Lengauer, K. W. Kinzler, S. B. Baylin and B. Vogelstein, Nature, 2002, 416, 552–556 CrossRef CAS PubMed
.
- M. Fatemi and P. A. Wade, J. Cell Sci., 2006, 119, 3033–3037 CrossRef CAS PubMed
.
- C. Gong, G. Tao, L. Yang, J. Liu, Q. Liu and Z. Zhuang, Biochem. Biophys. Res. Commun., 2010, 397, 397–400 CrossRef CAS PubMed
.
- X. Lu, I. R. Miousse, S. V. Pirela, J. K. Moore, S. Melnyk, I. Koturbash and P. Demokritou, Nanotoxicology, 2016, 10, 629–639 CrossRef CAS PubMed
.
- Y. J. Wan, Y. Y. Li, W. Xia, J. Chen, Z. Q. Lv, H. C. Zeng, L. Zhang, W. J. Yang, T. Chen, Y. Lin, J. Wei and S. Q. Xu, Toxicology, 2010, 274, 57–64 CrossRef CAS PubMed
.
- Y. Ma, W. Xia, D. Q. Wang, Y. J. Wan, B. Xu, X. Chen, Y. Y. Li and S. Q. Xu, Diabetologia, 2013, 56, 2059–2067 CrossRef CAS PubMed
.
- K. Bhattacharya, M. Davoren, J. Boertz, R. P. Schins, E. Hoffmann and E. Dopp, Part. Fibre Toxicol., 2009, 6, 17 CrossRef PubMed
.
Footnote |
| † Both authors contributed equally to this work. |
| This journal is © The Royal Society of Chemistry 2017 |

