 Open Access Article
Investigation of the influence of Ni(II) exposure on the simultaneous nitrification and denitrification of aerobic granules from an internal oxygen penetration perspective†
Qian Feng *ab,
Yangyang Yub,
Chong Guoc,
Xindi Chend,
Jiashun Caoab and
Wen Yange
aKey Laboratory of Integrated Regulation and Resource Development on Shallow Lakes, Ministry of Education, Hohai University, Nanjing 210098, China. E-mail: xiaofq@hhu.edu.cn; Fax: +86-25-83787935; Tel: +86-13951725445
bCollege of Environment, Hohai University, Nanjing 210098, China
cSinopec Nanjing Engineering & Construction Incorporation, Nanjing 211100, China
dCollege of Harbour, Coastal and Offshore Engineering, Hohai University, Nanjing 210098, China
eCentral and Southern China Municipal Engineering Design & Research Institute Co. Ltd, Wuhan 430010, China
First published on 15th February 2017
Abstract
Lab-scale Sequencing Batch Reactors (SBR) were adopted to study the effects of Ni(II) exposure on the simultaneous nitrification and denitrification (SND) of the aerobic granular sludge under different concentrations of Ni(II) (1.0, 5.0 and 10.0 mg L−1). The degradation processes of chemical oxygen demand (COD) and nitrogen were investigated, as well as the SND efficiencies under various Ni(II) exposure. The results showed that the low concentration of Ni(II) (1.0 mg L−1) would stimulate degradation of COD and nitrification, while the high concentration of Ni(II) (10.0 mg L−1) caused inhibition. Meanwhile, the denitrification process was inhibited throughout the whole period of adding Ni(II). The highest SND efficiency was found under a 5.0 mg L−1 Ni(II) exposure, suggesting the very close rates of the nitrification and denitrification. Additionally, the dissolved oxygen (DO) penetration depths of aerobic granules were calculated through the specific DO uptake rate test. The ratio of aerobic zones to anoxic zone in aerobic granules was also used to explain the SND efficiency variation under different concentrations of Ni(II) exposure. It is apparent that the addition of Ni(II) could effectively change the internal aerobic/anoxic zone in aerobic granules, thereby contributing to the variation of the SND process.
1 Introduction
Nowadays toxic wastewater containing Ni(II) is mainly discharged from industrial enterprises including the electroplating, printing, electronic product machining, battery production and so on.1–4 The Ni(II) concentration in wastewater from mine drainage, tableware plating, metal finishing and forging was up to 130.0 mg L−1.5 Through participating in the food chain and then reacting with proteins, Ni(II) might seriously impact organisms via the accumulation of toxic effects.6–8 Despite of the legally required pretreatment of the industrial wastewater containing Ni(II) before being discharged into the municipal water drainage network,9 considerable amounts of Ni(II) have been found in the influent of wastewater treatment plants (WWTPs). The performance of WWTPs, mostly using the activated sludge process, might be affected by the exposure of Ni(II) as well.With the new development of activated sludge processes, the aerobic granular sludge technology has already become one of the hottest research orientations in the field of wastewater treatment.10,11 Compared with the conventional activated sludge, the aerobic granular sludge has outstanding characteristics including the excellent settleability, high organic loading, large biomass, high biological activity, strong tolerance to metal ions, etc., thus making the influences of Ni(II) on the aerobic granular sludge more and more attractive. Moreover, the impact of Ni(II) to granular sludge is more significant.12,13 Lan et al. proved that nickel was the basic element for aerobic granules.14 Wang et al. reported that Ni(II) would stimulate the biomass yield and bioactivity of aerobic granules under 5.0 and 15.0 mg L−1 Ni(II) exposure.15 Besides, the increase of biomass and extracellular polymeric substances (EPS) could elevate the tolerance of aerobic granules to Ni(II). The granular size might also affect the interaction between Ni(II) and EPS. And small aerobic granules (less than 850 μm) could form chemical binding between Ni(II) and EPS, while large aerobic granules could not.16
Simultaneous nitrification and denitrification (SND) means the phenomenon that both nitrification and denitrification processes occur simultaneously in the same reactor under the same operating condition, which will greatly simplify the biological nitrogen removal process and improve the efficiency of biological nitrogen removal. Moreover, the dissolved oxygen (DO) diffusion restriction allows the granular sludge to form anoxic and anaerobic zones, which makes the SND process widely observed inside the aerobic granules.17 There are a huge number of factors affecting the SND process, including DO, C/N, pH and so on. But so far, few researchers have studied the influence of Ni(II) on the aerobic granular sludge. And the affecting regularity and mechanisms have not been fully understood yet.
In the present study, the degradation processes of COD and nitrogen of aerobic granular reactors were investigated under different concentrations of Ni(II) exposure. And the SND efficiencies were obtained on the basis of ammonification rate and denitrification rate. Due to that SND is known to be controlled by aerobic and anoxic environments, the DO penetration depths inside aerobic granules were calculated to evaluate the environment for SND. Furthermore, the ratio of aerobic zone to anoxic zone in aerobic granules were used to explore the SND efficiency variation under different concentrations of Ni(II) exposure. The results could also be useful to understand the impact of Ni(II) on SND of aerobic granules.
2 Materials and methods
2.1 Reactor set-up and operation
In this study, four column plexiglass reactors were conducted in parallel. Every reactor was designed with working volume 2.25 L (inner diameter 0.05 m and height 1.3 m). Wastewater was added into each reactor through one peristaltic pump. An outlet located at 45 cm height was equipped to control the volumetric exchange rate at 50%. The air compressor pump and fine bubble diffusers were applied at the bottom of the reactor to keep the aeration rate at approximately 140 L h−1 via the controlling function of the gas-flowmeter. During the experiment, the controlling instruments showed that all the bubble rising velocities were about 2.0 cm s−1 among all the reactors, and the DO concentrations remained more than 4.0 mg L−1 during the period of aeration.The hydraulic reaction time (HRT) of the sequencing batch reactors (SBR) was set to 240 min including the water injection time (8 min), the aerobic time (224 min), the precipitation time (3 min) and the water discharge time (5 min). To avoid negative effects of the temperature change, the temperature of the SBR was kept at 25 °C by the automatic thermostat controlled by the microcomputer time control switch.
2.2 The inoculated sludge and experimental wastewater
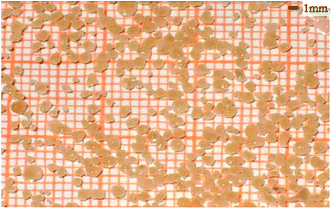
The aerobic granular sludge was cultivated carefully in advance in the laboratory, and was then selected for this research. Morphology of the aerobic granular sludge shows smooth surface, regular contour, compact structure and khaki color (Fig. 1).The average particle size of the cultivated aerobic granular sludge was about 2 mm, the distribution of which was listed in Table 1. And the sludge volume index (SVI) was 50.0 ± 5.0 mL g−1. The synthetic wastewater in this work contained CH3COONa 750.0 mg L−1, NH4Cl 300.0 mg L−1, KH2PO4 60.0 mg L−1, MgSO4·7H2O 25.0 mg L−1, CaCl2·2H2O 30.0 mg L−1 and trace solution 1.0 mg L−1. Moreover, the composition of the trace-element solution was H3BO3 50.0 mg L−1, ZnCl2 50.0 mg L−1, CuCl2 30.0 mg L−1, MnSO4 50.0 mg L−1, Na2Mo7O4·2H2O 60.0 mg L−1, Al(OH)3 50.0 mg L−1 and CoCl3·6H2O 50.0 mg L−1.18 During the whole experiment, solutions of NaOH (1.0 mol L−1) and HCl (1.0 mol L−1) were employed to adjust the pH of the wastewater so as to keep the pH within the range of 7–8.
| Particle size (mm) | >4.0 | 3.2–4.0 | 2.5–3.2 | 1.25–2.5 | <1.25 |
| Percentage (%) | 1.3 | 18.32 | 5.24 | 28.01 | 47.12 |
According to the related regulation of the Integrated Wastewater Discharge Standard of China (GB8978-1996), it is required that the highest allowable concentration of the total Ni can not exceed 1.0 mg L−1. Considering that the Ni(II) concentration of the current industrial wastewater in China is usually less than 10.0 mg L−1, the Ni(II) concentrations of this research were setup as 0, 1.0, 5.0 and 10.0 mg L−1 respectively.
2.3 Experimental method
Four different kinds of the synthetic experimental wastewater containing same amounts of cultivated aerobic granular sludge and four different concentrations of Ni(II) (shown in Table 2) were operated in the four parallel sequencing batch reactors (SBR) for long-term observation. During the experiment, the water qualities of both the influent and effluent, as well as the sludge characteristics were detected and analyzed periodically. The concentrations of the mixed liquor suspended solids (MLSS) were about 4500.0 mg L−1 before the four reactors start-up.| R1 system | R2 system | R3 system | R4 system | |
|---|---|---|---|---|
| Ni(II) | 0 mg L−1 | 1.0 mg L−1 | 5.0 mg L−1 | 10.0 mg L−1 |
Start-up of the reactors was supposed to be completed when the removal efficiencies of COD and ammonia nitrogen (NH3-N) exceeded 90% and 80% respectively.
After the stable operation of more than six weeks, continuous detection and analysis for the water and sludge samples were started in the four reactors. Through the observation, the changing processes of the concentrations of COD, NO3−-N, NO2−-N and NH3-N, as well as the rates of degradation of organics, nitrification, denitrification and SND were obtained under the influence of Ni(II) (with different concentrations) on the aerobic granular sludge.
2.4 Analytical methods
The determination procedures of COD, NO3−-N, NO2−-N, MLSS and SVI were detailed in the Standard Methods (APHA, 2005). The particle size of the granular sludge was measured using a particle-size analyzer. All assays were performed in triplicate, and the results are expressed as the mean ± standard deviation. Furthermore, the morphological structure of the sludge was observed by employing the scanning electron microscope (SEM) (JEOLJEM-1400, 120 kV, JAPAN).2.5 Calculations
The rates of nitrification, denitrification as well as SND were determined according to the following eqn (1), (2), and (3), respectively.Normally, the rate of nitrification consists of both the ammonification rate and the nitrite oxidation rate. However, the nitrification rate was thought to be equal to the ammonification rate in this study, resulting from that no nitrite existed in the synthetic influent wastewater. Besides, the ammonification rate (AOR) was defined as the concentration of NH4+-N oxidized by the activated sludge in unit time.19
 | (1) |
Since there was no nitrate in the synthetic influent wastewater, and the operation mode was continuous aerobic aeration, the denitrification process mainly relied on denitrifying bacteria to use NOx−-N generated from the nitrification process to conduct the reduction reaction, so as to transfer NOx−-N to N2. Therefore, the denitrification rate (DR) can be defined as the concentration of total nitrogen (TN) removed by the activated sludge in unit time.19
 | (2) |
The efficiency of SND was defined as the ratio of DR and AOR.20
 | (3) |
3 Results and discussion
3.1 Effects of different concentrations of Ni(II) on the nitrogen removal by SND
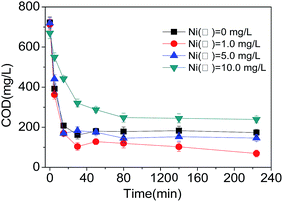
With the increasing of the concentrations of Ni(II) from 0 mg L−1 to 1.0 mg L−1, the COD concentration of the effluent dropped, and the removal efficiency of COD increased. Meanwhile, as the Ni(II) concentration increased continuously till 5.0 mg L−1, the COD concentration of the effluent increased, but the COD degradation efficiency did not change obviously. The COD removal efficiency in R3 system (Ni(II) 5.0 mg L−1) was apparently higher than that in the control system (R1), but lower than that of R2 system (Ni(II) 1.0 mg L−1).
When the Ni(II) concentration reached up to 10.0 mg L−1, the COD concentration of the effluent was much higher. Besides, during the first 40 min, the COD degradation was inhibited, resulting in the lower COD removal efficiency for R4 system (Ni(II) 10.0 mg L−1). This is in consistent with the research result from Ong et al. that the COD degradation could be inhibited with the increasing concentration of heavy metal ions in the activated sludge system.21 It is suggested that in the aerobic granular sludge system of this study, the degradation rate of COD would increase as the Ni(II) concentration increased from 0 mg L−1 to 1.0 mg L−1, however dropped as the concentration of Ni(II) increased continuously till 10.0 mg L−1 (Table 3). The consistent tendency of changes of the specific COD degradation rate and specific nitrification rate also confirmed the conclusion that the nitrification process would consume organics.
| Ni(II) concentration | 0 mg L−1 | 1.0 mg L−1 | 5.0 mg L−1 | 10.0 mg L−1 |
| Specific organic matter degradation rate (10−3 mg COD per mg MLSS per h) | 4.68 | 4.80 | 4.22 | 2.37 |
| Specific nitrification rate (10−3 mg NH4+-N per mg MLSS per h) | 7.61 | 9.24 | 6.03 | 5.25 |
| Specific denitrification rate (10−3 mg NOx−-N per mg MLSS per h) | 4.53 | 4.10 | 3.24 | 2.32 |
| Efficiency of SND (%) | 59.55 | 44.41 | 53.76 | 44.23 |
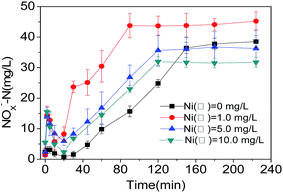
It is illustrated that the stable accumulation of NOx−-N in the four reactors started from the moment of 20 min (Fig. 4), while the linear accumulation of NOx−-N occurred during the 20–120 min period. Finally, the concentration of NOx−-N achieved stability after 120 min of reaction. Moreover, the cumulant of NOx-N in R1 system (Ni(II) 1.0 mg L−1) became the highest. As the Ni(II) concentration increased continuously from 1.0 mg L−1 to 5.0 mg L−1, the accumulation of NOx−-N was inhibited gradually. When the Ni(II) concentration increased up to 10.0 mg L−1, the far more obvious inhibition effects were presented.
From the above, it is found the nitrification process requires the inorganic carbon source, while the denitrification process need use the organic carbon source to transfer NH4+-N to NOx−-N, and then to realize the final nitrogen removal through the SND process. The whole process of the transformation primarily occurred in the first 120 min.
In this study, low-level Ni(II) (1.0 mg L−1) can stimulate the degradation rate of COD, as well as the nitrogen removal during the SND process. However, high Ni(II) concentration postponed the COD degradation process through the action of microorganism. Additionally, the growth and reproduction activities of microorganism in the activated sludge system could also be inhibited when the concentration of heavy metal ions reached beyond a certain boundary, thus reducing the purification efficiency of pollutants such as COD, nitrogen and phosphorus and so on.22
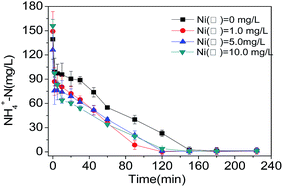
For the nitrogen process, the low Ni(II) concentration (1.0 mg L−1) accelerated the nitrogen, while the high concentration of Ni(II) (10.0 mg L−1) inhibited the nitrogen, which was consistent with the research results from Paolo et al.23 One of the possible explanations might be that nitrifying bacteria belong to one kind of autotrophic bacteria that have long growth cycle and response to the external environment much sensitively, leading to the inhibited nitrogen process of the aerobic granular sludge under the increasing loading of Ni(II).24
It is found that the utilization rate of ammonia nitrogen decreased with the increasing concentrations of Pb(II), Cd(II)23 and Ni(II).25 Coincidentally, Wang et al. confirmed that the removal efficiencies of TOC and NH4+-N decreased from 90.2% and 99.2% to 75.0% and 50.8%, respectively, when the Ni(II) concentration in the influent wastewater was high up to 10.0 mg L−1.26
It can be seen in Table 3 that the specific nitrification increased with the increasing of the Ni(II) concentration within a certain range, but decreased once the concentration of Ni(II) became too high. Moreover, the continuous decreasing rate of the specific denitrification could be attributed to that the microorganism played a dominating role in the biological treatment system for removing contaminants from the wastewater. During this process, some types of heavy metals were also needed at trace levels to serve as essential elements for healthy growth of the microorganism, so as to improve the degradation of nitrogen in the treatment system.
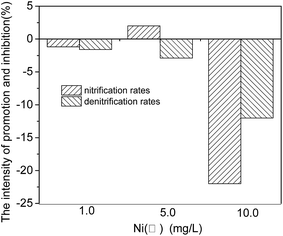
Fig. 5 indicated that the Ni(II) exposure made the denitrification efficiency be always inhibited, while the mid-level Ni(II) exposure (5.0 mg L−1) would stimulate the nitrification process compared to the low- and high-level Ni(II) exposure (1.0 mg L−1 and 10.0 mg L−1).
Nevertheless, the nitrogen removal efficiency of SND tended to drop firstly, then increased and dropped at last, with the increasing Ni(II) concentration of the system, indicating some inhibitory effects of Ni(II) on the nitrogen removal of SND. It has been reported that the nitrogen removal efficiency of SND could reach the highest when the rates of nitrification and denitrification were almost close to each other.27–29 In the present research, adding Ni(II) had an obvious impact on the SND efficiency. Hence, in the three reactors that were added Ni(II), the nitrogen removal efficiency of SND was much higher when the concentration of Ni(II) was 5.0 mg L−1, owing to the minor difference between the rates of nitrification and denitrification.
3.2 The influencing explanation of different concentrations of Ni(II) on the SND
The compact structure of the aerobic granular sludge made it limited for the internal mass transfer, thus helping form several kinds of DO environments (e.g., anoxic, anaerobic, etc.), among which the internal anoxic environment could create advantageous conditions for the SND process.17 For a further investigation of the influencing mechanism of different Ni(II) concentrations on SND of the aerobic granular sludge, the DO penetration depths under various concentrations of Ni(II) were calculated and analyzed.Considering that the aerobic granules belong to microorganism aggregate, the equation proposed to calculate the DO penetration depths of aerobic aggregate in Biofilm Airlift Suspension Reactor (BAS reactor) by Tijhuis et al. was simplified and used for calculating the DO penetration depth in the aerobic granular SBR.30,31 The DO penetration depths in the aerobic granular could be calculated as follows.
 | (4) |
It is demonstrated that the DO penetration depth in R1 system (Ni(II) 1.0 mg L−1) was lower than that in R0 system (Ni(II) 0 mg L−1), as shown in Table 4. However, as the concentrations of Ni(II) increased from 1.0 mg L−1 to 5.0 mg L−1 or even 10.0 mg L−1, the DO penetration depth increased as well. But it is worth noting that some relationships existed between the DO penetration depth and the mean particle size of the aerobic granular sludge under various Ni(II) concentrations. DO penetration degree is equal to DO penetration depth/mean particle size.
| Ni(II) concentrations | 0 mg L−1 | 1.0 mg L−1 | 5.0 mg L−1 | 10.0 mg L−1 |
| Mean particle size (mm) | 2.54 | 1.56 | 2.37 | 2.15 |
| DO penetration depth (mm) | 1.51 | 1.48 | 1.61 | 1.64 |
| DO penetration degree (%) | 59.45 | 94.87 | 67.93 | 76.28 |
With the increasing Ni(II) concentration in the reactors, the surface of the aerobic granular sludge would become smoother and smoother. Besides, the mean particle size of the aerobic granular sludge peaked in R3 system (Ni(II) 5.0 mg L−1). Though some previous studies showed that the higher particle size of the aerobic granular sludge was more beneficial to SND,32,33 it was better to take both the particle size and DO penetration depth into account to investigate SND more comprehensively, considering the impacts of Ni(II) on the internal environment of the aerobic granular sludge.21,34,35
The magnified SEM photographs of the aerobic granular sludge surface were given in Fig. 7. Some filamentous structures attached by a lot of mucoid materials existed inside the aerobic granular sludge. Furthermore, the increasing Ni(II) concentration favored the attachment of the mucoid materials. Some related studies showed that the filamentous bacteria was the framework of the aerobic granular sludge, which could make use of the attached mucoid materials to adhere to the micelle bacteria and then aggregated gradually under the selected pressure.36 The mucoid materials mentioned above were actually polysaccharides belonging to the products of microbial metabolism,37 which were also one type of the effective self-protection ways for the microorganism, especially in the case of unfavorable environments.
Therefore, in this study, the microorganism secreted more EPS for the purpose of self-protection from being poisoned as the Ni(II) concentration increased continuously in the reactors.38 When the concentration of Ni(II) was 10.0 mg L−1, the surface compaction rate of the aerobic granular sludge performed the best under the impact of the intertwined filiform structure inside the sludge and EPS secreted by the microorganism.
In addition, in the reactors where Ni(II) was added, it was shown that when the DO penetration depth became closer to 50%, the ratio of anoxic zone to aerobic zone was closer to 1.0, suggesting that the difference between the space volumes of nitrification and denitrification diminished (Table 4). When the Ni(II) concentration was 5.0 mg L−1, the gap between the space volumes of nitrification and denitrification was the smallest, hence indicating the highest nitrogen removal efficiency through the SND process.
From Fig. 6, the relationship between the ratio of anoxic zone to aerobic zone and the nitrogen removal efficiency of SND could be seen obviously. Fig. 7 showed the schematic explanation of the influence process of Ni(II) on microbial cells in aerobic granular sludge. Moreover, it showed the SEM photographs of the aerobic granular sludge surface under different conditions. (a) Ni(II) = 0 mg L−1 (×40), (b) Ni(II) = 1.0 mg L−1 (×40), (c) Ni(II) = 5.0 mg L−1 (×40), (d) Ni(II) = 10.0 mg L−1 (×40), (e) Ni(II) = 0 mg L−1 (×1500), (f) Ni(II) = 1.0 mg L−1 (×1500), (g) Ni(II) = 5.0 mg L−1 (×1500), (h) Ni(II) = 10.0 mg L−1 (×1500). The scope of the blue circles represented the anoxic zone inside the aerobic granular sludge. Firstly, the outer contour of the granular sludge was drawn by using the Auto CAD software. Secondly, properly select the central position of the granular sludge as the base point. Thirdly, zoom in or out the outer contour of the granular sludge in accordance with the ratio of the anoxic zone to the whole sludge zone. Then the area of the blue circles could be gained, which represented the anoxic zone of the aerobic granular sludge. The almost consistent changing trends under different concentrations of Ni(II) suggested that Ni(II) affected not only the distribution of DO in the aerobic granular sludge but also the nitrogen removal efficiency of SND.
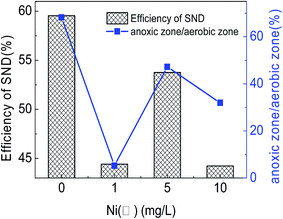 | ||
| Fig. 6 The relationship between the ratio of anoxic zone to aerobic zone and the nitrogen removal efficiency of SND under different concentrations of Ni(II). | ||
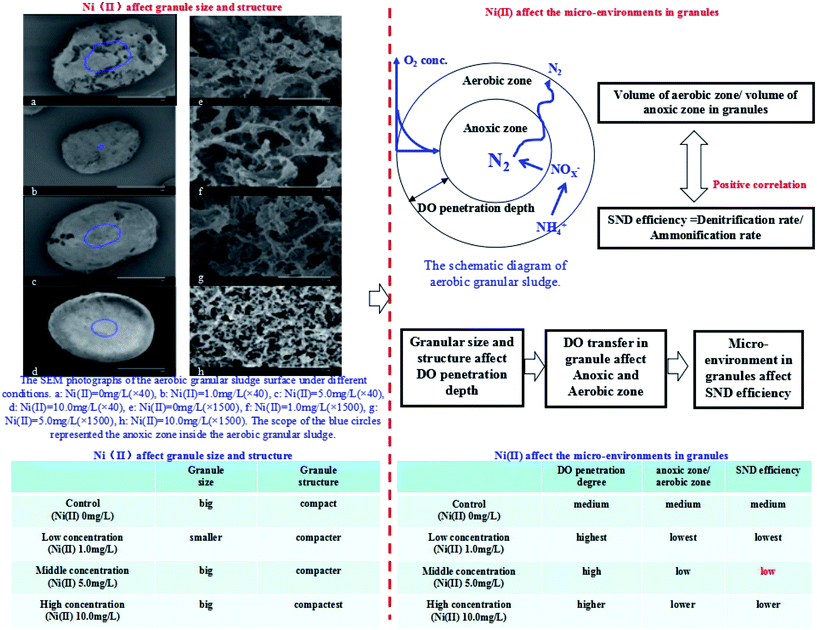 | ||
| Fig. 7 The schematic explanation of the influence process of Ni(II) on microbial cells in aerobic granular sludge. | ||
4 Conclusion
The influencing rule and mechanism of different Ni(II) concentrations on SND of the aerobic granular sludge were studied in this research. And the conclusions are presented as follows.(1) The nitrification process was inhibited all the time under different concentrations of Ni(II). In addition, the influencing rule of Ni(II) on the denitrification process was similar to that of Ni(II) on the COD degradation.
(2) The smaller difference between the rates of nitrification and denitrification was, the higher nitrogen removal efficiency of SND might be, which turned out to be 53.76% when the concentration of Ni(II) was 5.0 mg L−1 in this research when comparing the reactors that were added Ni(II).
(3) Under different concentrations of Ni(II), the nitrogen removal efficiency of SND could be influenced by both the internal environmental condition especially the DO distribution and the microbial community of the aerobic granular sludge. Ni(II) had an influence on the processes of nitrification and denitrification through affecting the nitrifying and denitrifying bacteria, which thereby influenced the SND process. And due to that the anoxic and aerobic zones in the aerobic granular sludge could affect the living condition of both nitrifying and denitrifying bacteria. As the concentration of Ni(II) grew up to 5.0 mg L−1, the rate of nitrification decreased due to the inhibition of nitrifying bacteria, making the difference between the rates of nitrification and denitrification smaller, thus exaggerating the nitrogen removal efficiency of SND.
Acknowledgements
This work was supported by the National Natural Science Foundation of China (51208173, 51579072).References
- A. Talebi, T. T. Teng, A. F. M. Alkarkhi and N. Ismail, RSC Adv., 2015, 48, 38424–38434 RSC.
- W. Ma, P. Zong, Z. Cheng, B. Wang and Q. Sun, J. Hazard. Mater., 2014, 266, 19–25 CrossRef CAS PubMed.
- U. Farooq, J. A. Kozinski, M. A. Khan and M. Athar, Bioresour. Technol., 2010, 101, 5043–5053 CrossRef CAS PubMed.
- T. Wu, B. Zhou, T. Zhu, J. Shi, Z. Xu, C. Hu and J. Wang, RSC Adv., 2015, 5, 7880–7889 RSC.
- H. Xu, Y. Liu and J. H. Tay, Bioresour. Technol., 2006, 97, 359–363 CrossRef CAS PubMed.
- A. Talebi, T. T. Teng, A. F. M. Alkarkhi, I. Norli and L. L. Low, Desalin. Water Treat., 2012, 47, 334–340 CrossRef CAS.
- B. Channarong, S. H. Lee, R. Bade and O. V. Shipin, Desalination, 2010, 262, 221–227 CrossRef CAS.
- S. Malamis and E. Katsou, J. Hazard. Mater., 2013, 252–253, 428–461 CrossRef CAS PubMed.
- E. Katsou, S. Malamis and K. J. Haralambous, Chemosphere, 2011, 82, 557–564 CrossRef CAS PubMed.
- X. Yan, Q. Li, L. Chai, B. Yang and Q. Wang, Chemosphere, 2014, 113, 36–41 CrossRef CAS PubMed.
- M. Pronk, M. K. de Kreuk, B. de Bruin, P. Kamminga, R. Kleerebezem and M. C. M. van Loosdrecht, Water Res., 2015, 84, 207–217 CrossRef CAS PubMed.
- Y. Liu and H. Xu, Biochem. Eng. J., 2007, 35, 174–182 CrossRef CAS.
- H. Xu and Y. Liu, Sep. Purif. Technol., 2008, 58, 400–411 CrossRef CAS.
- H. X. Lan, Y. C. Chen, Z. H. Chen and R. Chen, J. Environ. Sci., 2005, 17, 506–510 CAS.
- X. Wang, L. Gai, X. Sun, H. Xie, M. Gao and S. Wang, Appl. Microbiol. Biotechnol., 2010, 86, 1967–1975 CrossRef CAS PubMed.
- G. Zhang, L. Shi, Y. Zhang, D. Wei, T. Yan, Q. Wei and B. Du, RSC Adv., 2015, 5, 25279–25286 RSC.
- L. Yan, S. Zhang, G. Hao, X. Zhang, Y. Ren, Y. Wen, Y. Guo and Y. Zhang, Bioresour. Technol., 2016, 202, 101–106 CrossRef CAS PubMed.
- D. Wei, L. Shi, T. Yan, G. Zhang, Y. Wang and B. Du, Bioresour. Technol., 2014, 171, 211–216 CrossRef CAS PubMed.
- P. Lucjan, Standard methods for the examination of water and wastewater, Water Environment Federation, Alexandria, USA, 1994 Search PubMed.
- K. Third, N. Burnett and R. Cord-Ruwisch, Biotechnol. Bioeng., 2003, 83, 706–720 CrossRef CAS PubMed.
- S. Ong, E. Toorisaka, M. Hirata and T. Hano, J. Hazard. Mater., 2004, 113, 111–121 CrossRef CAS PubMed.
- Z. Hu, K. Chandran, D. Grasso and B. F. Smets, Water Res., 2004, 38, 3949–3959 CrossRef CAS PubMed.
- P. Madoni, D. Davoli and L. Guglielmi, Water Res., 1999, 33, 2459–2464 CrossRef CAS.
- S. Siripong and B. E. Rittmann, Water Res., 2007, 41, 1110–1120 CrossRef CAS PubMed.
- S. You, Y. Tsai and R. Huang, J. Hazard. Mater., 2009, 165, 987–994 CrossRef CAS PubMed.
- X. Wang, L. Gai, X. Sun, H. Xie, M. Gao and S. Wang, Appl. Microbiol. Biotechnol., 2010, 86, 1967–1975 CrossRef CAS PubMed.
- Y. Tsai, S. You, T. Pai and K. Chen, Int. Biodeterior. Biodegrad., 2005, 55, 285–291 CrossRef CAS.
- Y. Chiu, L. Lee, C. Chang and A. C. Chao, Int. Biodeterior. Biodegrad., 2007, 59, 1–7 CrossRef CAS.
- X. Zhang, J. Zhou, H. Guo, Y. Qu, G. Liu and L. Zhao, Process Biochem., 2007, 42, 620–626 CrossRef CAS.
- L. Tijhuis, M. C. M. van Loosdrecht and J. J. Heijnen, Biotechnol. Bioeng., 1994, 44, 595–608 CrossRef CAS PubMed.
- Q. Feng, J. S. Cao, L. N. Chen, C. Y. Guo, J. Y. Tan and H. L. Xu, J. Food, Agric. Environ., 2011, 9, 1131–1136 CAS.
- Y. Shi, X. Wang, H. Yu, H. Xie, S. Teng, X. Sun, B. Tian and S. Wang, Bioresour. Technol., 2011, 102, 2536–2541 CrossRef CAS PubMed.
- X. H. Wang, H. M. Zhang, F. L. Yang, L. P. Xia and M. M. Gao, Enzyme Microb. Technol., 2007, 41, 205–211 CrossRef CAS.
- C. F. Shen, N. Kosaric and R. Blaszczyk, Water Res., 1993, 27, 25–33 CrossRef CAS.
- A. H. Hawari and C. N. Mulligan, Process Biochem., 2006, 41, 187–198 CrossRef CAS.
- Y. Liu and Q. Liu, Biotechnol. Adv., 2006, 24, 115–127 CrossRef CAS PubMed.
- J. J. Beun, A. Hendriks, M. C. M. Van Loosdrecht, E. Morfenroth, P. A. Wilderer and J. J. Heijnen, Water Res., 1999, 33, 2283–2290 CrossRef CAS.
- D. Wei, M. Li, X. Wang, F. Han, L. Li, J. Guo, L. Ai, L. Fang, L. Liu, B. Du and Q. Wei, J. Hazard. Mater., 2016, 301, 407–415 CrossRef CAS PubMed.
Footnote |
| † Electronic supplementary information (ESI) available. See DOI: 10.1039/c6ra28196f |
| This journal is © The Royal Society of Chemistry 2017 |

